
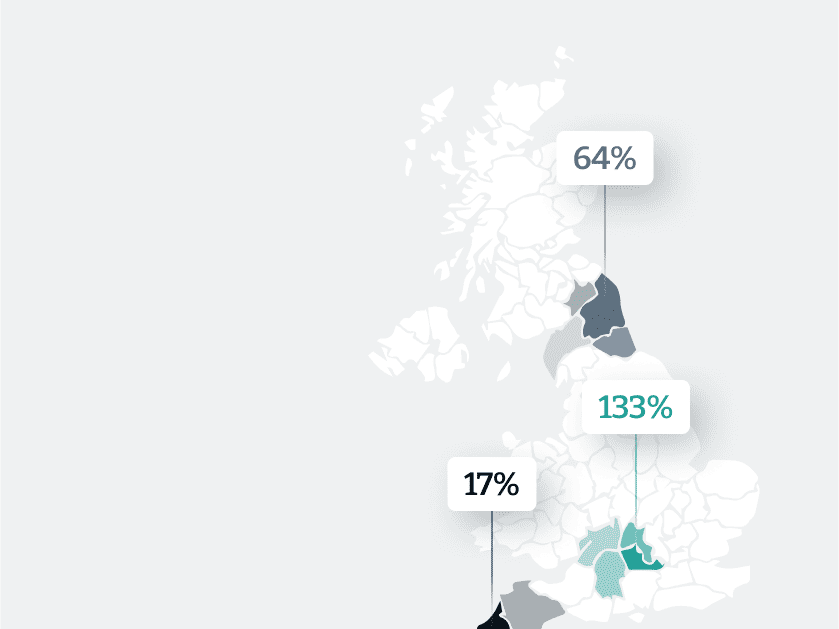
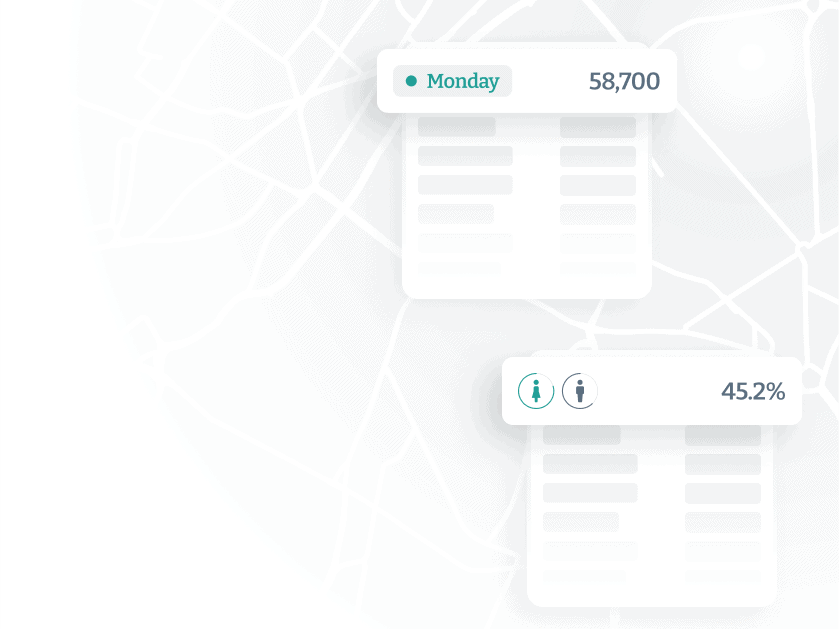
Understand transport and travel patterns
Precise transport planning
How can I optimise local transport routes?
What data can I use to help reduce congestion?
How can we change networks to improve sustainability?
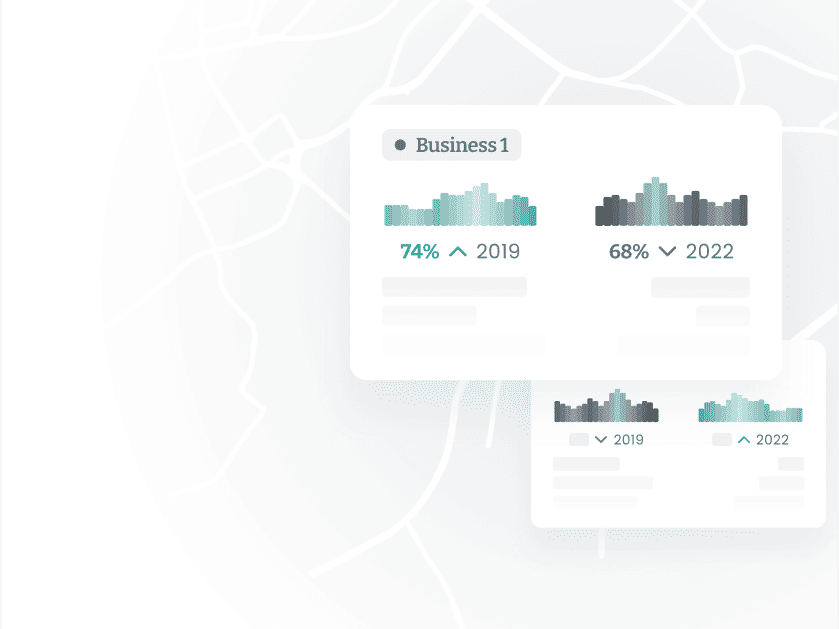
Location intelligence trusted by 300+ industry leaders


Targeted infrastructure investment
Optimise infrastructure development, such as transportation hubs and public amenities, to support economic growth in those areas.
Monitor routes and transport methods
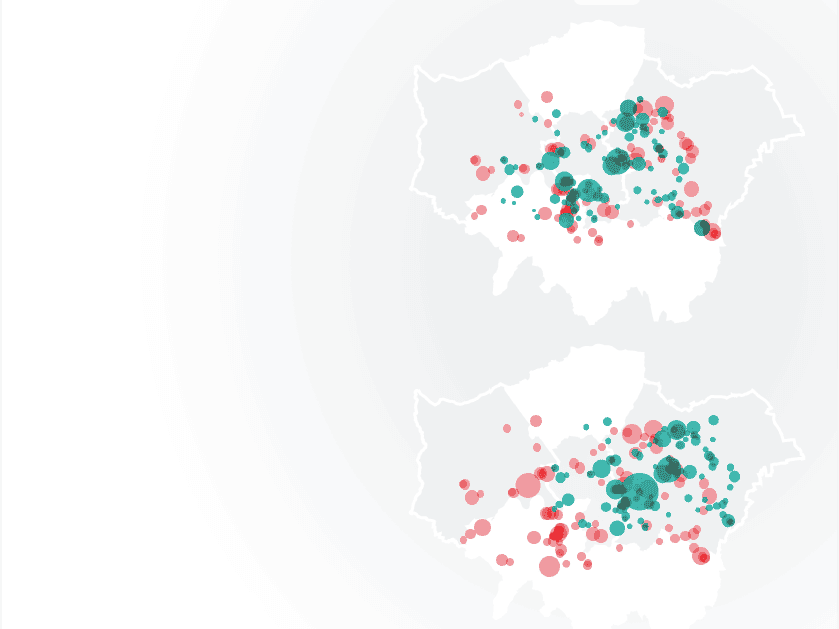
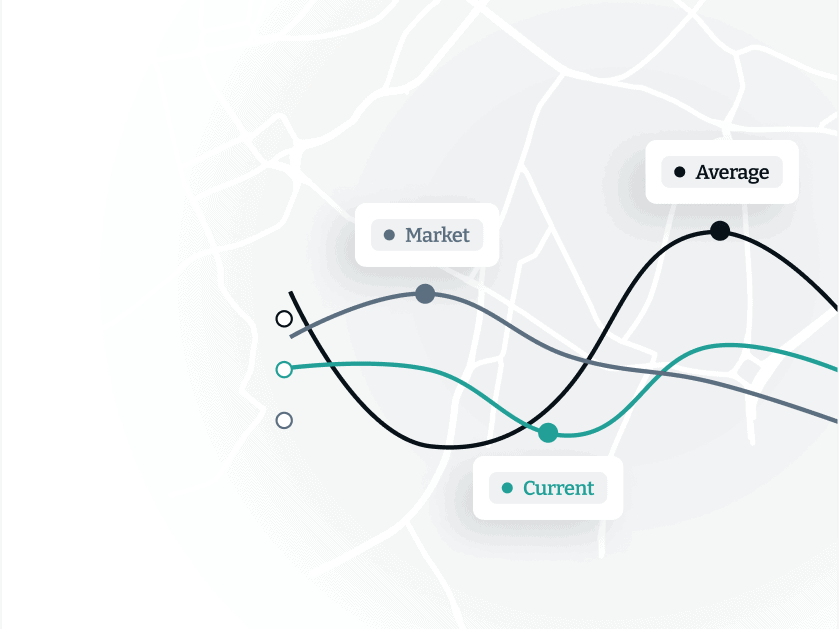
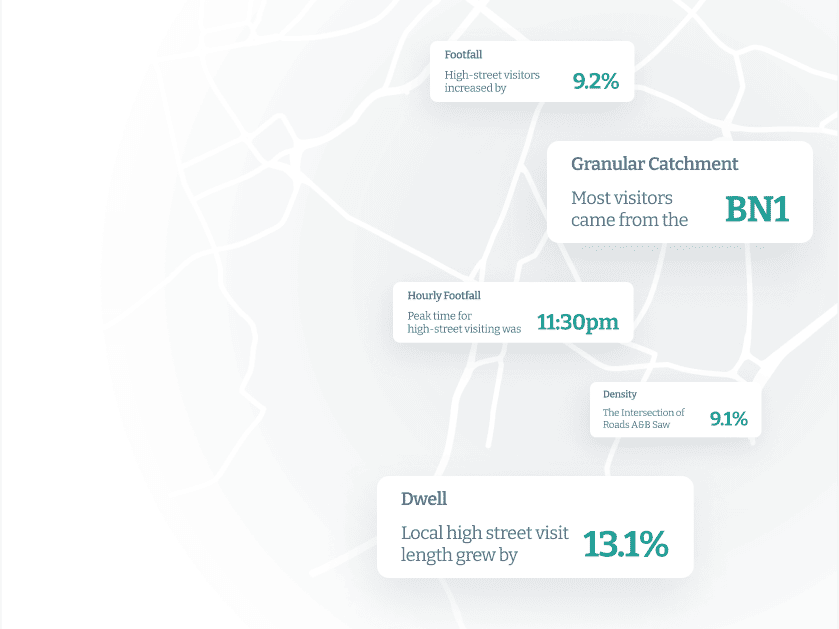
Surface patterns in popular destinations, peak travel times, and recurring travel routes to gain insights into typical travel behaviours with common travel routes, modes of transportation used, and frequency of travel.
See origins and destinations
Study origin-destination pairs to understand where people begin their journeys and where they end up to identify commuting patterns, popular travel corridors, and the interconnectivity of different regions.
Identify core behaviours
Uncover unique travel behaviours and preferences for different traveler profiles, such as commuters, tourists, or business traveler, enabling you to tailor services and offerings more effectively.
Identify new workforce trends
Leverage mobility data to pinpoint evolving commute patterns and understand where and when residents travel for work.
Business attraction and support
Attract businesses that align with local customer behaviours and provide support to industries that drive foot traffic.
4.8Bn
GBP Influence
3
Gov Departments
8
Uni partners
Huq’s data is real-time and that makes 3DI’s data even stronger and more valuable. Both local and central government bodies will be able to use it to get a clearer picture of the real economic impacts of Covid-19 across the country
Benjamin Lucas (PhD, FHEA), Managing Director at 3DI

Successful store planning
Successful store planning
How can I select sites for maximum yield?
What data can I use to better understand and evaluate the market?
How can we reduce risk and cannibalisation in our investment?
Location intelligence trusted by 300+ industry partners

Understand your market
Leverage foot traffic, movement patterns, or visit durations of specific demographics to create a comprehensive understanding that covers the time period and locations of interest.
Pinpoint your audience
Understand the demographics, behaviours, and preferences of the visitors in the identified areas.
Monitor behaviour shifts
Identify changes in foot traffic patterns, peak visit times, and customer preferences to align your strategies with evolving market dynamics.
Forecast sales
Develop detailed store forecasting based on current and past visitor behaviours and profiles and competitive insights on footfall, dwell, catchment, and travel insights.
Drive informed decisions
Leverage foot traffic data and customer behaviours to validate the effectiveness of your new store strategy and make adjustments as needed.
3400
Stores
38
Countries
$12.5Bn
Annual sales
Huq’s catchment insights allows JD to more accurately assess the impact of the wider retail catchment on the sales potential of new store opportunities
Alastair Browne, JD Group Head of Site Research & Strategic Insight
Successful franchising
Successful franchise strategies
How can we ensure that we are choosing the right areas?
How can we mitigate risk and decrease waste?
How can insights help us to grow our business?
Location intelligence trusted by 300+ industry leaders
Monitor ideal locations
Identify areas with high foot traffic, aligning with your target customer demographics and business model and pinpoint ideal franchise locations.
Identify market potential
Find market potential in trends on foot traffic, visit frequency, and economic indicators. Determine if the area has room for growth to avoid over-saturation, ensuring each franchise has the best chance of success.
Understand your selected stores
Leverage foot traffic, movement patterns, or visit durations of specific demographics to create a comprehensive understanding that covers the time period and locations of interest.
Pinpoint your audience
Understand the demographics, behaviours, and preferences of the visitors in the identified areas.
Drive informed decisions
Leverage foot traffic data and customer behaviours to validate the effectiveness of your new store strategy and make adjustments as needed.
3400
Stores
38
Countries
$12.5Bn
Annual sales
Huq’s catchment insights allows JD to more accurately assess the impact of the wider retail catchment on the sales potential of new store opportunities
Alastair Browne, JD Group Head of Site Research & Strategic Insight
Maximise operational efficiency
How can we drive better resource optimisation?
How can we increase returns?
How can we stay ahead of the market and competitors?
Location intelligence trusted by 300+ industry leaders
Estimate demand
Tap into new opportunities and estimate the demand for specific products or services in different areas with foot traffic patterns and customer behaviour insights.
Stay ahead of economic trends
Identify potential risk factors that could impact property performance or market demand by overlaying mobility data with relevant economic indicators such as GDP growth, unemployment rates, or consumer sentiment.
Optimise staffing and resourcing
Optimise staffing schedules to ensure adequate customer service during high-demand periods with catered foot traffic trends.
Maximise marketing impact
Create campaigns and projects that coincide with peak visit times for maximum reach and engagement.
Empower predictive modelling
Leverage predictive models on historical mobility data to forecast changes in foot traffic and customer behaviour for proactive risk management.
Huq’s mobility data helps us to make better investment decisions and allows us to appropriately manage risk on behalf of our investor clients.
Jonathan Bayfield, Head of UK Real Estate Research at Aviva Investors
Surface and mitigate risk
How can we prevent unplanned risk?
How can we create bulletproof strategies?
How can we accurately forecast sales?
Location intelligence trusted by 300+ industry leaders
Understand your risk profile
Understand the risk associated with a specific property or location with foot traffic trends, visit frequencies, and customer engagement to gauge the level of activity.
Stay ahead of economic trends
Identify potential risk factors that could impact property performance or market demand by overlaying mobility data with relevant economic indicators such as GDP growth, unemployment rates, or consumer sentiment.
Monitor location performances
Identify underperforming areas to implement corrective actions that mitigate risks associated with declining foot traffic.
Improve customer retention
Identify factors that impact customer retention and engagement, enabling the implementation of strategies to mitigate customer attrition risks and increase loyalty.
Empower predictive sales modelling
Leverage predictive models on historical mobility data to forecast changes in foot traffic and customer behaviour for proactive risk management.
$611Bn
Annual revenue
2.3m
Employees
10.5k
Locations
Observations are summarised as input signal for sales prediction models, frequently surpassing 0.7+ against sales results in correlation backtesting
Isambard Poulson, CTO, Huq Industries

Accurately identify emerging trends
How can we develop more adaptive strategies?
How can data help us gain a competitive advantage?
How can we be proactive with negative trends?
Location intelligence trusted by 300+ industry leaders
Foot traffic patterns
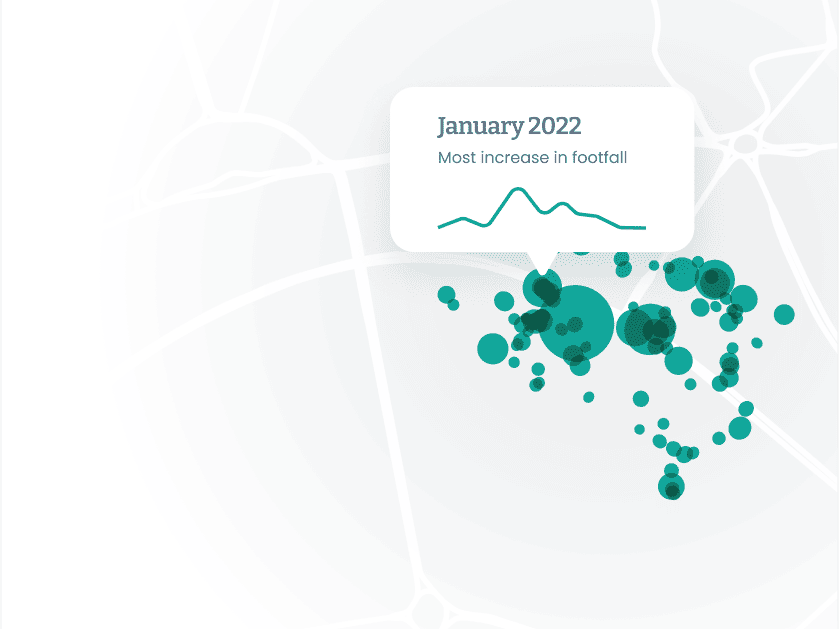
Identify recurring patterns such as peak visit times, seasonal trends, and changes in customer behaviour over time with historical location and movement data.
Seasonal trends
Capitalise on increased foot traffic with insights into trends related to seasons, holidays or local festivities.
New visitor trends
Leverage insights into projects and time periods of increase unique visits to attract and retain new visitors.
Preferred routes and areas
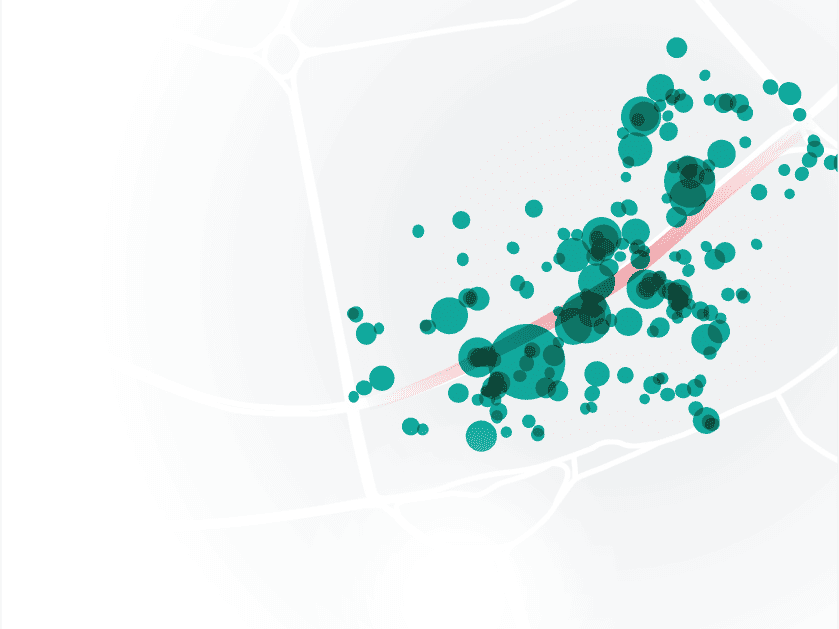
Uncover preferred routes and areas within a location with visibility over where visitors tend to congregate and dwell.
Comparative analysis
Identify consistent trends and variations across multiple locations to understand what drives success in certain areas and adapt your strategies.
985k
Population
23.8Bn
£GDP
187
Stations & hubs
Colleagues in local government now use outputs from Huq’s data for travel insights across the Glasgow City region. Uses include origin-destination analyses, and learning what draws people to local neighbourhoods
Dr Andrew McHugh, Senior Data Science Manager, UBDC / University of Glasgow
Understand visitor demographics
How can I make better investment decisions?
How can data help us optimise our properties?
What can we do to drive better tenant selection?
Location intelligence trusted by 300+ industry leaders
Understand your visitors
Create tailored real estate offering with in depth visitor profiles based on movement patterns and ideal demographics.
Pinpoint demographic preferences
Improve investment effectiveness and optimise property development strategies with insights into movement and demographic preferences.
Cater to residential preferences
Reveal insights into the preferred local amenities, transportation choices, and leisure activities of your residents.
Optimise commercial property
Ensure business mixes that cater to the preferences of local demographics with insights into the types of businesses or services that attract different demographic groups.
Data-driven investments
Leverage insights into the movement patterns of target demographics and their preferences for nearby amenities, influencing decisions about property types and amenities.
985k
Population
23.8Bn
£GDP
187
Stations & hubs
Colleagues in local government now use outputs from Huq’s data for travel insights across the Glasgow City region. Uses include origin-destination analyses, and learning what draws people to local neighbourhoods
Dr Andrew McHugh, Senior Data Science Manager, UBDC / University of Glasgow
Accurate tenant insights
How can data help us better understand our tenants?
How can we better align with customer preferences?
What can I do to enhance the success of property?
Location intelligence trusted by 300+ industry leaders
Understand your visitors
Identifying businesses that align with the footfall and visitor trends of your area with movement patterns, visit frequency, and dwell times of potential tenants.
Identify peak trends
Leverage insights into peak visit times and days to potential tenants' operating hours and services to optimise resource allocation.
Optimise tenant experience
Leverage insights into business patronage to strategically place offerings that curate a diverse and tenant experience and give feedback back to businesses.
Identify market gaps
Leverage location insights to surface gaps in the market and underrepresented businesses and unmet visitor, worker and customer needs.
985k
Population
23.8Bn
£GDP
187
Stations & hubs
Colleagues in local government now use outputs from Huq’s data for travel insights across the Glasgow City region. Uses include origin-destination analyses, and learning what draws people to local neighbourhoods
Dr Andrew McHugh, Senior Data Science Manager, UBDC / University of Glasgow
Optimising place performance
How can data help us produce desired place behaviours?
What steps can we take to improve customer experience?
How can we maximise revenue generation?
Location intelligence trusted by 300+ industry leaders
Optimise resource allocation
Optimise resources and inventory with insights from foot traffic patterns and peak visit times, ensuring excellent customer experiences while minimising excess stock.
Data-driven marketing campaigns
Leverage mobility insights to time and place marketing campaigns effectively, targeting customers during peak foot traffic hours to maximise campaign reach and impact.
Maximise placement planning
Drive success with strategic store placement that capture the right audiences with mobility insights.
Understand your audience
Identify your customers and their behavioural patterns and preferences for a more targeted and relevant marketing campaign.
$611Bn
Annual revenue
2.3m
Employees
10.5k
Locations
Observations are summarised as input signal for sales prediction models, frequently surpassing 0.7+ against sales results in correlation backtesting
Isambard Poulson, CTO, Huq Industries
Improving urban planning
What can we do to design spaces for the better?
What steps can we take to optimise our infrastructure?
How can data help us enhance quality of life for individuals?
Location intelligence trusted by 300+ industry leaders
Sustainable growth strategies
Tailor urban planning for sustainable, future-ready communities with insights on foot traffic, visit durations, and popular routes.
Efficient infrastructure
Optimise road networks, public transportation routes, and pedestrian pathways for smoother traffic flow with data-driven urban development.
Livability enhancement
Craft environments that promote well-being and satisfaction with data on space usage.
Resilient cities
Plan for adaptability in the face of evolving urban challenges such as leveraging insights on high-traffic areas to allocate resources efficiently, such as adding or upgrading public amenities and transportation hubs.
985k
Population
23.8Bn
£GDP
187
Stations & hubs
Colleagues in local government now use outputs from Huq’s data for travel insights across the Glasgow City region. Uses include origin-destination analyses, and learning what draws people to local neighbourhoods
Dr Andrew McHugh, Senior Data Science Manager, UBDC / University of Glasgow

