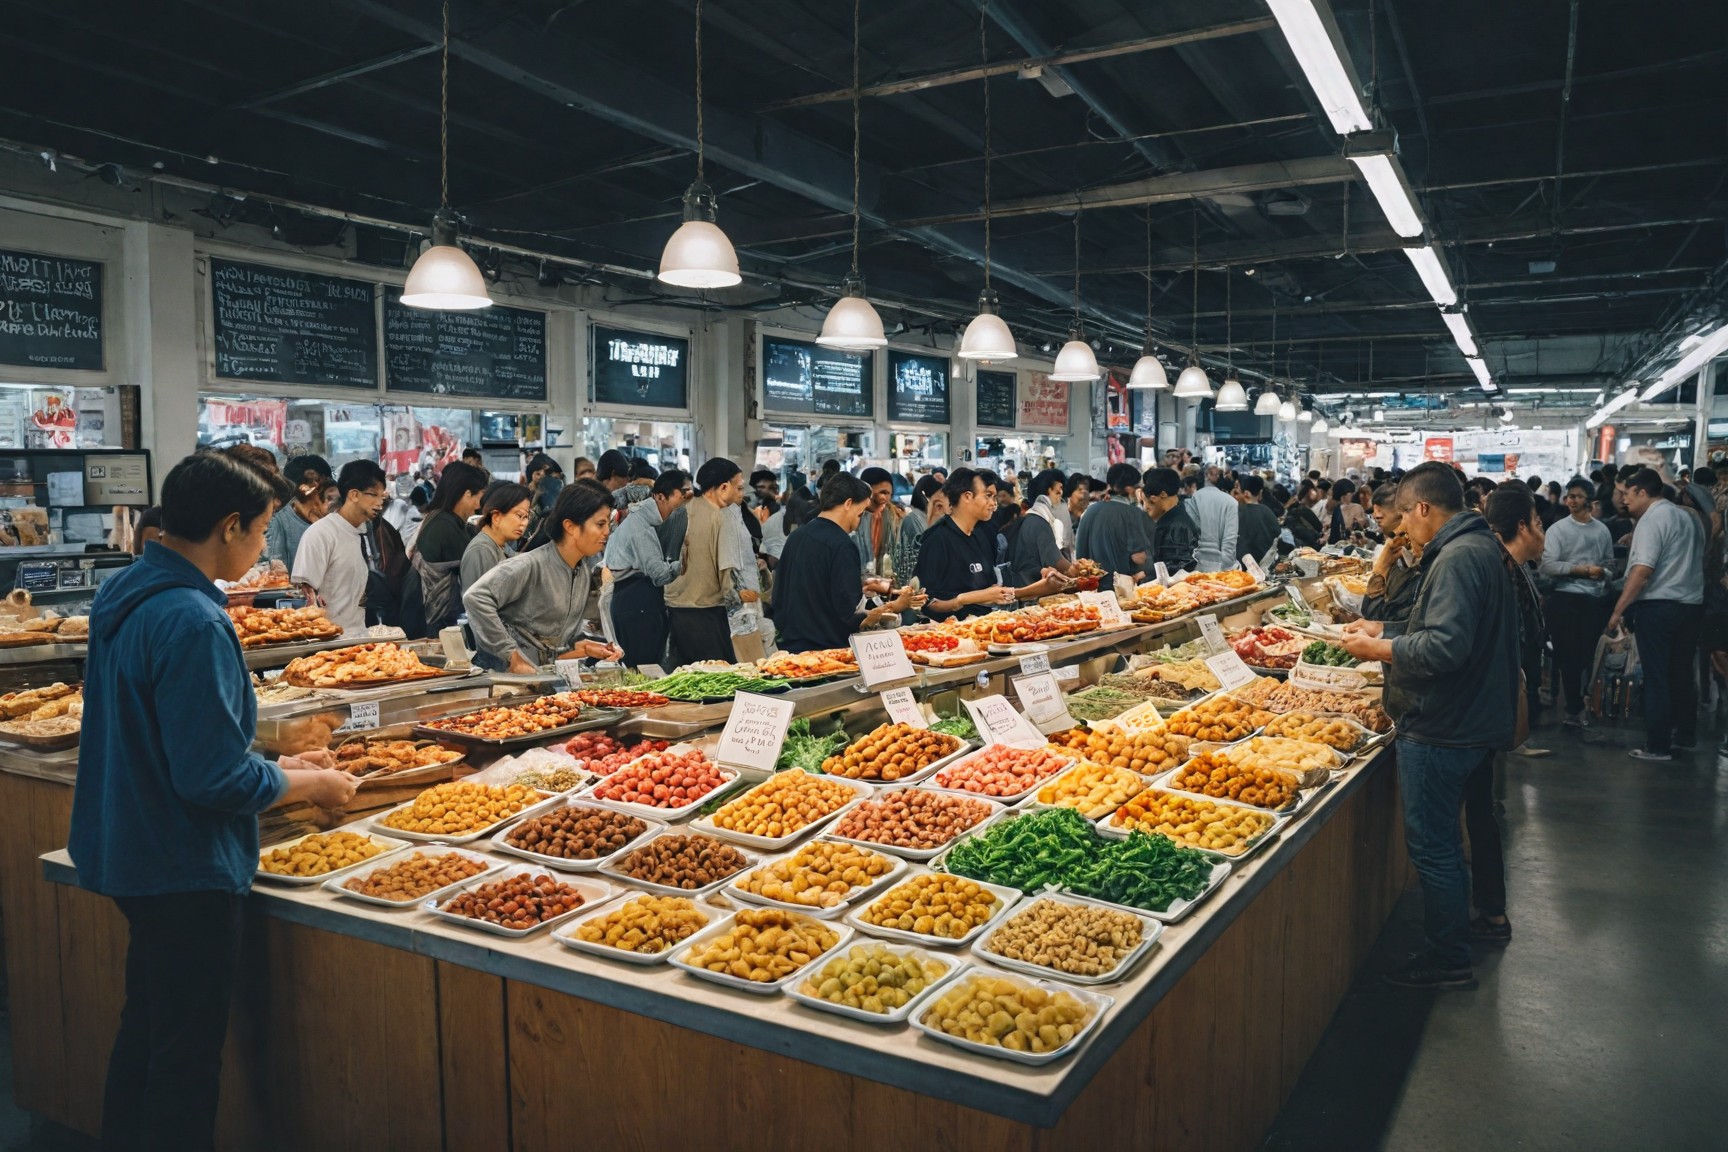
How This Cultural Market Leveraged Huq’s Insights for Expansion and Optimisation
Huq's mobility location data enabled JD Sports to refine customer catchment analysis, optimise store network performance and make…

Leveraging Location Intelligence for Strategic Expansion in Saudi Arabia
Huq's mobility location data enabled JD Sports to refine customer catchment analysis, optimise store network performance and make…

How A Sports Apparel Retailer Optimised its Europe and ME Strategy with Huq
Huq's mobility location data enabled JD Sports to refine customer catchment analysis, optimise store network performance and make…

How a Leading UK Hotel Group Used Huq to Optimise Site Selection
Huq's mobility location data enabled JD Sports to refine customer catchment analysis, optimise store network performance and make…

Challenger Coffee Brand Site Selection Case Study
Huq's mobility location data enabled JD Sports to refine customer catchment analysis, optimise store network performance and make…
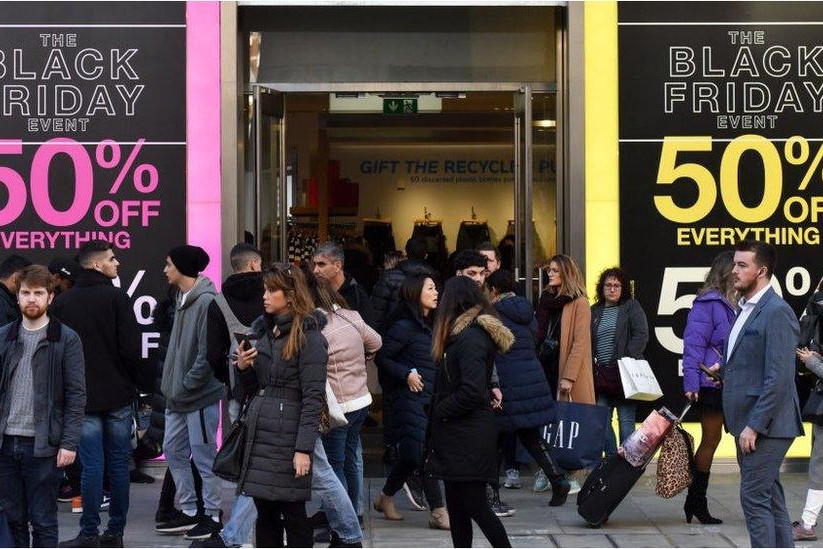
Was Black Friday 2024 a Success? Insights and footfall trends from Huq
Explore how Black Friday 2024 impacted UK retail centres with the latest footfall data, footfall statistics, and trends. Learn which…
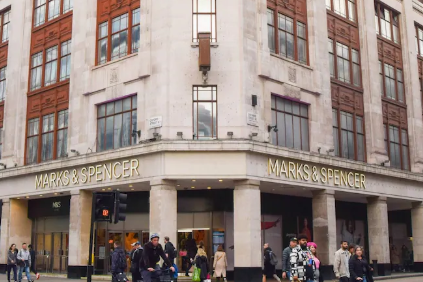
Revitalising Marble Arch: The Implications of M&S’s Redevelopment for Oxford Street and Beyond
Marks & Spencer has secured approval to redevelop its flagship Marble Arch store on Oxford Street, aiming to rejuvenate the area and…

JD Sports Case Study
Huq's mobility location data enabled JD Sports to refine customer catchment analysis, optimise store network performance and make…
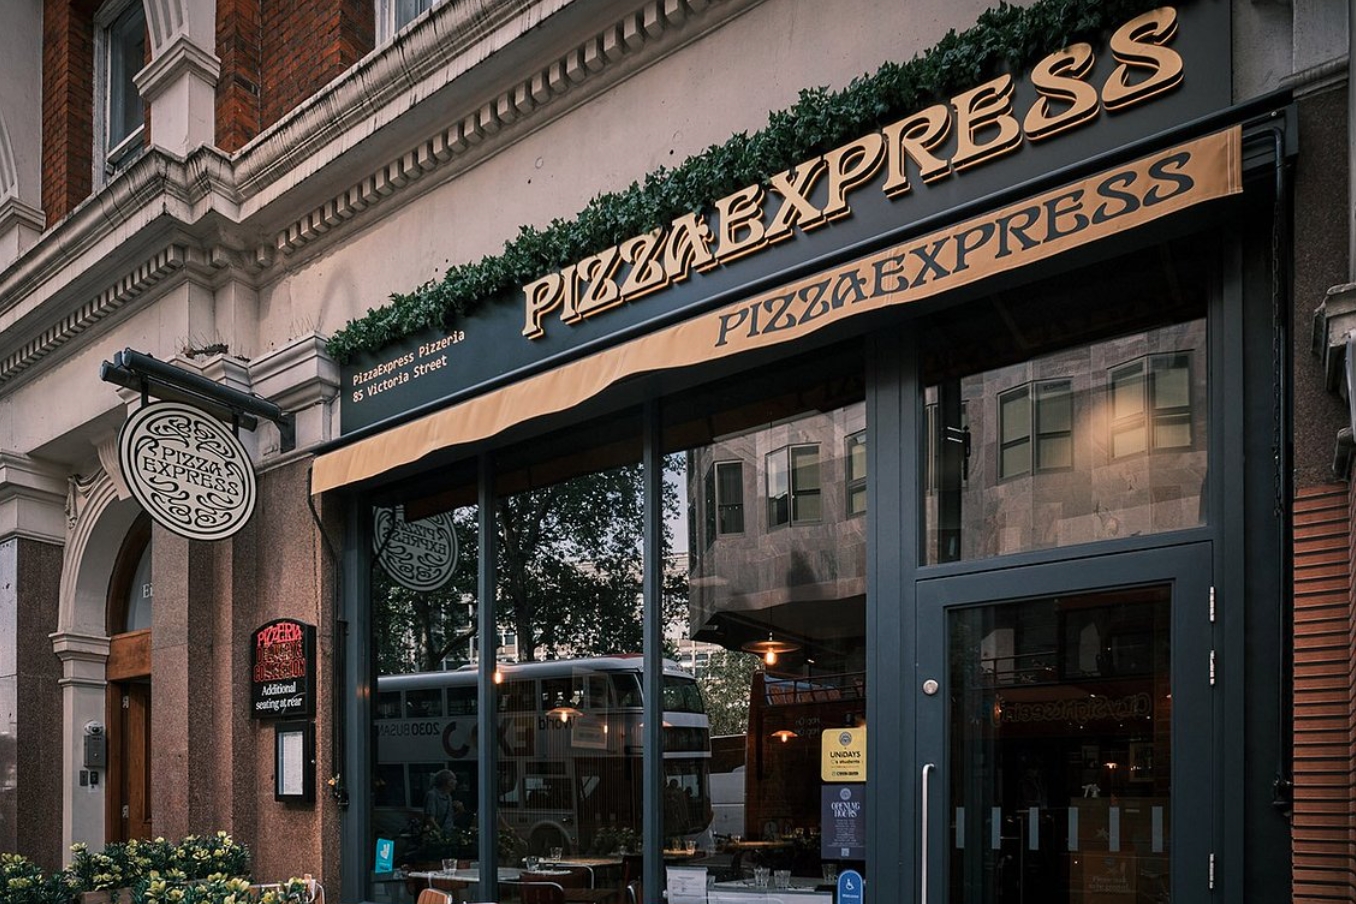
Pizza Express Case Study
Read how Huq’s footfall location insights empowered Pizza express to benchmark restaurant performance to the surrounding area and identify…

