
Successful new developments
How can our team optimise new developments?
How can data help us attract the right visitors?
How can we enhance our space's value proposition?
Location intelligence trusted by 300+ industry leaders


Optimise site selection
Determine the best locations for new developments based on customer behaviour patterns such as high foot traffic, frequent visits, and strong customer engagement.
Personalise placemaking
Leverage insights from successful areas to design placemaking strategies and amenities based on these insights to enhance the overall experience and drive foot traffic.
Pinpoint target demographics
Leverage mobility insights such as demographic and behaviours to create tailored designs and features of new developments to cater to the needs and preferences of the local population, enhancing the project's appeal.
Optimise tenant selection
Optimise the retail mix and ensure a diverse and attractive offering with insights into the best selection of retail tenants for mixed-use developments.
Simplify infrastructure design
Understand the flow of people in and around the new development to create easy accessibility and seamless movement.
3400
Stores
38
Countries
$12.5Bn
Annual sales
Huq’s catchment insights allows JD to more accurately assess the impact of the wider retail catchment on the sales potential of new store opportunities
Alastair Browne, JD Group Head of Site Research & Strategic Insight
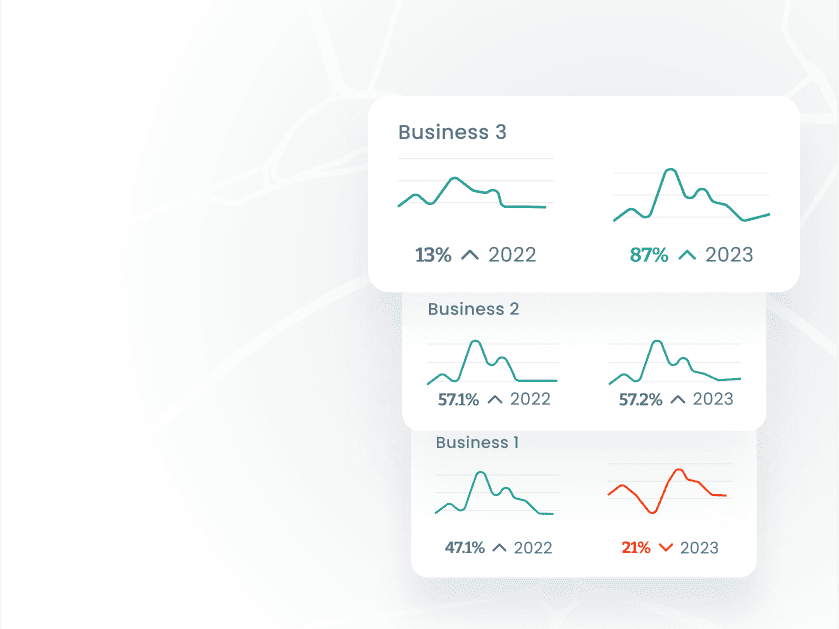
Understanding poor performance
How can I identify missed opportunities?
How do we target root causes of poor performance?
How can we address business challenges?
Location intelligence trusted by 300+ industry leaders
Understand your market
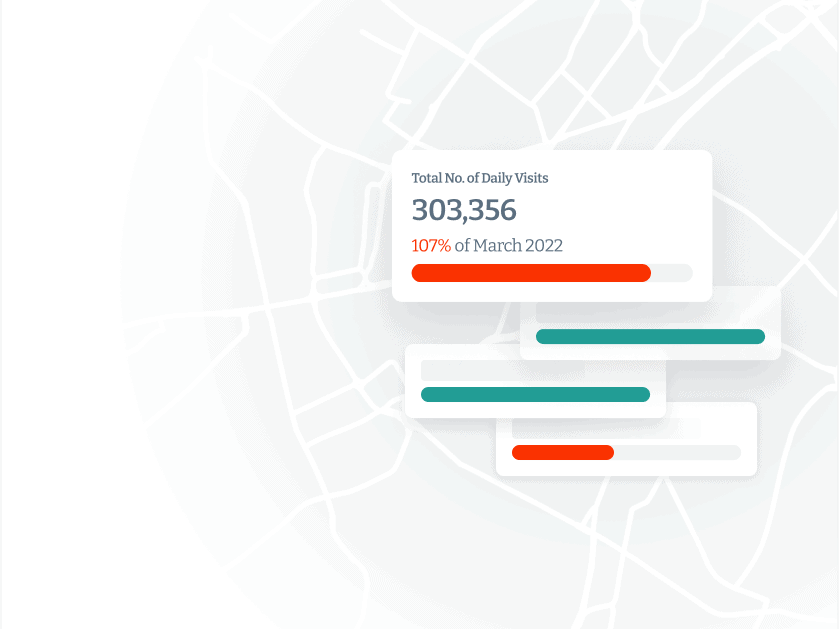
Use footfall, movement patterns, or visit durations to create a comprehensive dataset that covers the time period and locations of interest.
Identify metrics and benchmarks
Insights such as decreased foot traffic, longer dwell times in specific areas or fewer repeat visits can help you set benchmarks based on historical data or industry standards to provide context for your analysis.
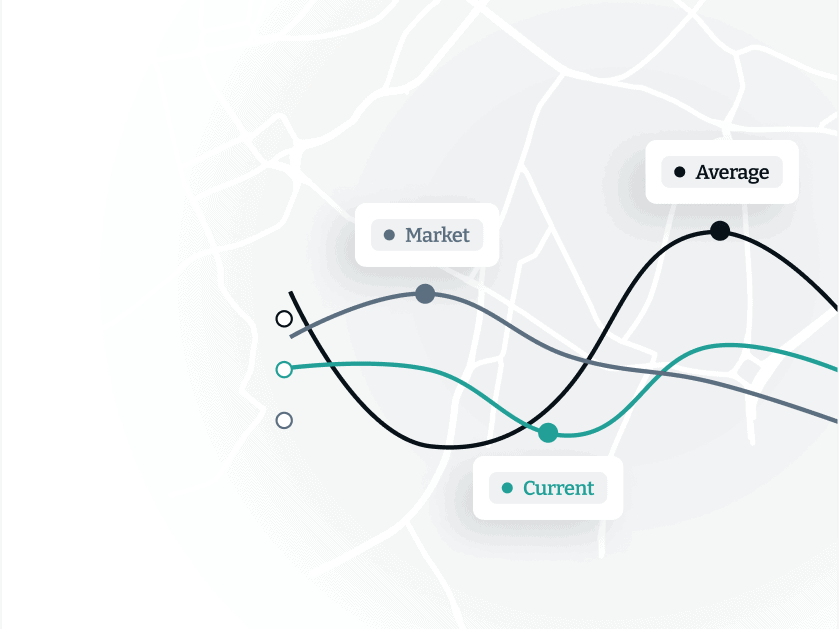
Demonstrate trends over time
Utilise temporal analysis to identify trends such as sudden drops or consistent declines in foot traffic or engagement. Compare the current time frame with previous periods to spot anomalies or negative deviations.
Spatial analysis and correlations
Determine if certain locations or regions are more affected than others and overlay your location data with other relevant datasets, such as local events, weather patterns, or economic indicators, to identify potential correlations that could explain poor store performance.
Segment performance in context
Segment your data based on different factors like customer demographics, time of day, or specific areas within your locations to identify whether negative performance is consistent across all segments or if certain groups are more impacted.
Huq’s mobility data helps us to make better investment decisions and allows us to appropriately manage risk on behalf of our investor clients.
Jonathan Bayfield, Head of UK Real Estate Research at Aviva Investors
Better investment decisions
How can I better understand market dynamics?
What can we do to minimise investment risks?
How can we capitalise on emerging opportunities?
Location intelligence trusted by 300+ industry leaders
Understand your market
Complete customer profiles, sales data, and property information by layering mobility data with your existing data.
Pinpoint areas to prioritise
Leverage foot traffic, visit frequency, and customer demographics to understand high-traffic areas, popular destinations, and emerging trends.
Monitor behaviour shifts
Identify changes in foot traffic patterns, peak visit times, and customer preferences to align your investments with evolving market dynamics.
Uncover investment risks
Mitigate risk while diversifying your investments across locations with insights into the stability of foot traffic, competition in the area, and economic indicators.
Drivie optimisation
Monitor the performance of your investments using foot traffic trends, customer engagement, and visit patterns.
3400
Stores
38
Countries
$12.5Bn
Annual sales
Huq’s catchment insights allows JD to more accurately assess the impact of the wider retail catchment on the sales potential of new store opportunities
Alastair Browne, JD Group Head of Site Research & Strategic Insight
223Bn
£GBP AUM
900+
Employees
12
Countries
Huq’s mobility data helps us to make better investment decisions and allows us to appropriately manage risk on behalf of our investor clients
Jonathan Bayfield, Head of UK Real Estate Research at Aviva Investors
Manage store contraction
What can I do do help minimise loss?
What can we do to minimise disruption?
How can we plan to optimise revenue retention?
Location intelligence trusted by 300+ industry leaders
Understand your market
Identify stores with low or declining metrics that show underperformance with segmented store locations that are based on their performance metrics, such as foot traffic trends, visit durations, and customer engagement.
Pinpoint customer trends
Uncover patterns and insights that contribute to a store's lack of success with a complete picture of the demographics, behaviours, and preferences of customers who frequent the underperforming stores.
Competition assessment
Evaluate the mobility data of your locations in comparison to your competitors' store locations to identify underperforming stores resulting from changes in local competition or other external factors.
Uncover market potential
Explore the market potential of the areas surrounding the underperforming stores for trends in foot traffic, population growth, and economic indicators to surface signs of recovery or potential for future success.
Optimise closure plan
Maximise cost saving and minimise loss and disruption with insights gained from the mobility data, create a phased closure plan.
3400
Stores
38
Countries
$12.5Bn
Annual sales
Huq’s catchment insights allows JD to more accurately assess the impact of the wider retail catchment on the sales potential of new store opportunities
Alastair Browne, JD Group Head of Site Research & Strategic Insight
Monitor your portfolio performance
How to use new data to create an edge?
What can I do to optimise my portfolio performance?
How can I foresee and mitigate risks?
Location intelligence trusted by 300+ industry leaders
Greater market understanding
Complete customer profiles, sales data, and property information by layering mobility data with your existing data.
Pinpoint areas to prioritise
Leverage foot traffic, visit frequency, and customer demographics to understand high-traffic areas, popular destinations, and emerging trends.
Comprehensive trend analysis
Understand market trends and dynamics such as shifts in customer behaviour, travel patterns, and demand patterns to align your investment decisions with evolving market conditions.
Minimise investment risks
Leverage historical mobility data to identify areas with consistent foot traffic and stable trends, mitigating the risk of investing in volatile or declining regions.
Optimise your investment portfolio
Track foot traffic, customer engagement, and visit patterns to assess the impact of your investments and decisions and adapt your strategies based on emerging trends.
223Bn
£GBP AUM
900+
Employees
12
Countries
Huq’s mobility data helps us to make better investment decisions and allows us to appropriately manage risk on behalf of our investor clients
Huq’s mobility data helps us to make better investment decisions and allows us to appropriately manage risk on behalf of our investor clients
Jonathan Bayfield, Head of UK Real Estate Research at Aviva Investors
Optimise marketing placements
How can I develop more effective marketing campaigns?
What can we do to increase customer engagement?
How can I improve ROI on physical marketing campaigns?
Location intelligence trusted by 300+ industry leaders

Understand your market
Understand granular and accurate information about user movement and behaviour.
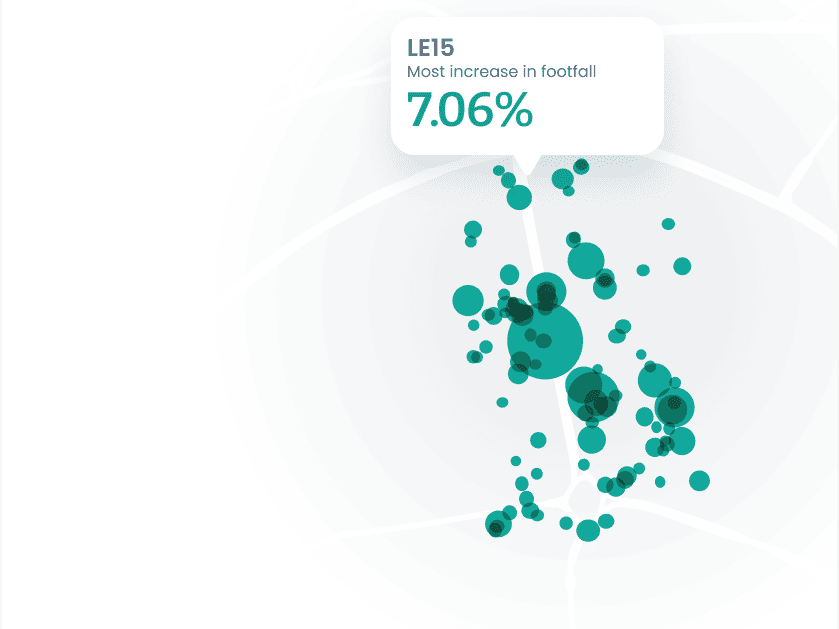
Identify visitor hotspots
Identify key locations, popular venues, and high-traffic areas where your target audience frequently visit - including shopping centres, high streets or recreational spaces.
Enrich your customer profiles
Create and monitor segments for your target audience based on demographics, behaviours, and preferences to tailor your marketing efforts to specific groups.
Build location tailored campaigns
Leverage catchment insights to design location-specific marketing campaigns. Create targeted campaigns and offers that resonate with the interests and needs of people frequenting certain area.
Optimise marketing with targated campaigns
Adjust your marketing placements and strategies based on dynamic changes in user behaviour, seasonality, or emerging trends to ensure optimal engagement and impact.
Huq’s mobility data helps us to make better investment decisions and allows us to appropriately manage risk on behalf of our investor clients.
Jonathan Bayfield, Head of UK Real Estate Research at Aviva Investors
Understand travel behaviour
How can we enhance transportation infrastructure?
What are good ways to optimise urban planning?
How can we create optimised and targeted strategies?
Location intelligence trusted by 300+ industry leaders

Understand your local market
Access a comprehensive dataset that covers travel patterns across different modes of transportation to and from your destinations.
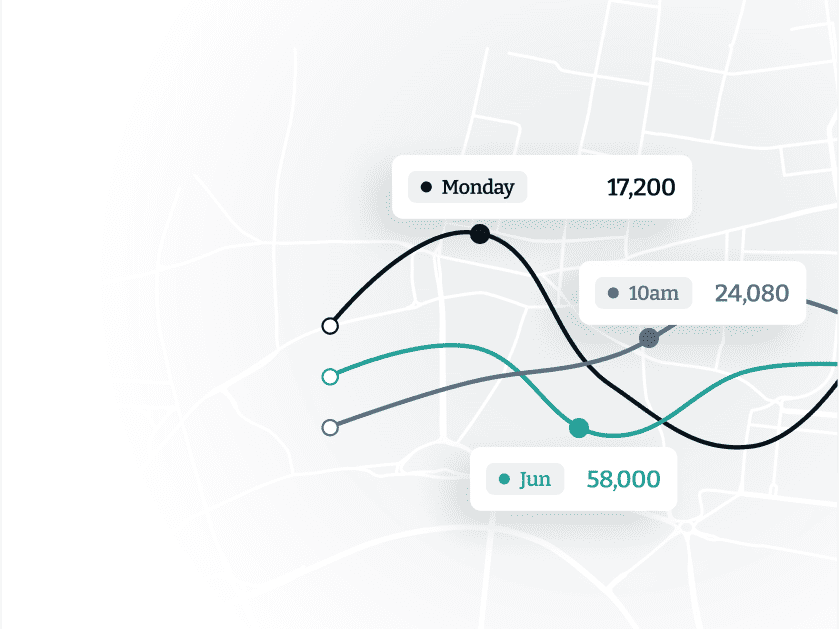
Monitor routes and movements
Find patterns in popular destinations, peak travel times, and recurring travel routes to gain insights into typical travel behaviours with common travel routes, modes of transportation used, and frequency of travel.
Explore origins and destinations
Study origin-destination pairs to understand where people begin their journeys and where they end up to identify commuting patterns, popular travel corridors, and the interconnectivity of different regions.
Identify core customer behaviours
Uncover unique travel behaviours and preferences for different traveler profiles, such as commuters, tourists, or business traveler, enabling you to tailor services and offerings more effectively.
Contextualise your performance
Overlay mobility insights with other relevant contextual factors such as weather conditions or economic indicators to unveil correlations between travel behaviour and external influences, helping you understand how different factors impact travel choices.
985k
Population
23.8Bn
£GDP
187
Stations & hubs
Colleagues in local government now use outputs from Huq’s data for travel insights across the Glasgow City region. Uses include origin-destination analyses, and learning what draws people to local neighbourhoods
Dr Andrew McHugh, Senior Data Science Manager, UBDC / University of Glasgow
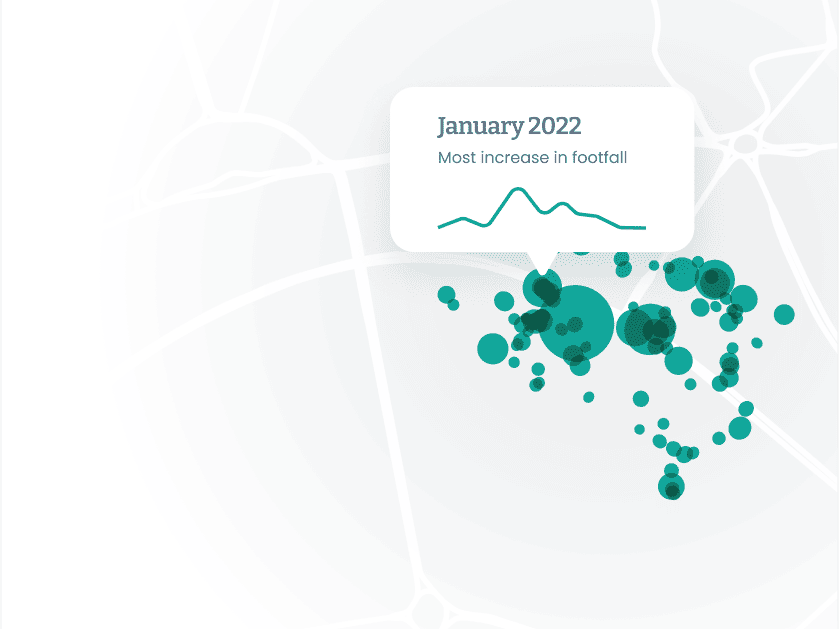
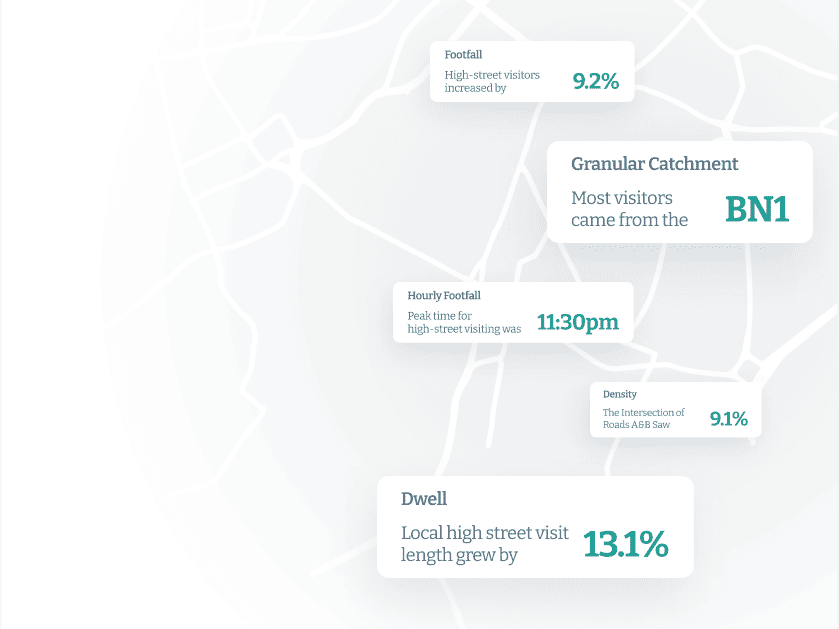
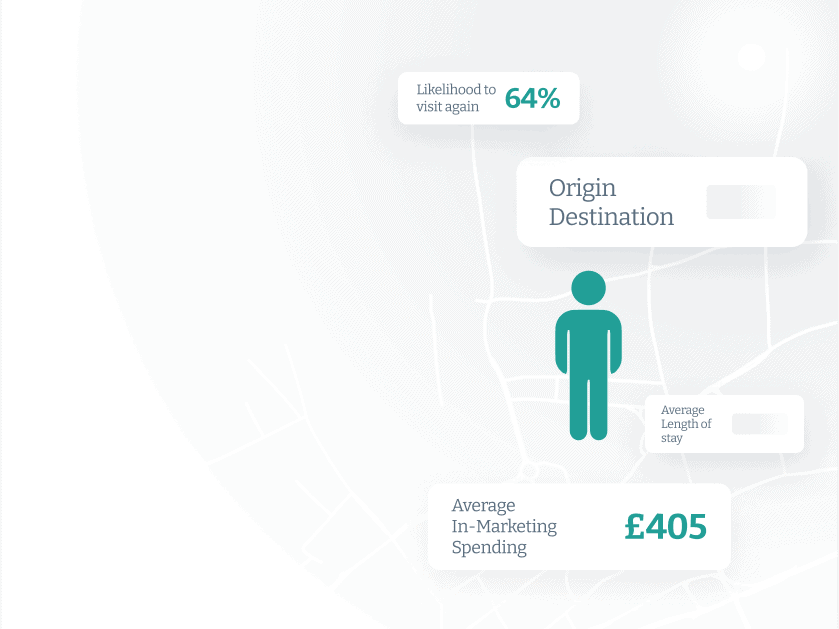
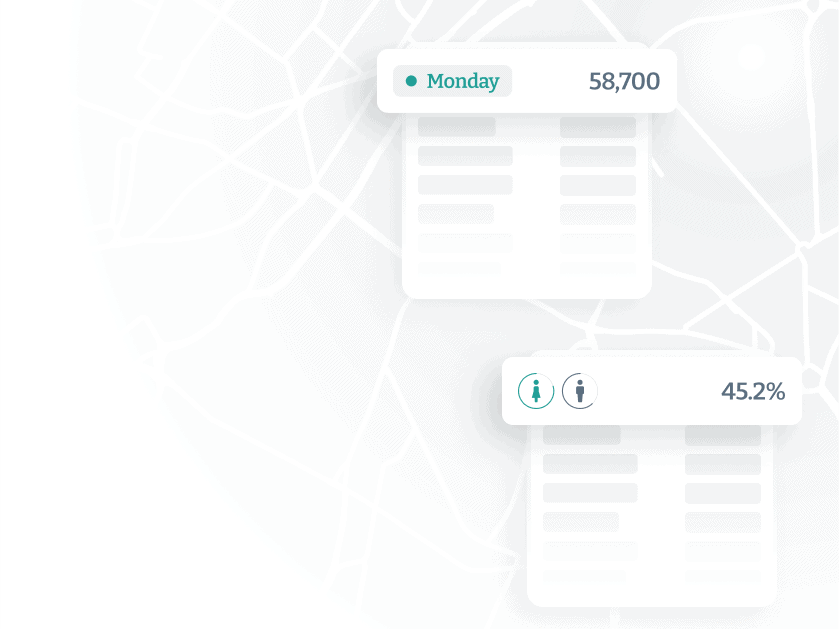
Visitor insights
How best to enhance customer experiences?
How can we ensure a place is worth investing in?
How do I drive growth with informed decisions?
Location intelligence trusted by 300+ industry leaders
Understand any market In minutes
Leverage foot traffic, movement patterns, or visit durations to create a comprehensive dataset that covers the time period and locations of interest.
Uncover core customer profiles
Segment demographics, location, visit frequency, and dwell time to create profiles that paint a picture of visitor groups, including their preferences, behaviours, and characteristics.
Surface existing visitor trends
Analyse visitor patterns for trends in terms of peak visit times, preferred locations, and typical routes. This analysis will provide insights into the types of visitors your locations attract and their behaviours.
Find new trends and unique insights
Develop detailed visitor personas based on their characteristics and behaviours to tailor marketing strategies, offerings, and experiences to cater to specific visitor segments.
3400
Stores
38
Countries
$12.5Bn
Annual sales
Huq’s catchment insights allows JD to more accurately assess the impact of the wider retail catchment on the sales potential of new store opportunities
Alastair Browne, JD Group Head of Site Research & Strategic Insight

4.8Bn
GBP Influence
3
Gov Departments
8
Uni partners
Huq’s data is real-time and that makes 3DI’s data even stronger and more valuable. Both local and central government bodies will be able to use it to get a clearer picture of the real economic impacts of Covid-19 across the country
Benjamin Lucas (PhD, FHEA), Managing Director at 3DI

