Evidence-based governance
Drive sustainable growth, informed decision-making, thriving communities, and measurable success.
Location intelligence that is trusted by 90+ local authorities and BIDs


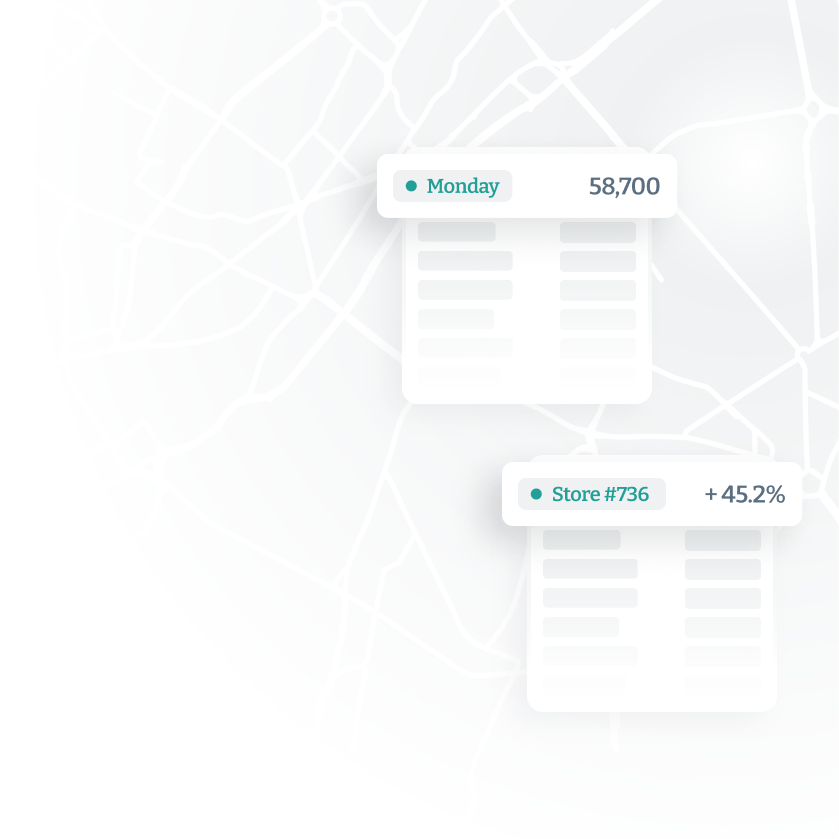
Understand the performance of your location


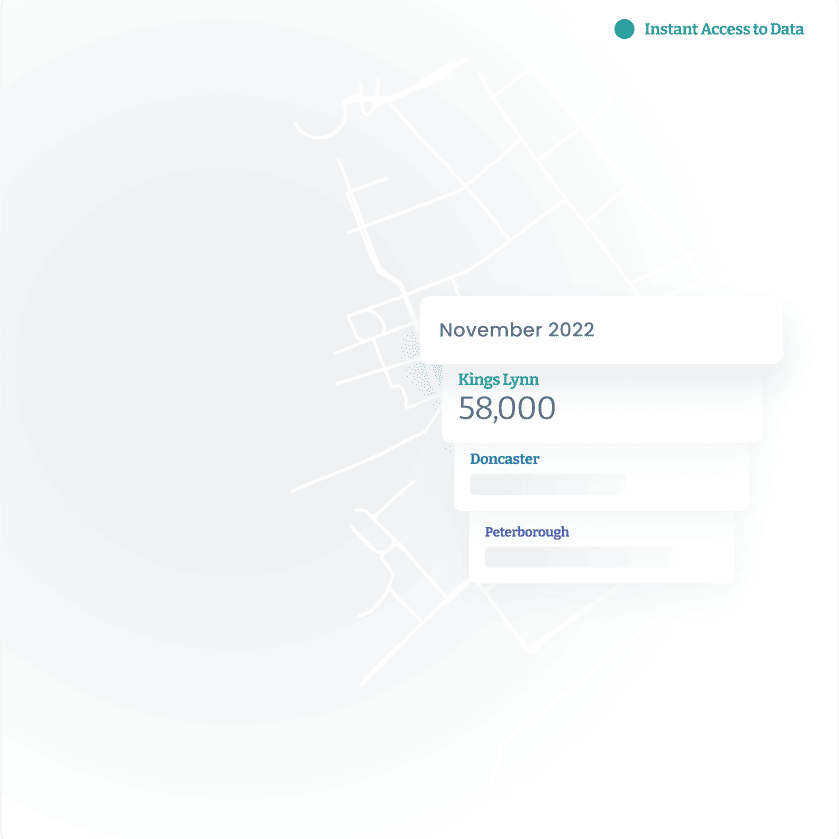
Instant access to location data for governments
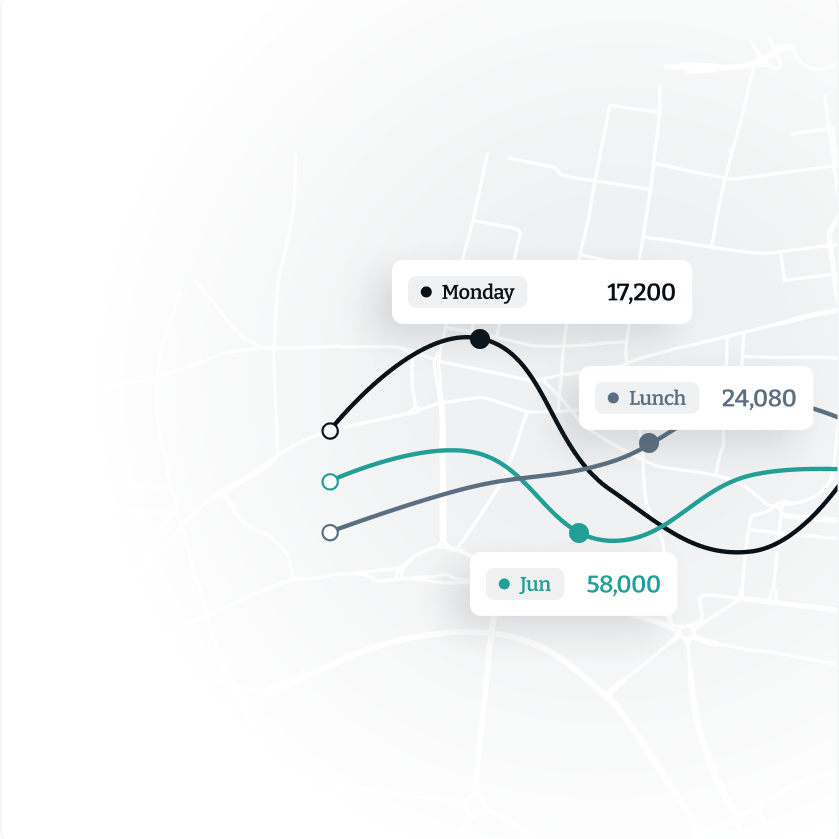
Uncover peaks and troughs in daily, weekly, monthly and hourly footfall across sites and regions to craft evidence-based policies that promote prosperous, sustainable, and vibrant environments for residents, workers and visitors.
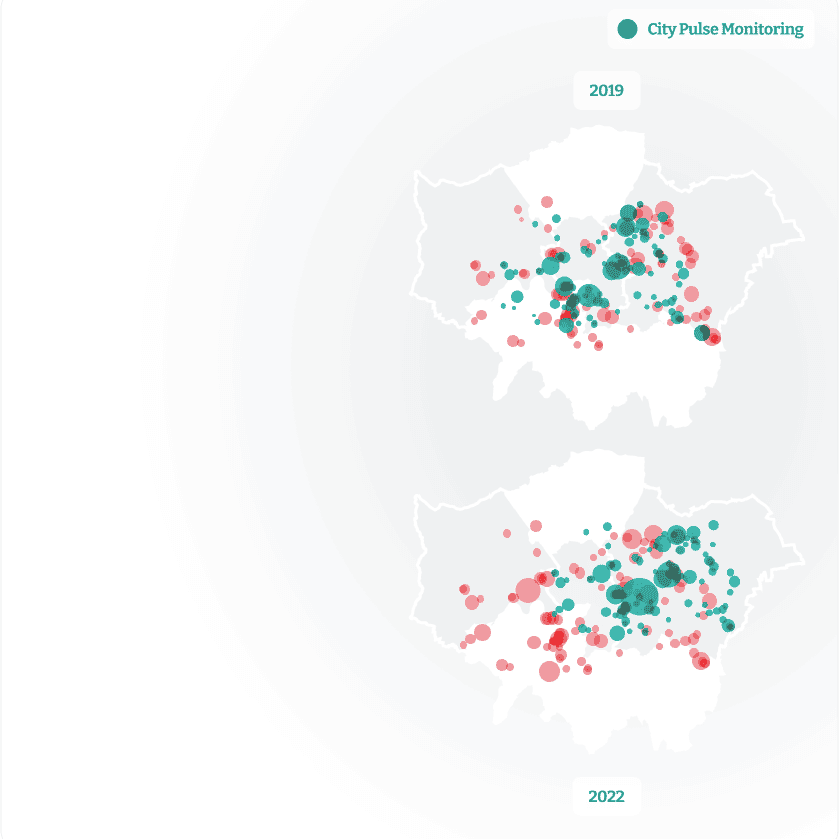
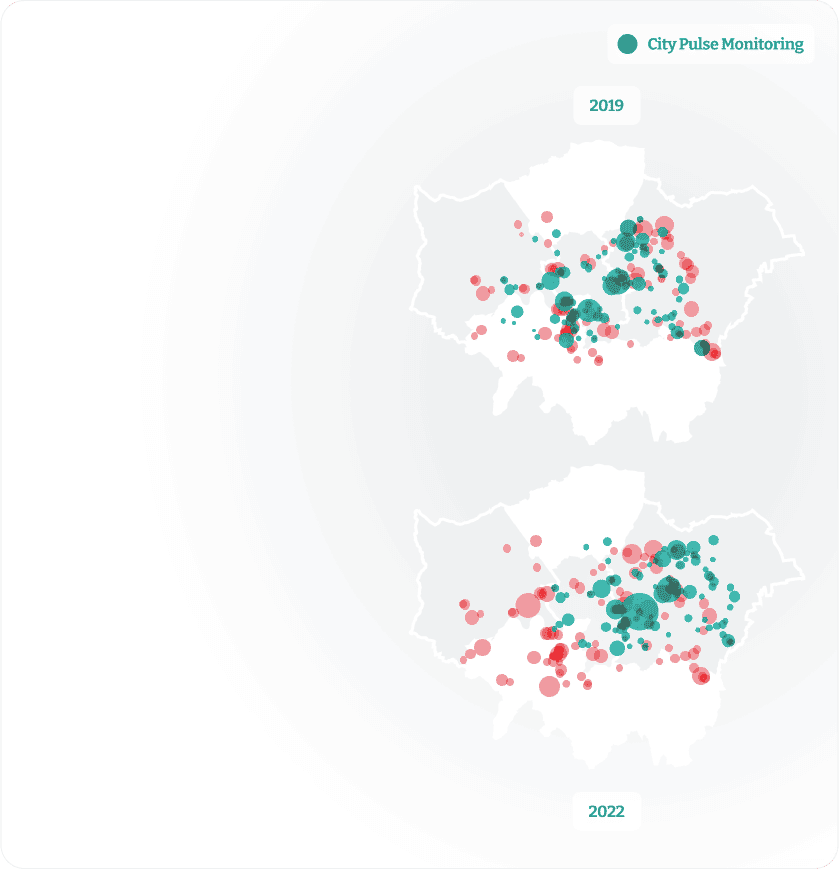
City pulse monitoring
Gain live visibility into the ebb and flow of pedestrian traffic to make informed decisions on urban planning and resource allocation.
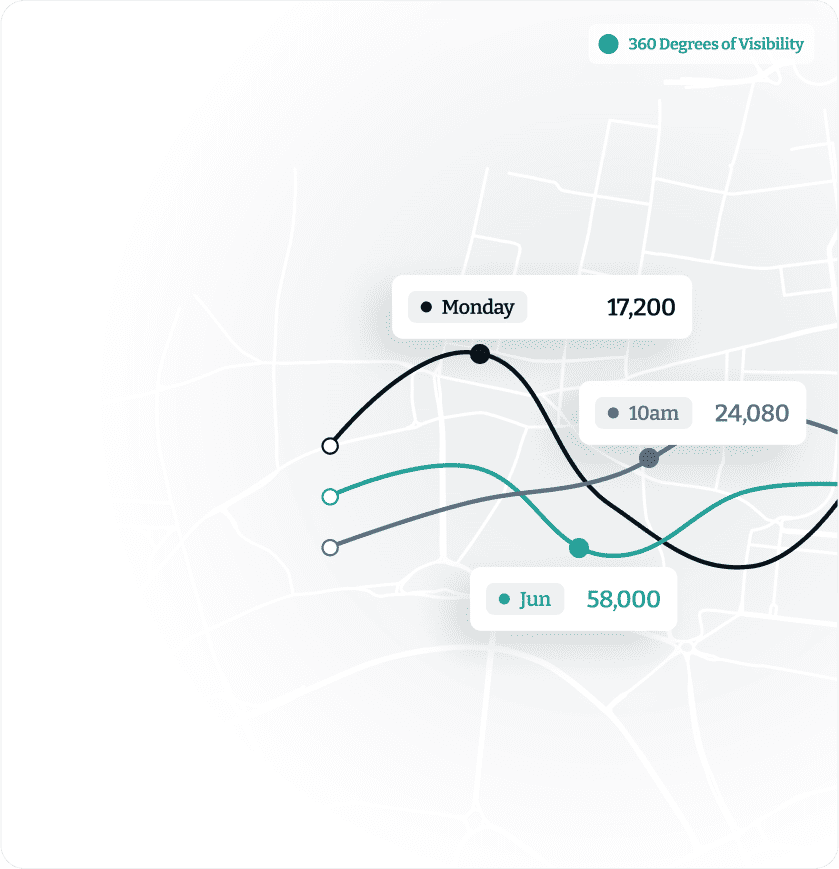
360 degrees of visibility
Measure the average time individuals spend in specific areas. Leverage valuable insights into hotspots, public space utilisation, and temporal trends to identify potential areas for improvement.
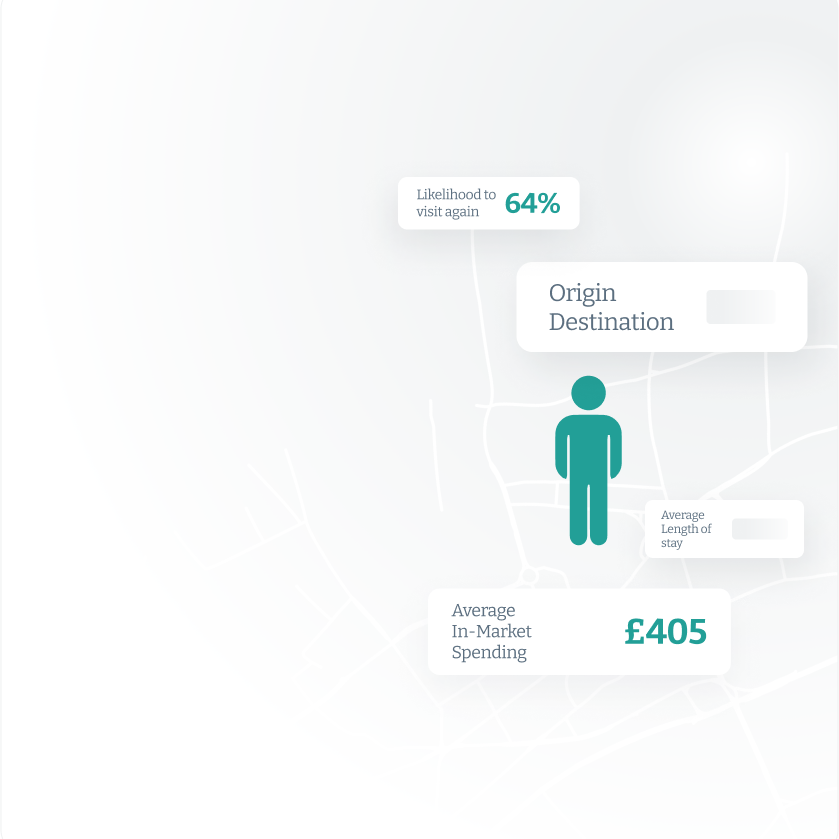
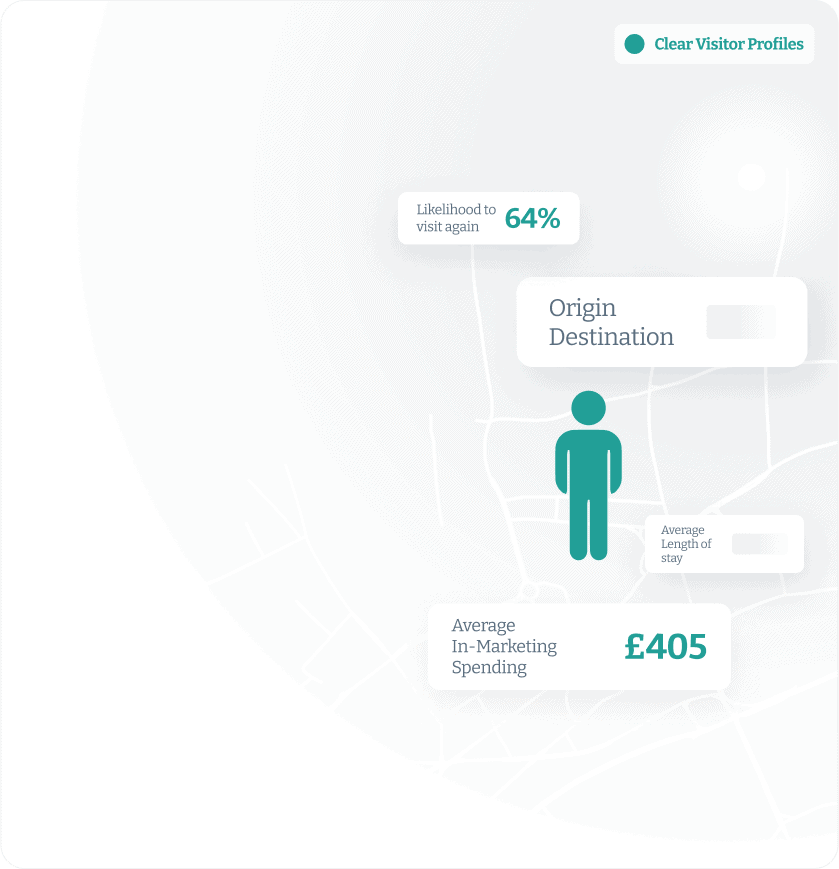
Clear visitor profiles
Pinpoint visitors based on behaviour and demographics for targeted marketing campaigns, and improved visitor experiences.
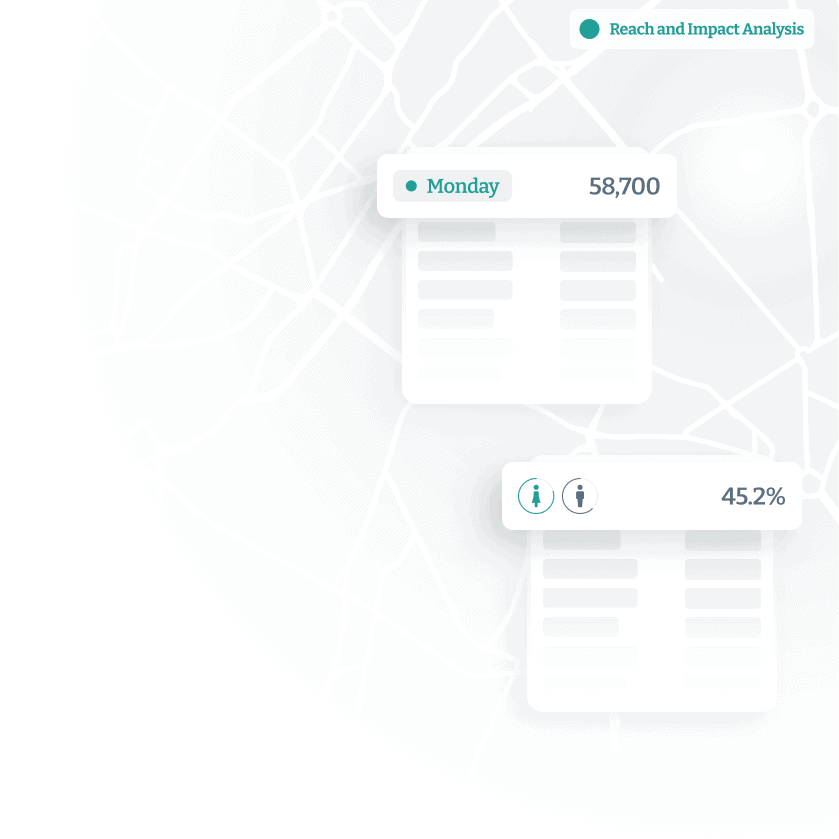
Reach and impact analysis
Make informed decisions on resource allocation, marketing strategies, and accessibility enhancements with a live map of the geographic reach of your location informing decisions. Validate your progress with competitive and time-based benchmarks.
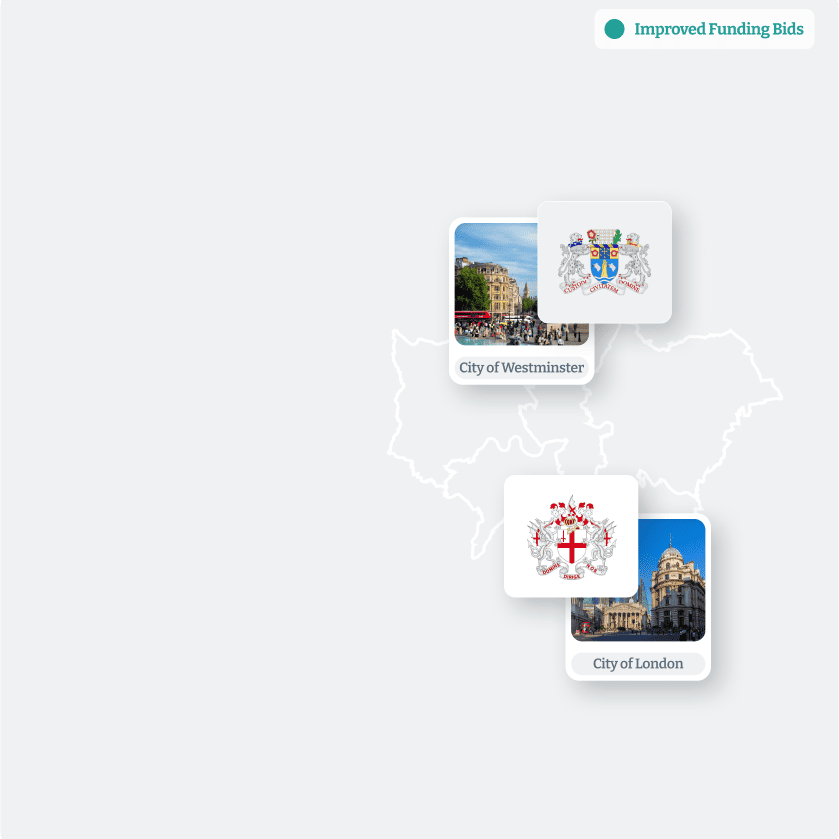
Improved funding bids
Maximise funding impact and validation. Leverage location data built for governments that are designed to create compelling evidence for more funding.
Uncover peaks and troughs in daily, weekly, monthly and hourly footfall across sites and regions to craft evidence-based policies that promote prosperous, sustainable, and vibrant environments for residents, workers and visitors.
Gain live visibility into the ebb and flow of pedestrian traffic to make informed decisions on urban planning and resource allocation.
Measure the average time individuals spend in specific areas. Leverage valuable insights into hotspots, public space utilisation, and temporal trends to identify potential areas for improvement.
Pinpoint visitors based on behaviour and demographics for tailored events, targeted marketing campaigns, and improved visitor experiences.
Make informed decisions on resource allocation, marketing strategies, and accessibility enhancements with a live map of the geographic reach of your location informing decisions. Validate your progress with competitive and time-based benchmarks.
Maximise funding impact and validation. Leverage location data built for governments. that are designed to create compelling evidence for more funding.