The Welcome Back Fund (WBF) provided UK council funding to help encourage visitors back to high streets and town centres in the wake of the Covid-19 pandemic. In this report we ask – how successful was it?
Introduction
Huq helps 50+ UK councils understand how people use their towns, high-streets and spaces. Its measurement platform offers insights into key performance indicators including:
- How busy places are
- Where visitors come from
- How long they stay for
- How often they come back
Using quality, first party observations and big data practices, these detailed and verified insights are available immediately, UK-wide. No hardware and no surveys required!
The Welcome Back Fund (WBF)
The Welcome Back Fund (WBF) was announced in March 2021 as an extension to the Reopening High Streets Safely Fund (RHSSF). These funds enabled councils to invest in post-Covid recovery and to stimulate economic prosperity, especially through retail and leisure. The implementation period – the period over which councils are required to dispose of WBF funding – ran up until March 31st 2022.
In this report we look back at councils’ performance levels at the time of the Fund’s announcement and compare them to where they ended up in the three months to March 31s. The results are used to rank the best performing councils during the WBF campaign period across four key metrics: footfall, catchment, dwell-time and visit frequency.
Footfall performance
Why is Footfall important? Footfall is the primary metric used by councils, BIDs, retailers and real-estate to measure how many unique visitors are present in the places they manage. One UK council Economic Development Officer even went so far as to say that footfall monitoring is the single most important insight they use to manage places.
How Huq does it: On Huq’s platform, footfall is a count of the actual number of unique people per day present within a measurement area. Each visitor is counted only once each day regardless of where they might have gone within the area, or how many times they visited. Elements of the observation base are filtered out to meet a stricter definition of footfall. For example, static residents do not contribute to the footfall of an area.
Footfall increase during WBF
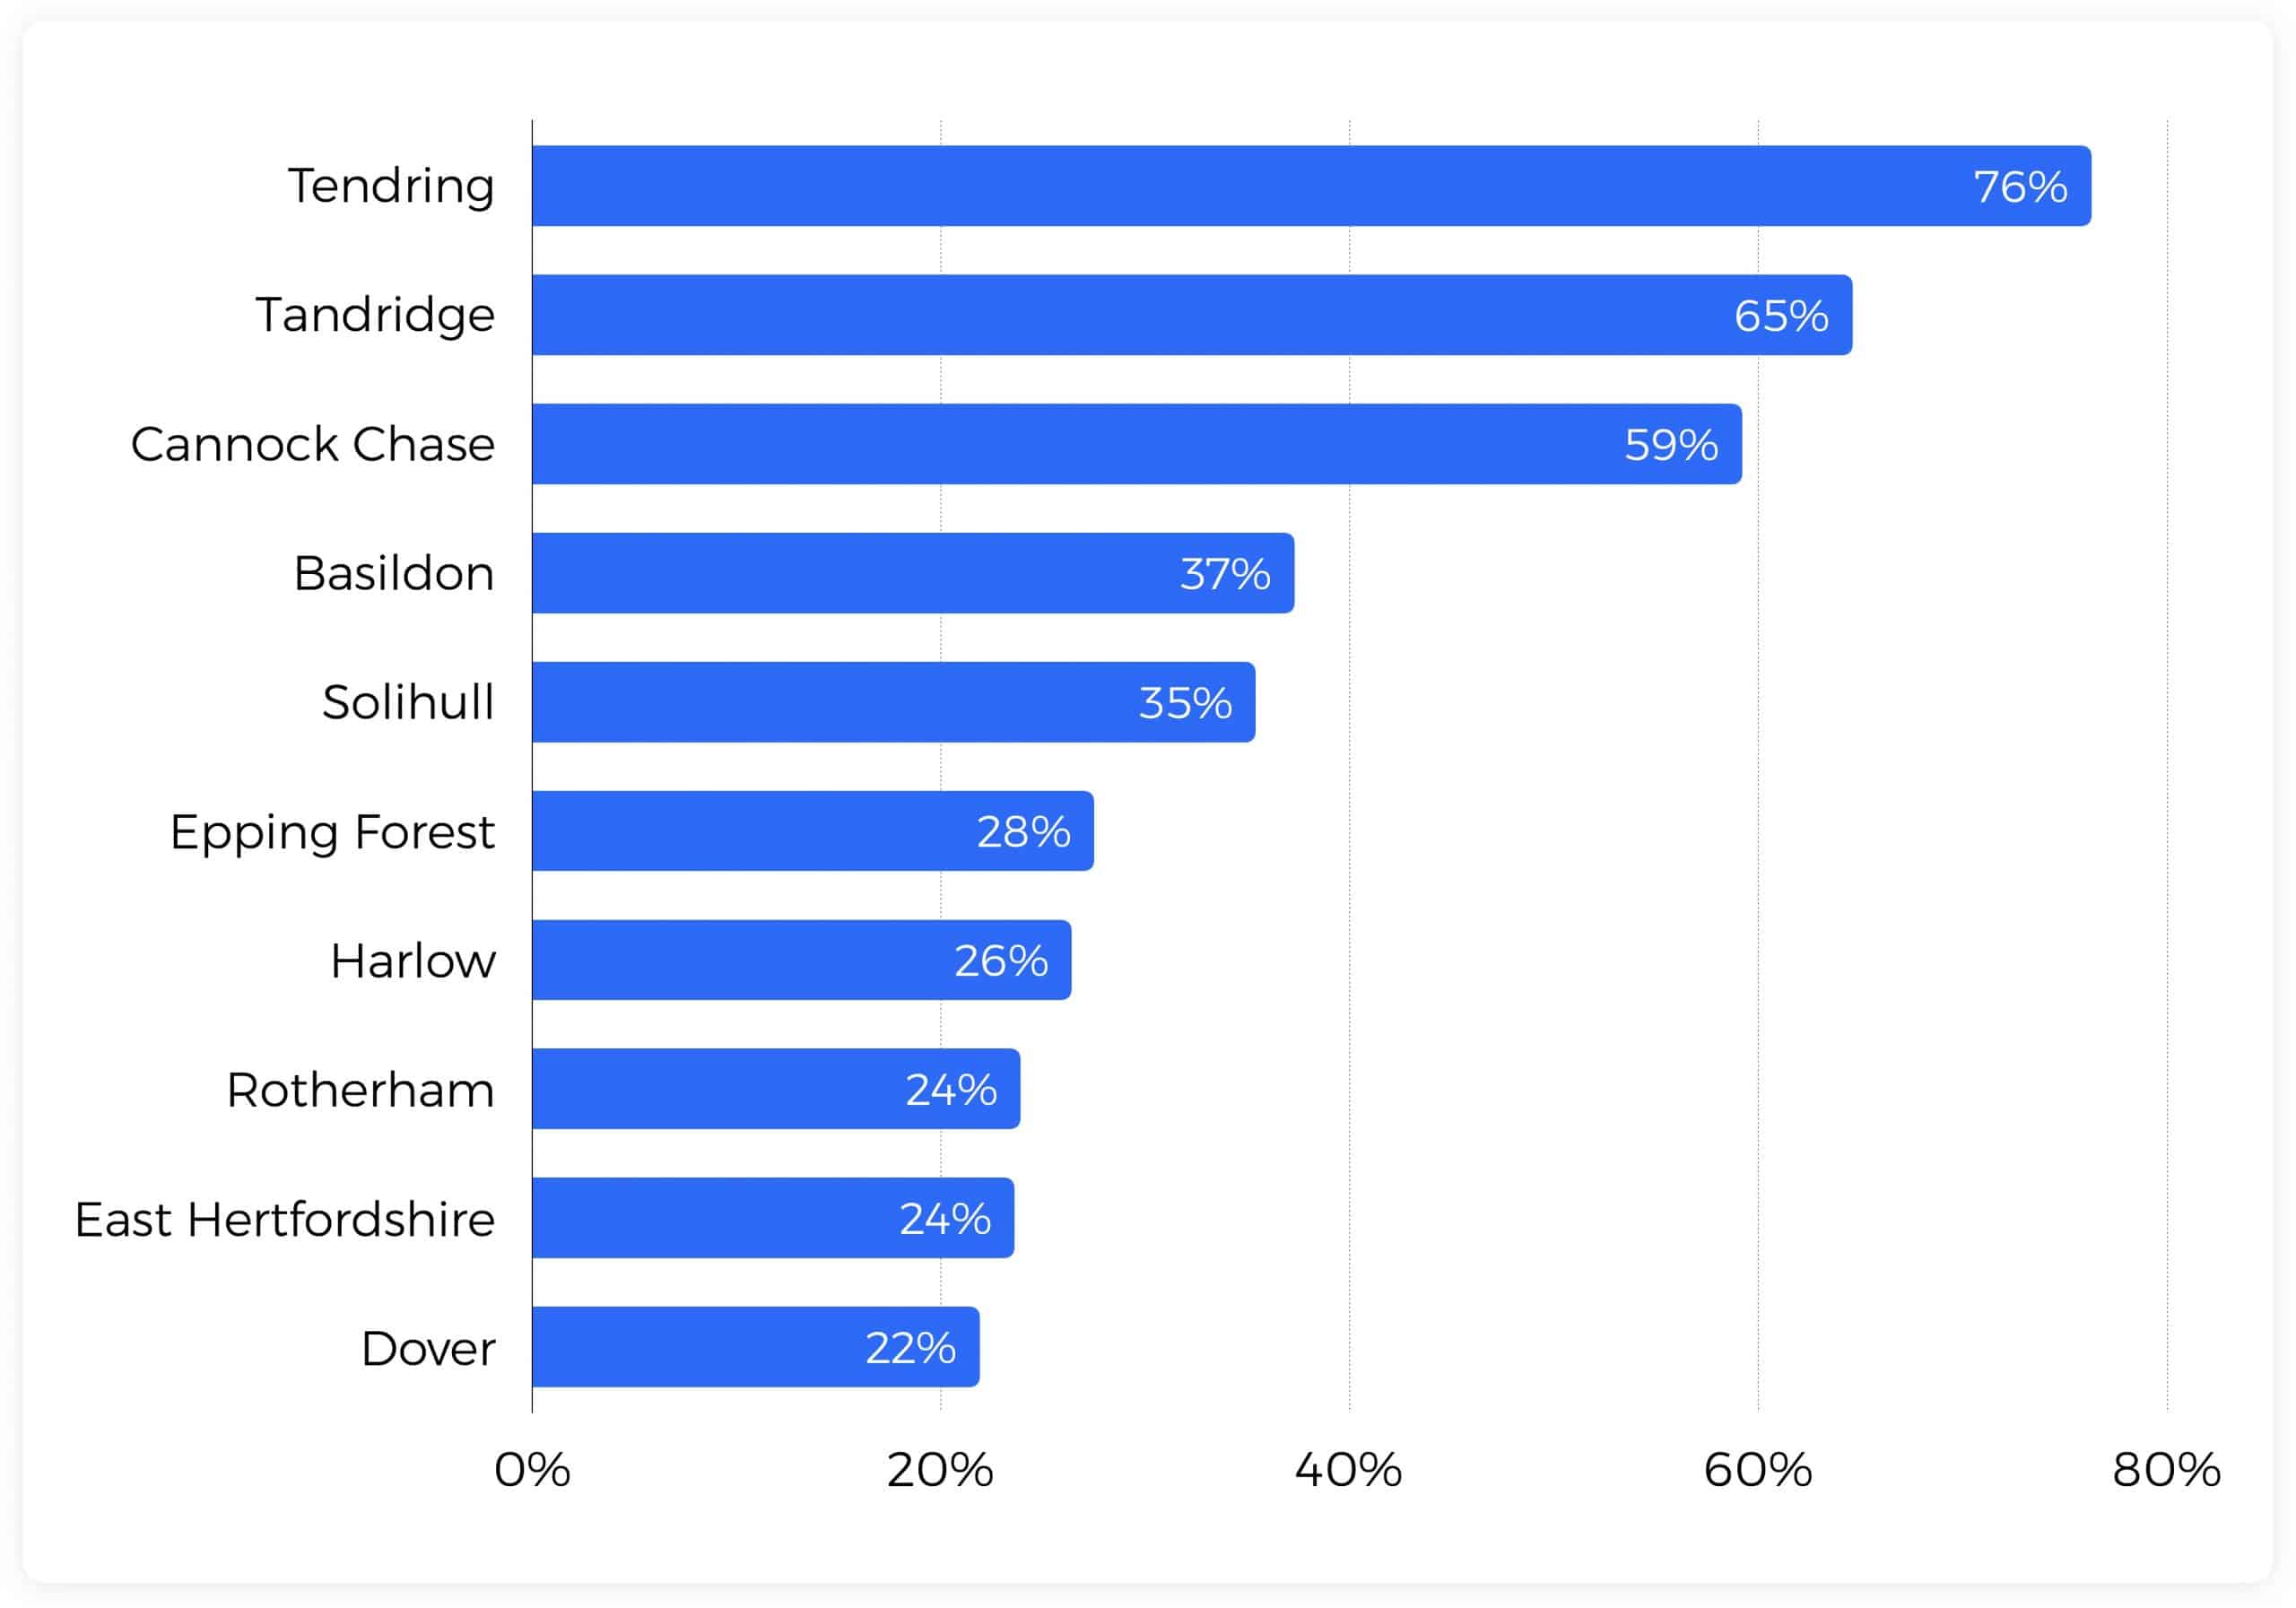
Tendring Council, located in Essex at the mouth of the river Thames, takes gold for seeing the greatest increase – 76% – in footfall over the Welcome Back Fund implementation period. That impressive performance is closely followed by Tandridge in Kent with 65% and Cannock Chase, close to Birmingham in the Midlands, at 59%.
Across the top 10 winners, seven are located in the South East of England, two in the Midlands and one in the East of England. Across all councils sampled Huq found there to be a 7% increase in footfall during the WBF implementation period, with those in the top 10 tracking collectively at 40%.
Dwell-time performance
Why is Dwell-time important? High dwell-time is indicative of strong place performance and is shown to reflect the value of visits made by people to places. Longer visits to high-streets or even stores translates into greater local spending. And this value isn’t only economic. Visitor satisfaction and enjoyment of places can also be measured by this robust and verified means.
How Huq does it: Visit duration is observed for each unique visitor and then averaged over the population, with the result expressed in minutes. Huq’s collection methodology allows for accurate dwell-time measurement for an area. Its unique ID and high frequency of observations enables its platform to accurately measure how long visitors spend there.
Dwell increase during WBF
Tendring Council, located in Essex at the mouth of the river Thames, takes gold for seeing the greatest increase – 76% – in footfall over the Welcome Back Fund implementation period. That impressive performance is closely followed by Tandridge in Kent with 65% and Cannock Chase, close to Birmingham in the Midlands, at 59%.
Across the top 10 winners, seven are located in the South East of England, two in the Midlands and one in the East of England. Across all councils sampled Huq found there to be a 7% increase in footfall during the WBF implementation period, with those in the top 10 tracking collectively at 40%.
Catchment area performance
Why is Catchment important? Catchment areas represent the dominant locations that visitors to towns, places and centres travel from. Use Catchment Areas to estimate the total addressable market local services based on catchment population. Catchments also provides the link to demographics and the means to characterise visitor populations by income or other attributes.
How Huq does it: Catchment maps use Huq’s classification of visitors’ approximate residential neighbourhoods, and uses that as a reference point to determine the average catchments for places. The same classification allows Huq to cross-reference visitors with authoritative demographic datasets such as the Census in order to inherit their estimated income values.
Catchment area increase during WBF
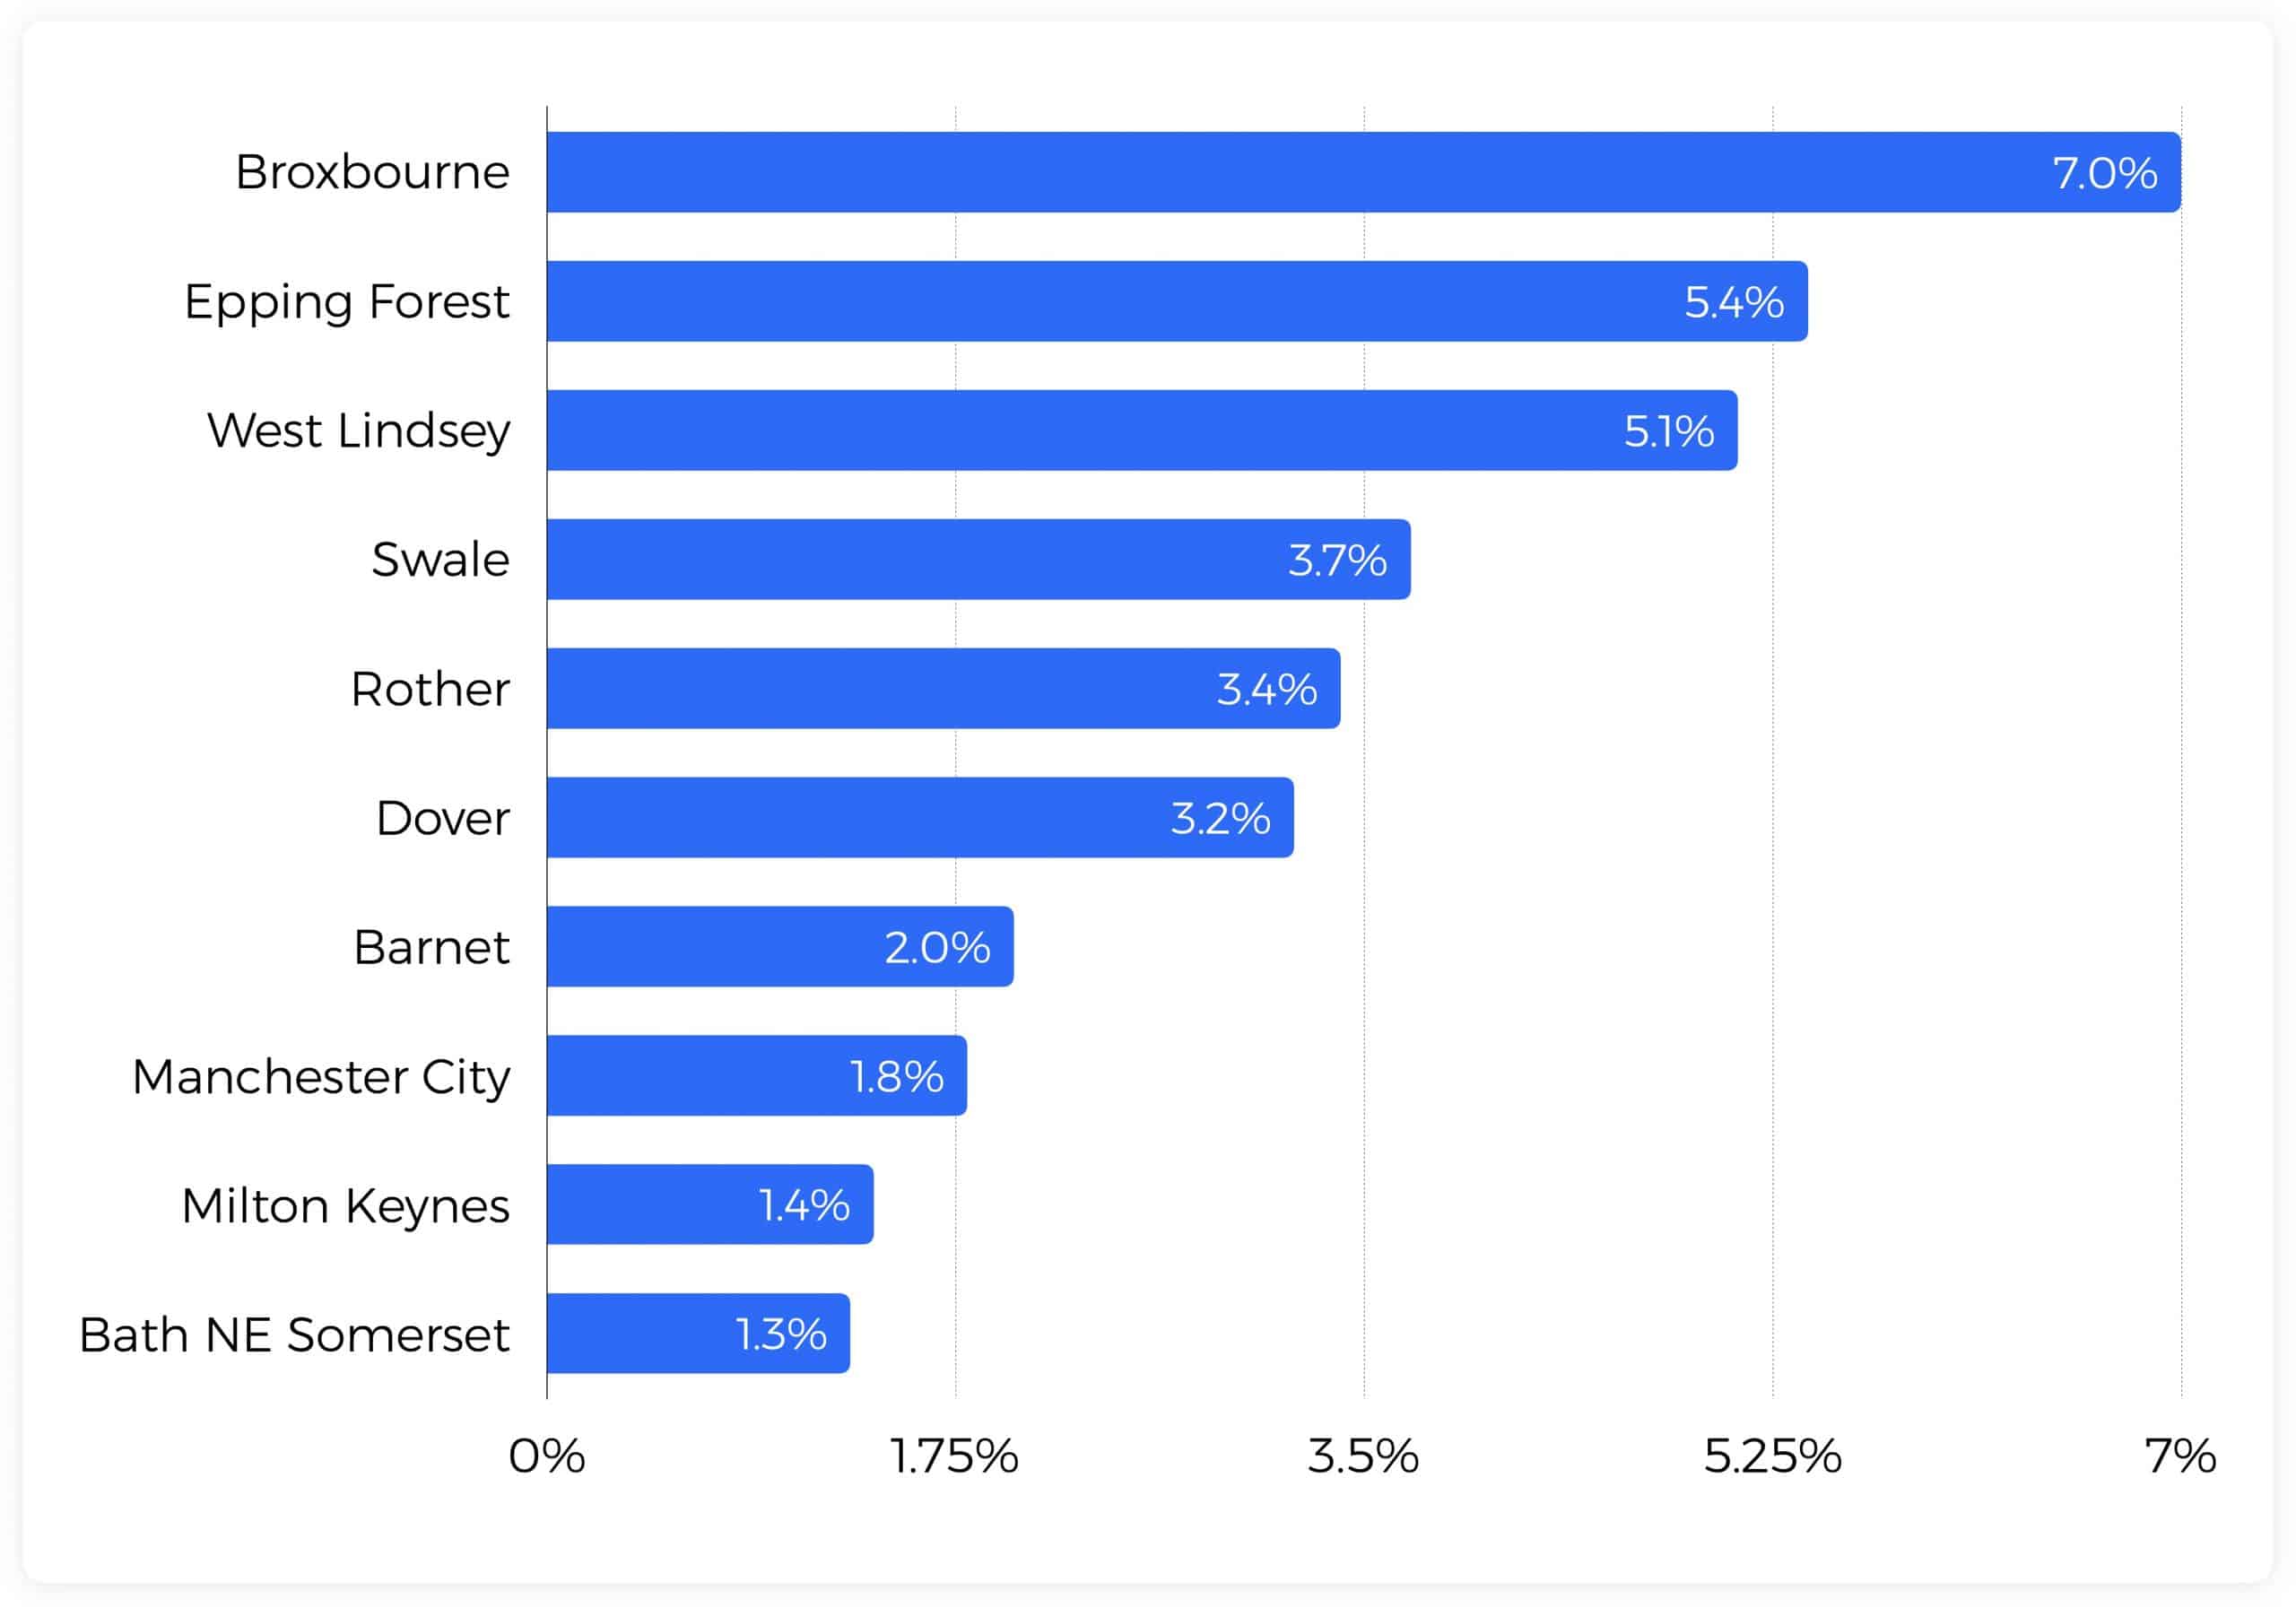
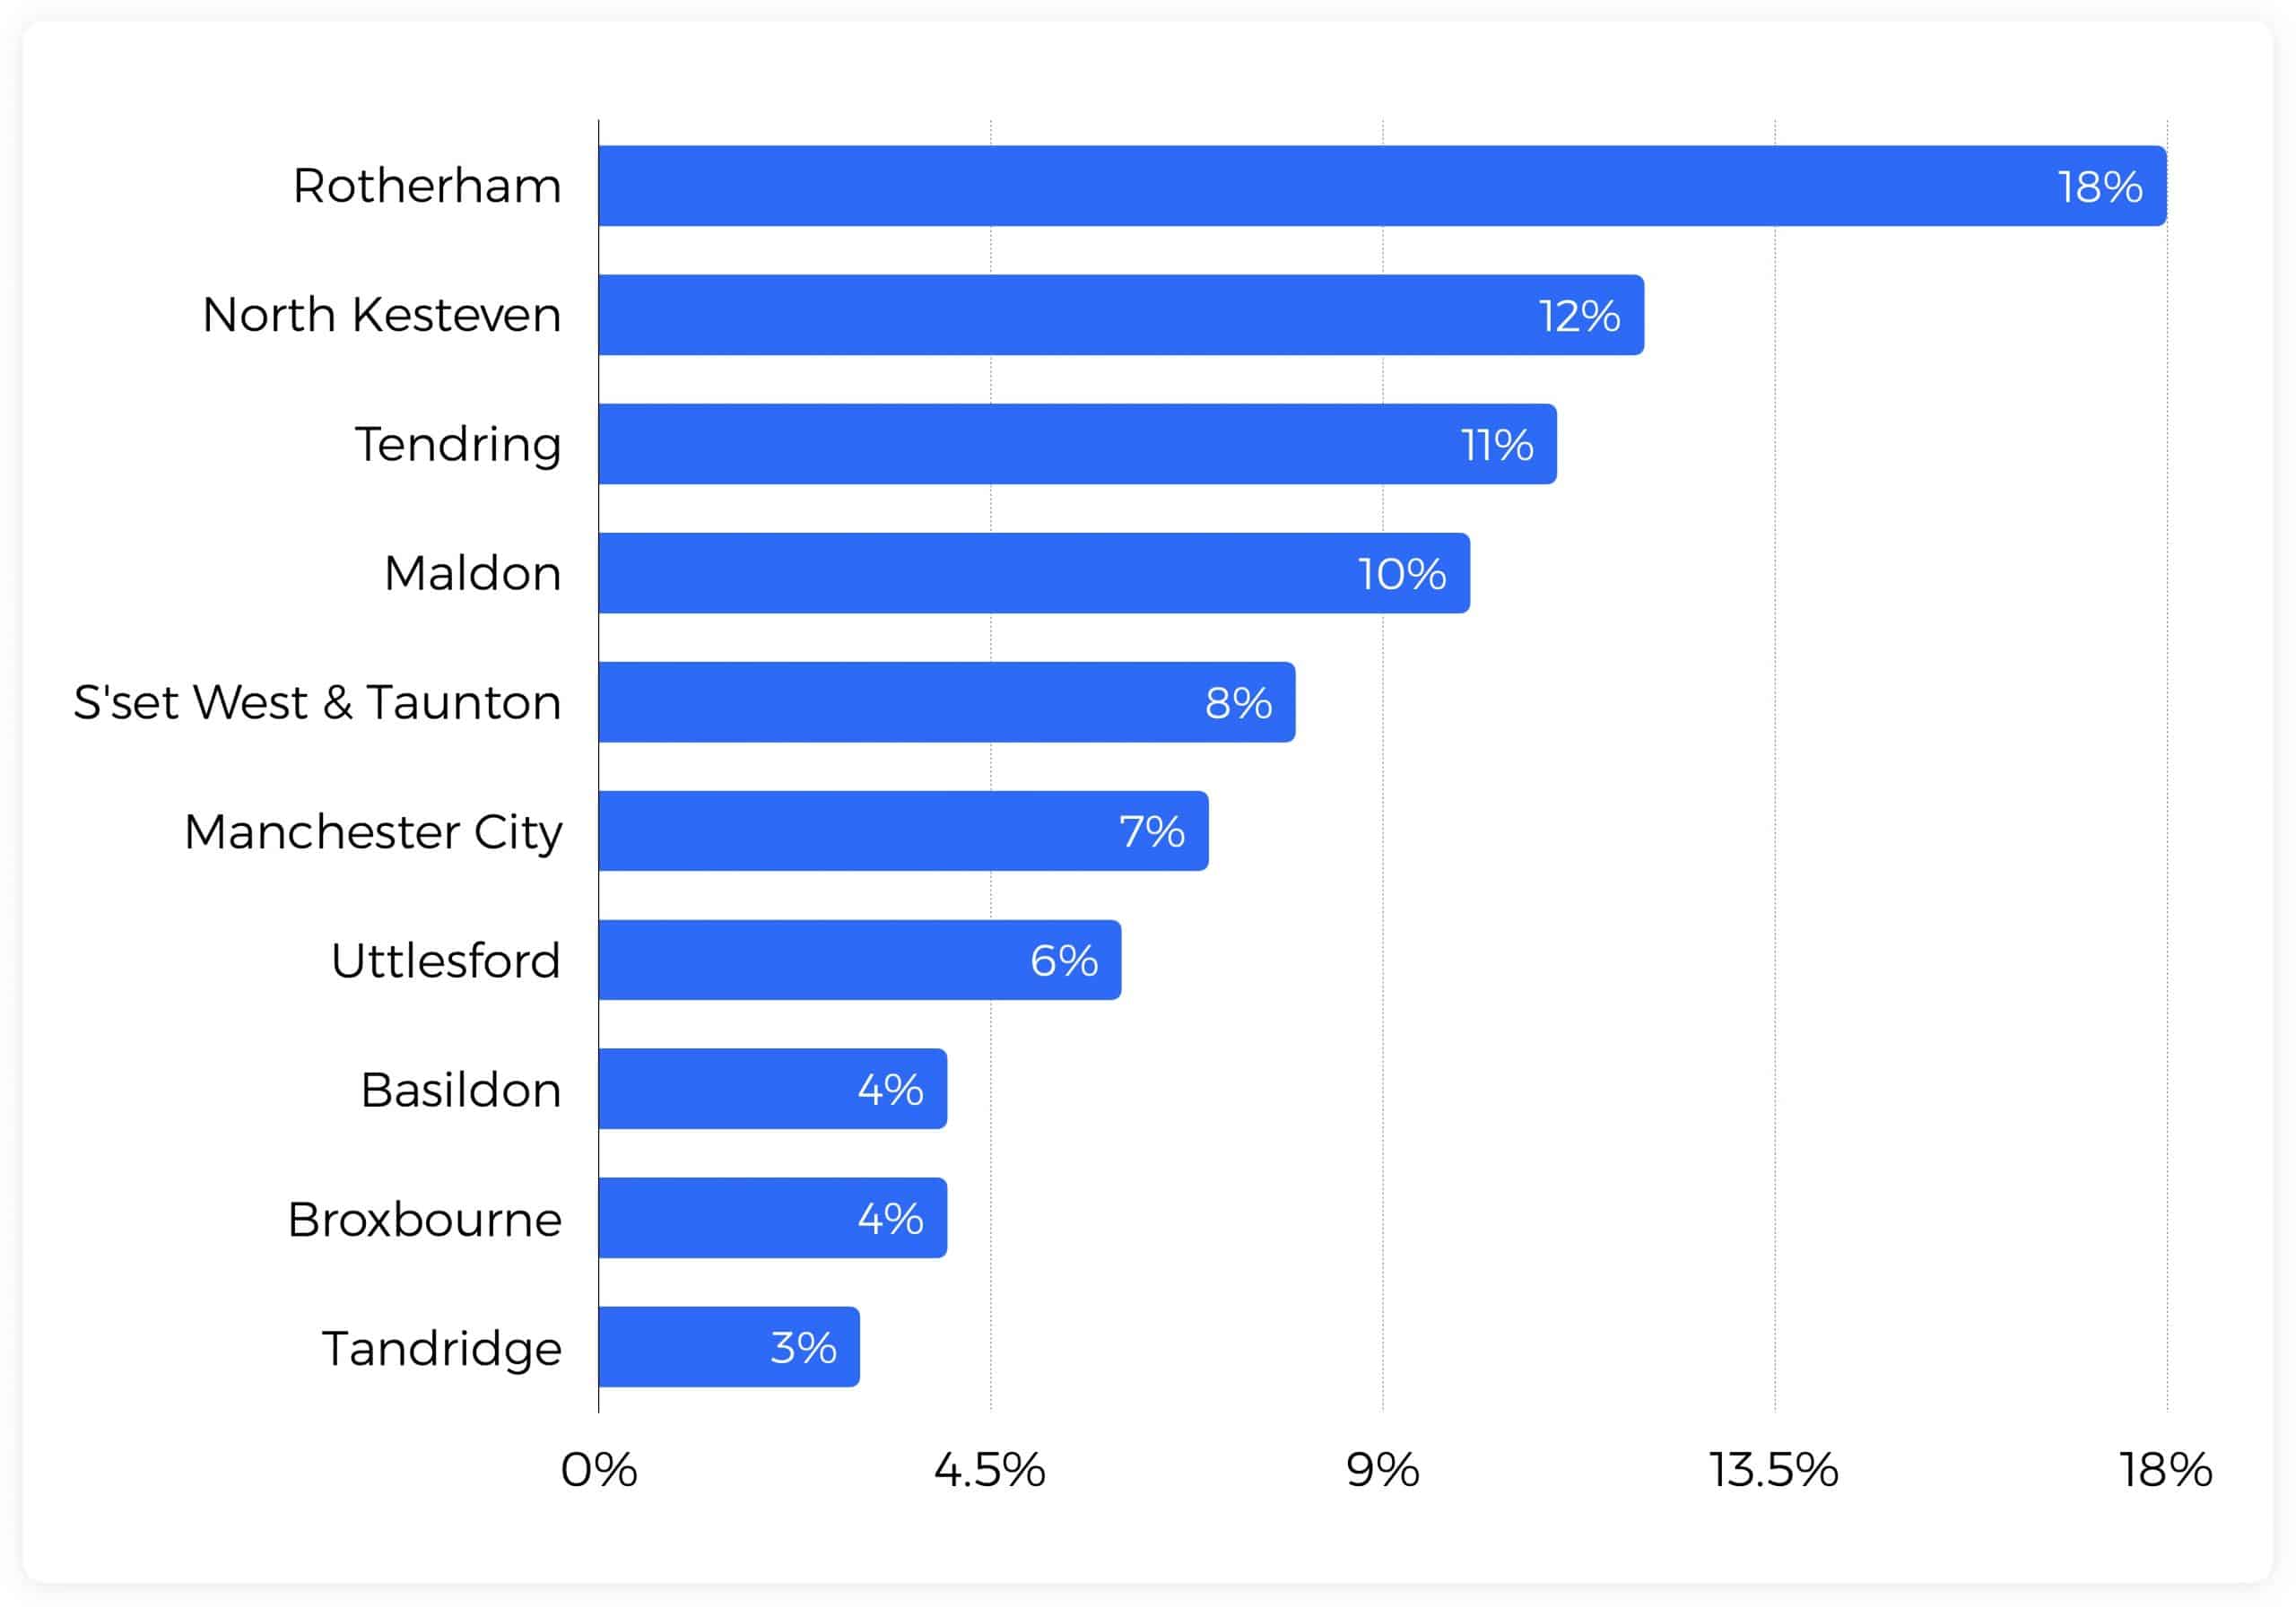
Broxbourne Council, located on the River Lea to the north east of London, takes gold for demonstrating the greatest increase – 7% – in catchment size over the Welcome Back Fund implementation period. That performance is followed by Epping Forest at 5.4%, also to the north east of London and West Lindsay, south of the Humber, just behind at 5.1%.
Across the top 10 winners, four are located in the South East, one in London and two in the East of England. Across all councils analysed, Huq found there to be a 0.3% contraction in catchment area size during the Welcome Back Fund implementation period, with those in the top 10 tracking collectively at 3.4%.
Visit frequency performance
Why is Visit Frequency important? Visit Frequency is a monthly measure of how frequently unique visitors return to the place, street or centre you manage. How often visitors return to an area is a key means to measure the attractiveness of places and why people go there. It also offers an important KPI for local spending and economic prosperity.
How Huq does it: Visit Frequency counts the number of different days on which a unique visitor is observed within the measurement area over the course of a month, and is then summarised across all unique visitors using the mean average. The WBF winners based on an increase in catchment size over the period:
Visit frequency increase during WBF
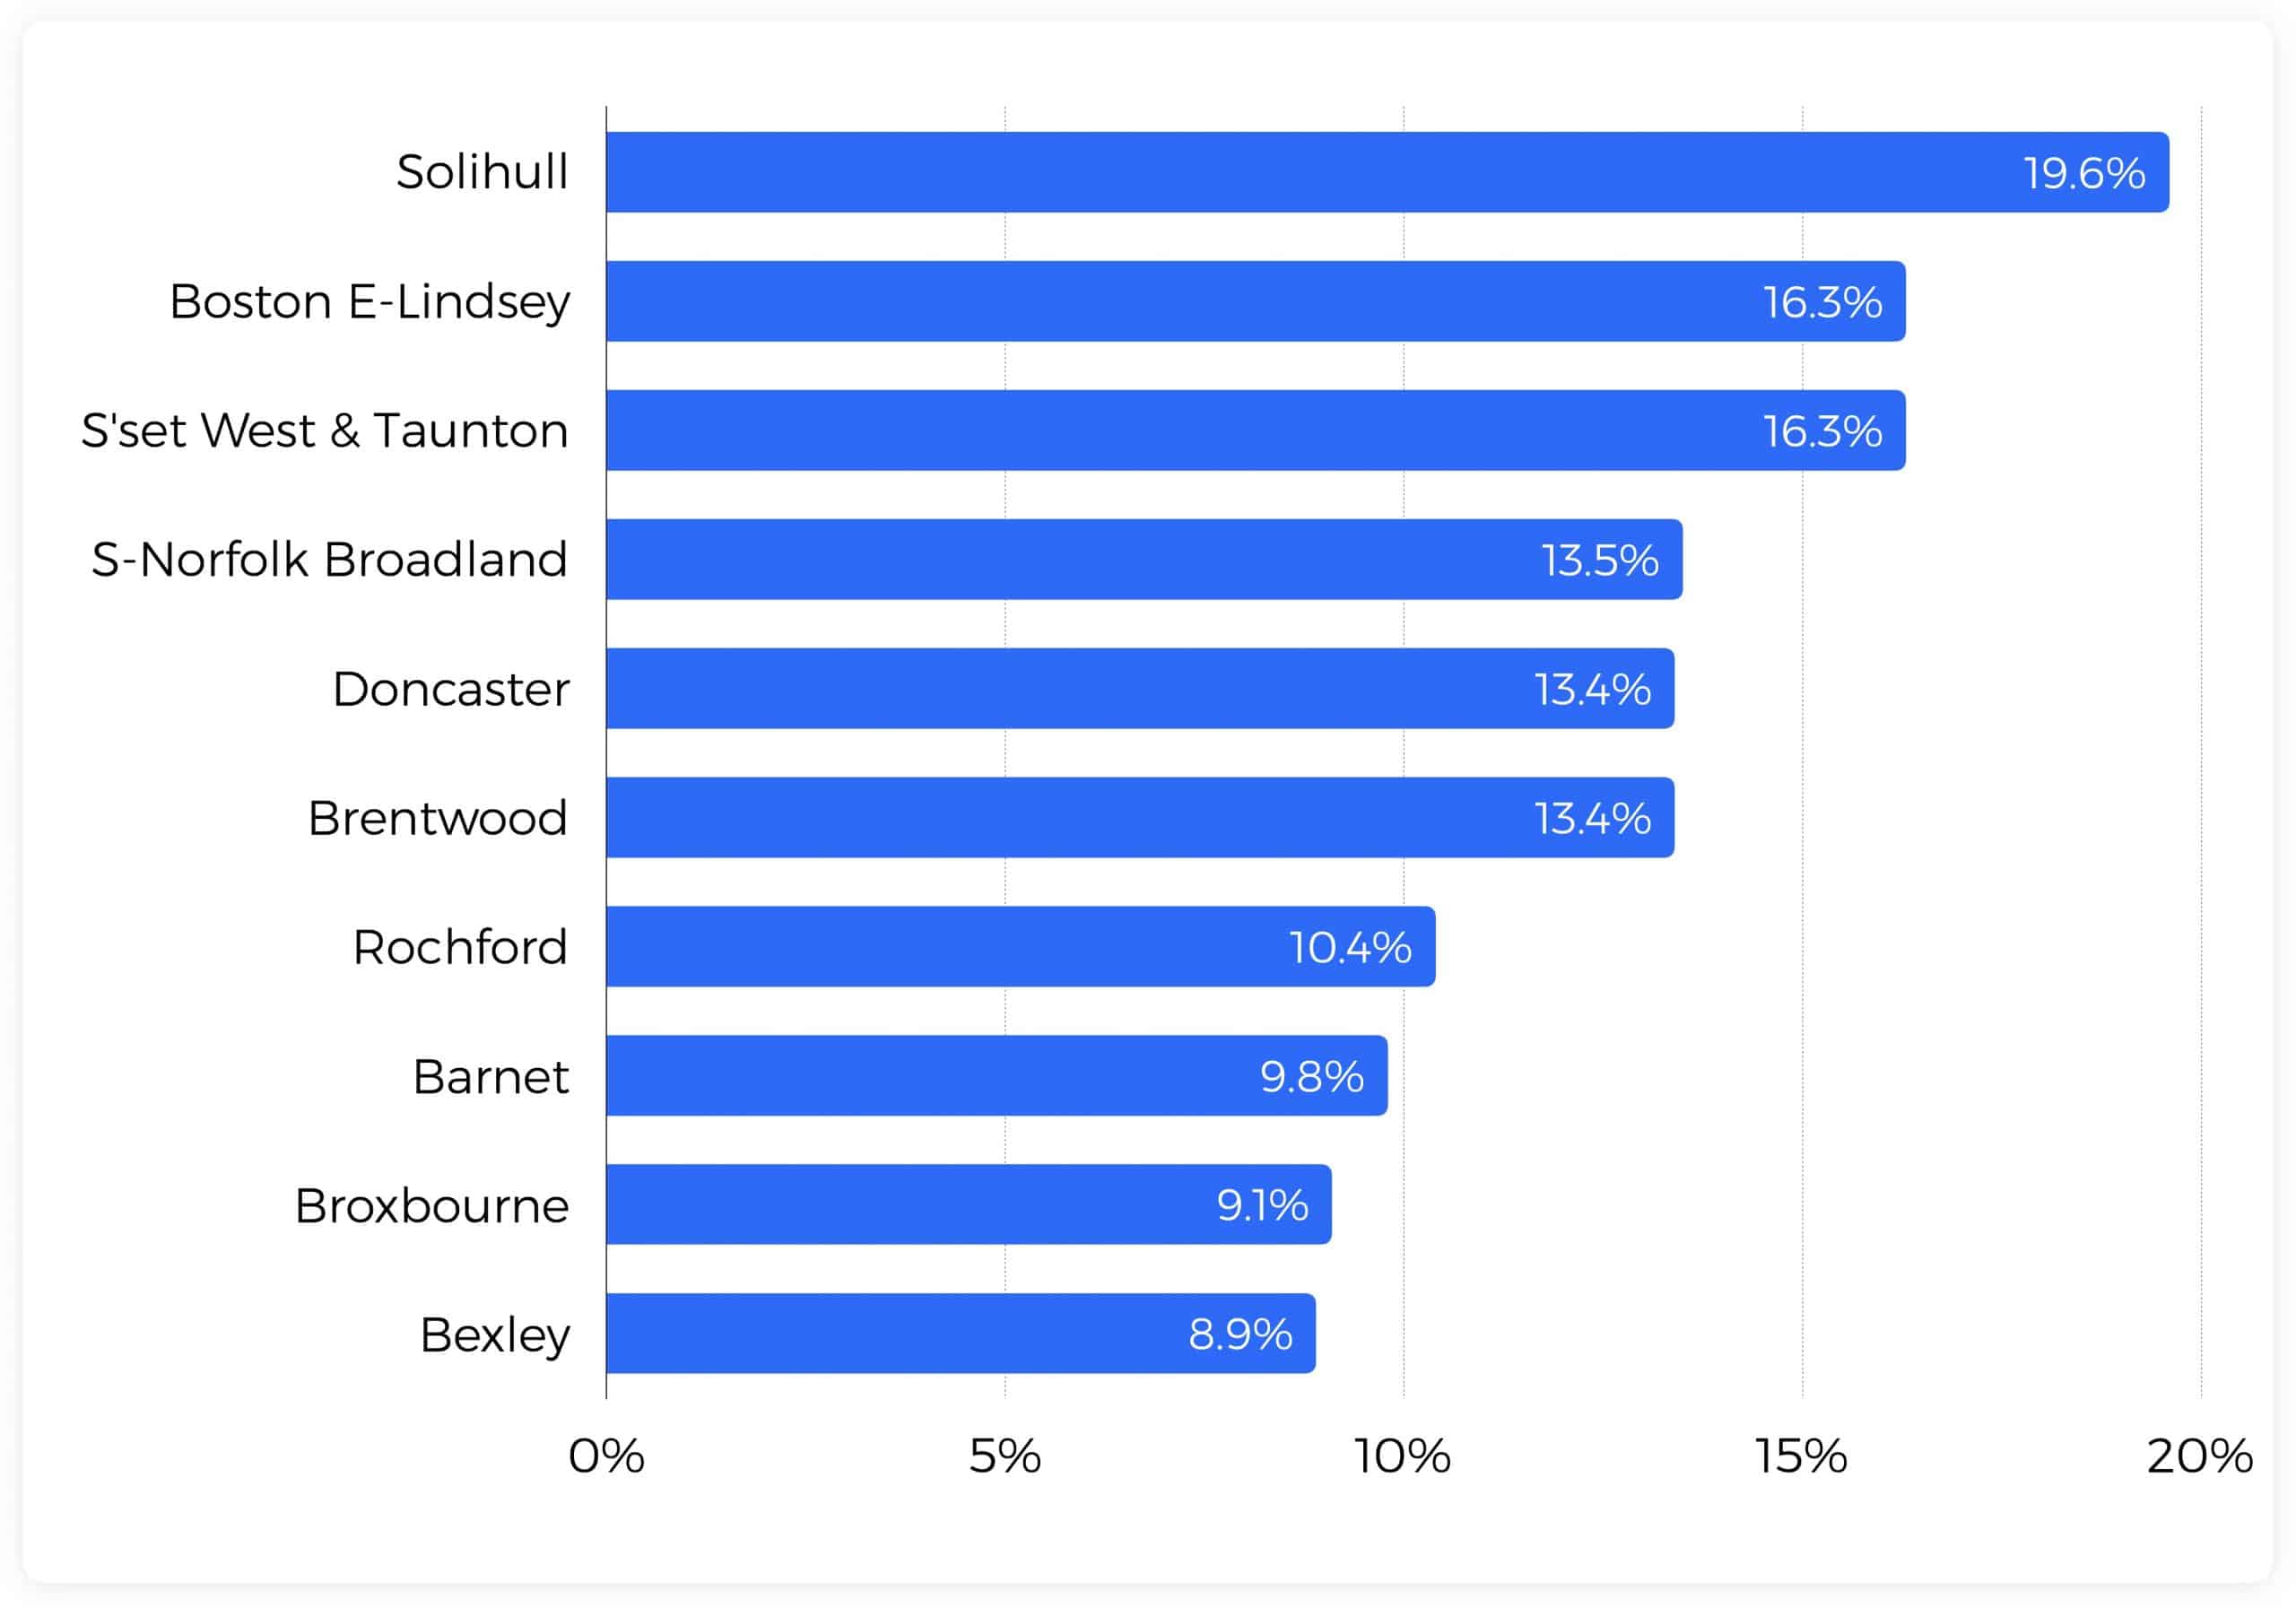
Solihull Council, located just outside Birmingham in the Midlands, leads the list of councils demonstrating the greatest increase – 20% – in visit frequency over the Welcome Back Fund implementation period. That performance is followed by Boston & East Lindsey at 16%, just south of the Humber, and Somerset West and Taunton in the South West also at 16%.
Across the top 10 winners, three are located in the East of England – in the main close to London – two in London and others spread across the UK. Across all councils analysed, Huq found there to be a 9.3% increase in visit frequency during the Welcome Back Fund implementation period, with those in the top 10 tracking collectively at 13.1%.
Wrapping up
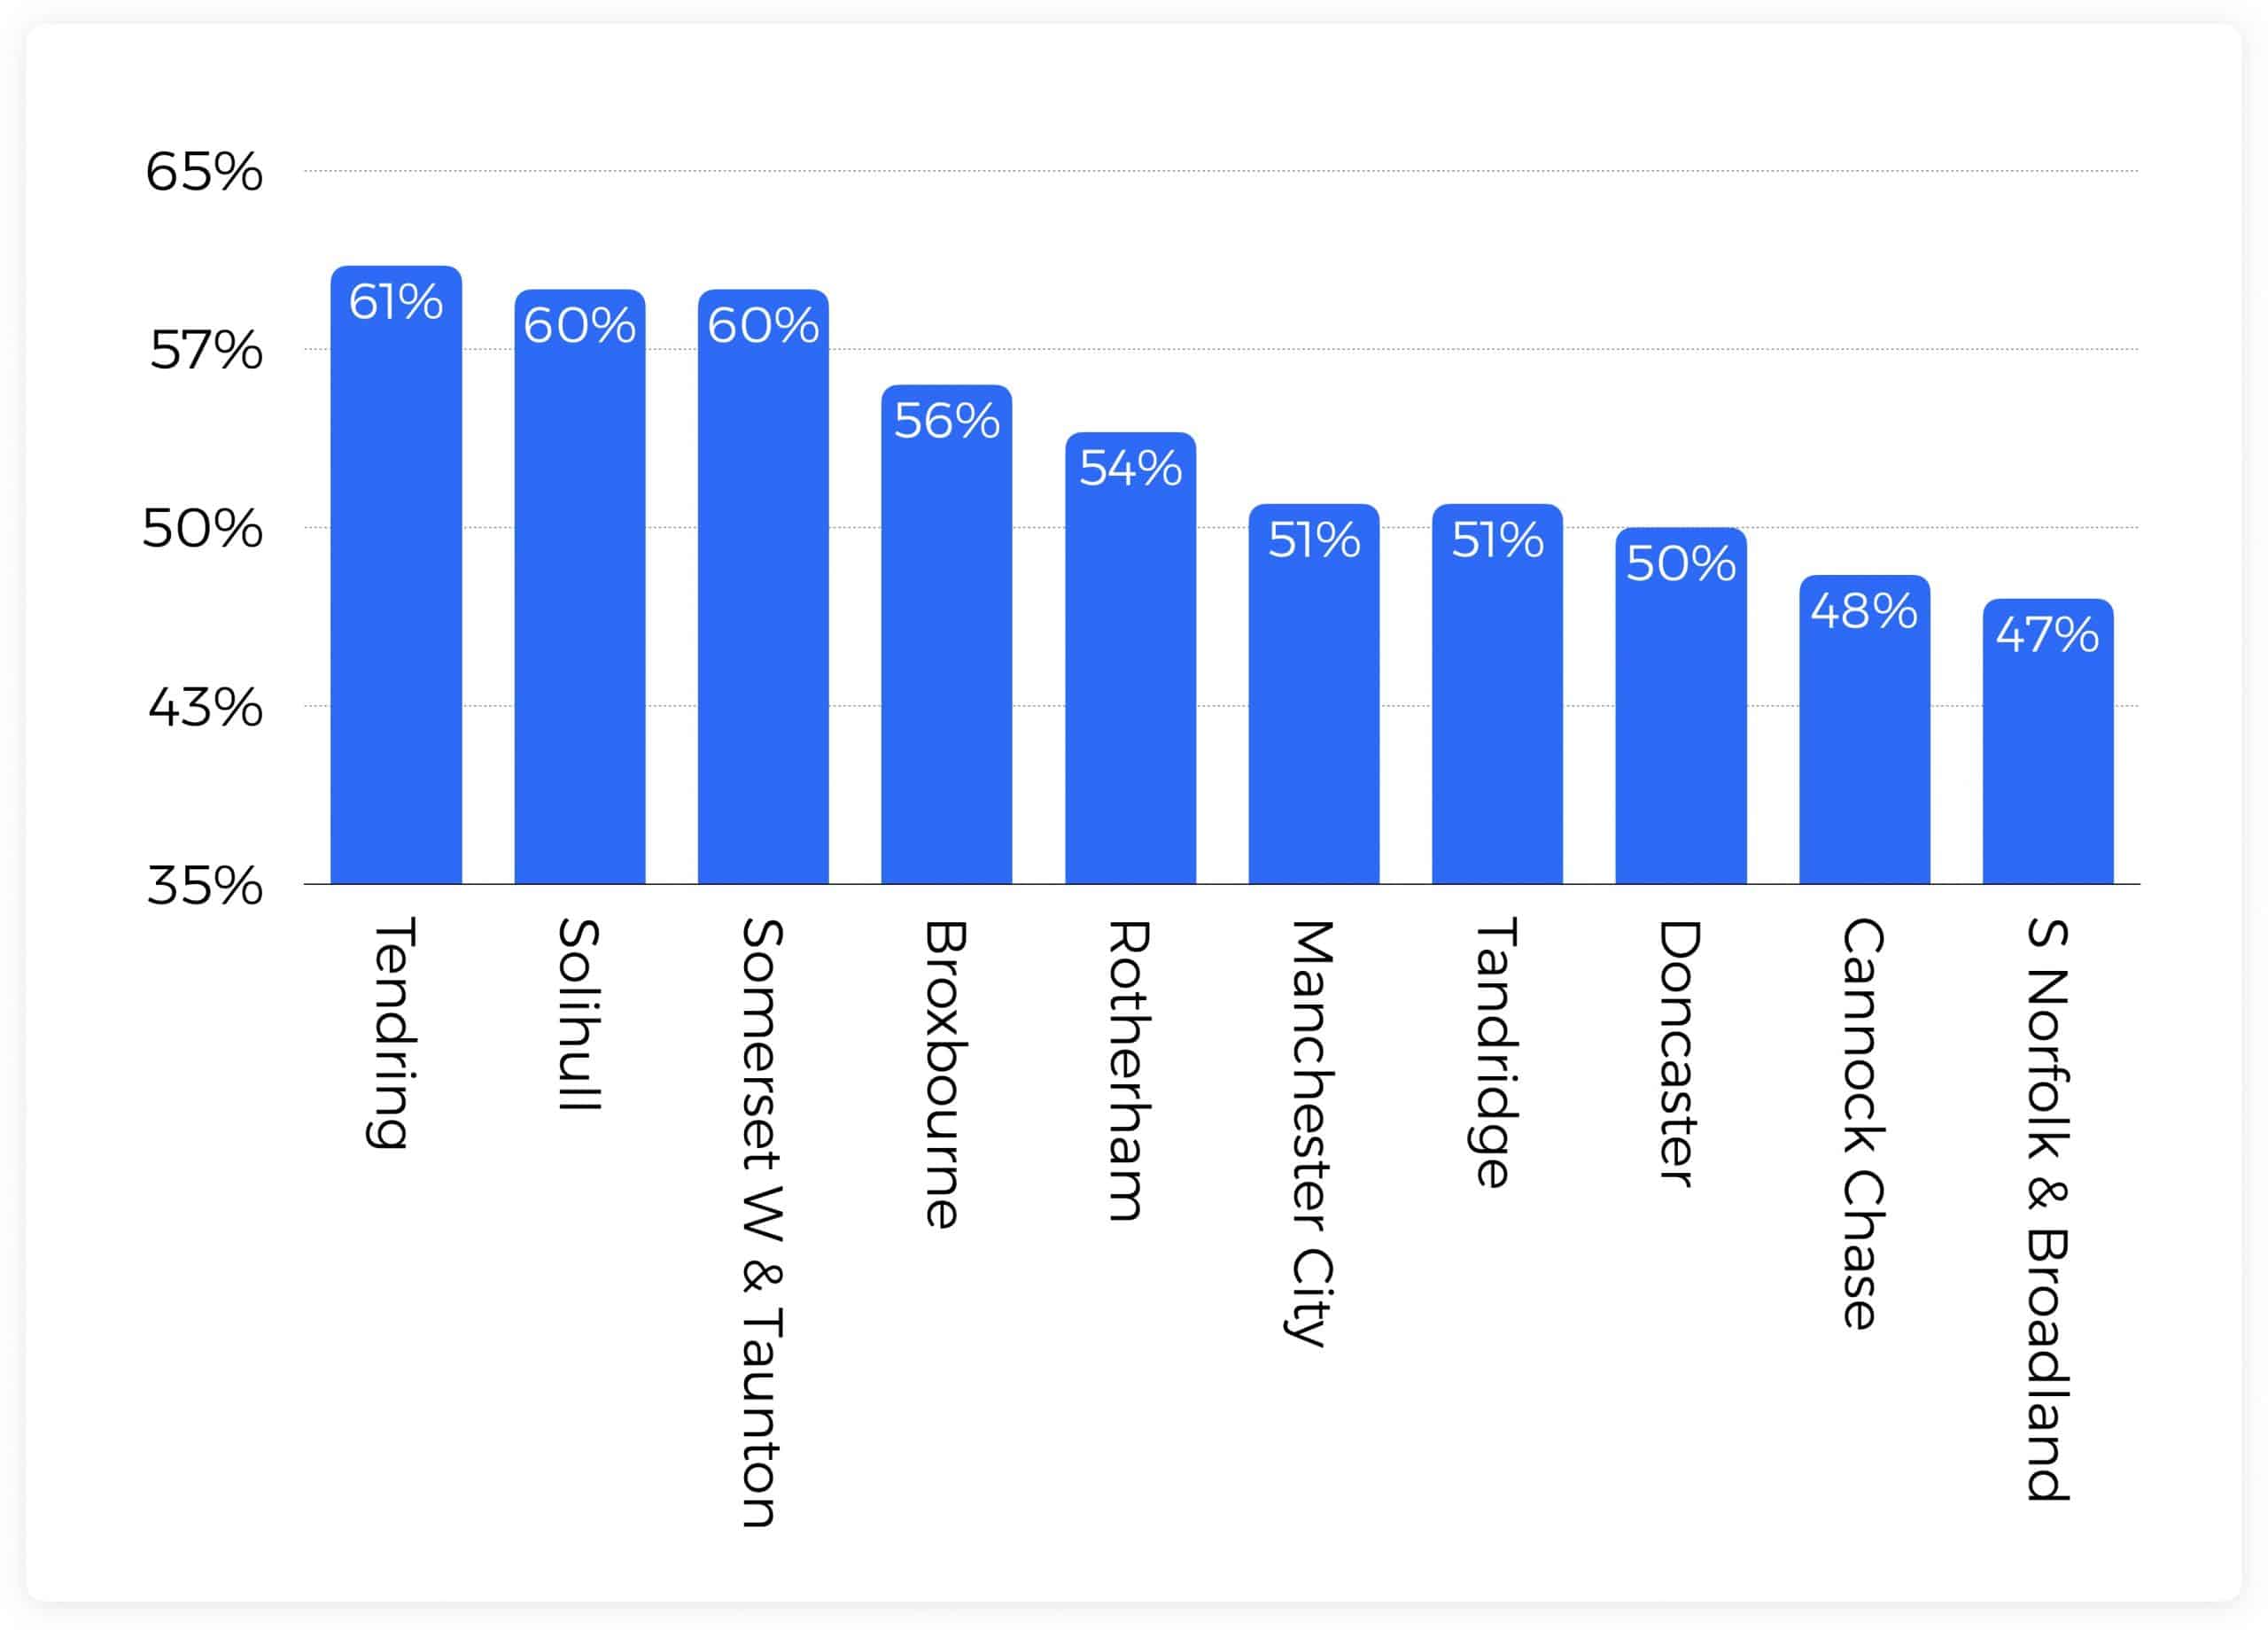
Huq has compiled an overall UK council leaderboard by combining the results from footfall, catchment, dwell-time and visit frequency modules during the WBF implementation period. The results are shown using a score from 1-100. The leading council overall is Tendring District Council, with especially strong results in footfall (up 76%, coming first in the list) and dwell-time (up 11%, coming 3rd in the list). Congratulations to Tendring!
And in an interesting twist we have Solihull and Somerset & West Taunton as joint runners up. Solihull demonstrates an impressive increase in footfall – up 35%, coming in 5th – and in visit frequency, up 20% and winning in that list. Somerset & West Taunton wins its place in the top three thanks to a consistently strong performance across all modules with footfall up 20%, dwell up 8% and frequency up 16%.
WBF overall winners
It’s great to see so many positive results across these councils and further afield, and to consider the positives that these indicators suggest for local communities. Understanding place performance through a range of relevant metrics offers a powerful means for councils to seek, plan and deploy funding for success. It also provides a means to assess the impact of central government funding interventions like the Welcome Back Fund, Levelling Up Fund and many more.

