
How Nottingham University & 3DI Use Huq for Policy Formulation
Public sector case study
Nottingham University
Using Mobility Data to Support Government Policy Formulation
Huq’s data is real-time and that makes our outputs even stronger and more valuable
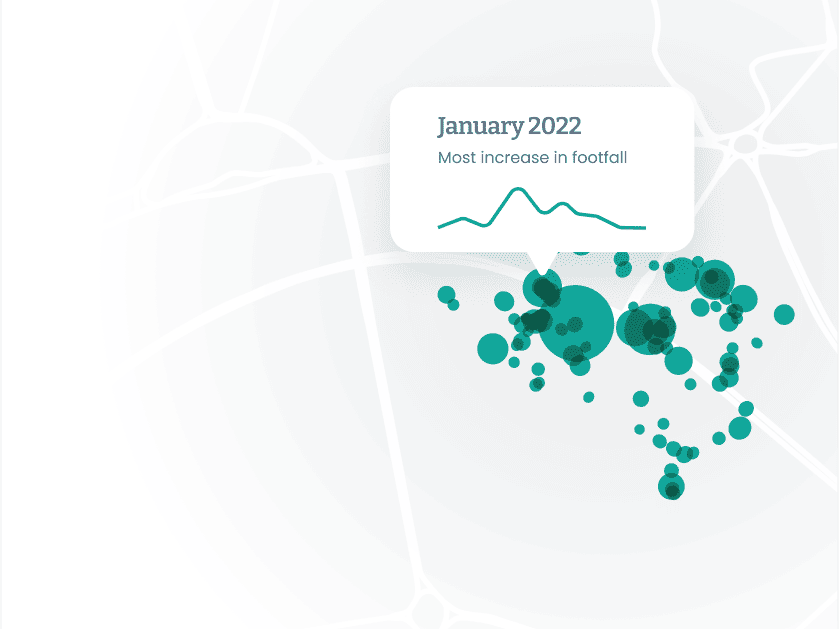
Find out how data from Track the Economy supports decision-making and policy formulation. Huq’s extensive population mobility data is used by the public sector to measure footfall across a range of consumer, business and industrial settings.
Using Mobility Data to Support Government Policy Formulation
The University of Nottingham’s economic and societal Data-driven Discovery Initiative provides movement data for local authorities through the Track the Economy (TE) project.
The TE project aggregates economic data from a variety of public and private sources to provide a unique picture of economic activity from the beginning of the Covid-19 crisis to the present day.
Decision-making and Policy Formulation
Data from Track the Economy supports decision-making and policy formulation. Huq’s extensive population mobility dataset is used by the public sector to measure footfall across a range of consumer, business and industrial settings.
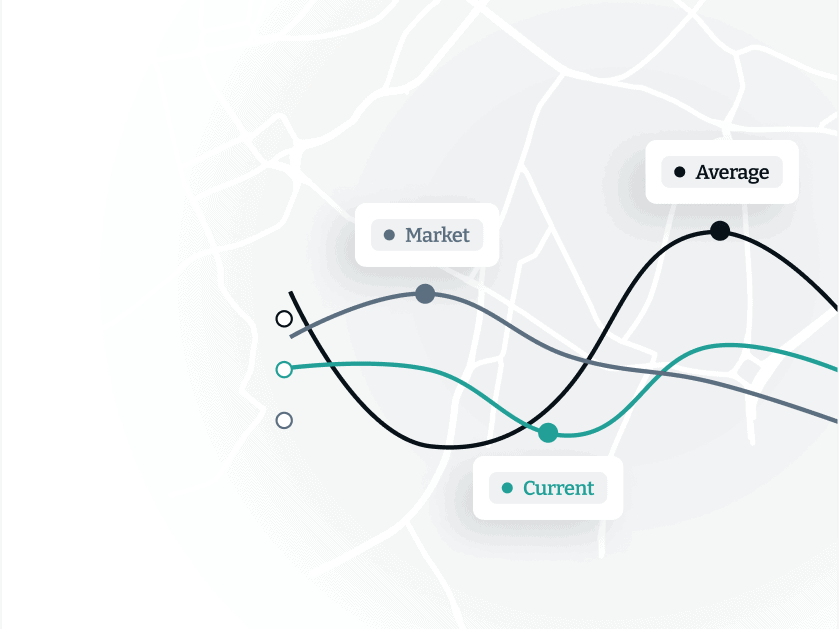
Huq contributes population mobility data, comprised of 1bn+ mobility events daily. The data is used by retailers, investors and the public sector to measure footfall across a range of consumer, business and industrial settings. Its mobility insights product is already in use by local councils to support decision-making around the future of our cities, towns and high streets.
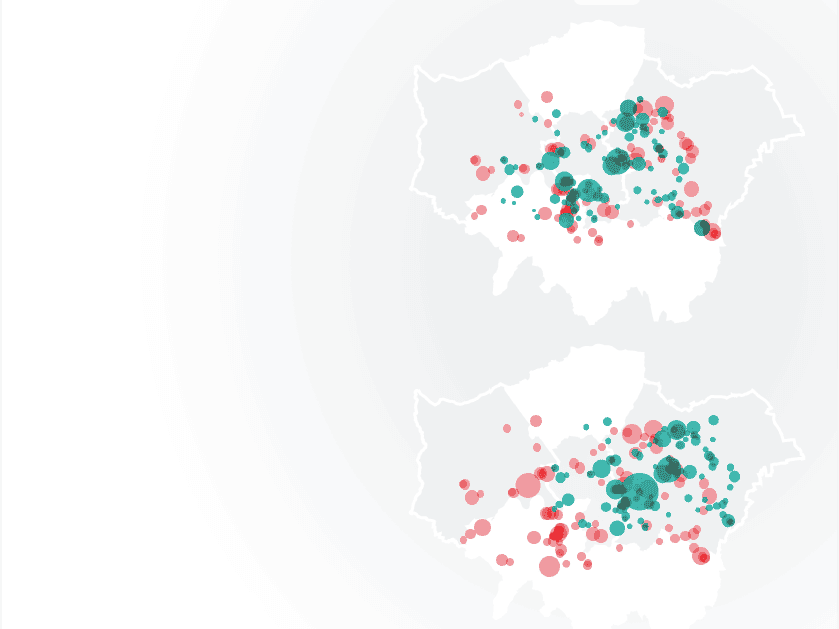
TE makes use of this granular-level data to rank local authorities by the severity of the economic impacts of Covid-19. Researchers at TE combine this index with pre-pandemic data measuring affluence at the local level to identify areas that have been doubly-hit by existing deprivation and negative Covid-19 impact.
4.8Bn
£ Influence
3
Gov Depts
8
Academic Partners
Huq’s data is real-time and that makes the data in the TE dashboard even stronger and more valuable. Both local and central government bodies will be able to use it to get a clearer picture of the real economic impacts of Covid-19 across the country
Benjamin Lucas (PhD, FHEA), Managing Director at 3DI
Join the world's fastest growing organisations

How KraftHeinz used Evidence for High-Frequency Demand Forecasting
CPG case study
KraftHeinz
How KraftHeinz used Evidence for High-Frequency Demand Forecasting
The data helps forecast demand and create more robust planning
How the third-largest food and beverage company in North America developed high-frequency demand forecasting across key market segments using Huq’s insights platform.
The Need
The Kraft Heinz Company is the third- largest food and beverage company in North America and the fifth-largest food and beverage company in the world, with eight $1 billion+ brands. With that scale of manufacturing and supply operations at stake, the company needs an accurate and detailed understanding of demand in its key markets and how that changes over time.
This intelligence allows KraftHeinz to plan efficiently and to minimise waste – especially as some of its products are perishable. Reuben Ayley, Head of Food Service Finance (International), plays a central role in this decision- making and came to Huq looking for solutions to help the company forecast demand across specific channels internationally, on a near-realtime basis.
The Solution
A large proportion of KraftHeinz’s Foodservice products are distributed and sold through bars, hotels, cafes and restaurants. In all of these places, the level of demand is determined by the customer footfall volume across those outlets. Huq’s global mobility data comes ready-enriched with place attributes, including place types. This makes it uniquely positioned to disambiguate trends across different types of outlet – or channels – and geographic markets.
Huq’s Customer Success and Engineering teams supported KraftHeinz during an initial discovery phase, helping them to structure outputs in the way that represented greatest value to them and made them readily actionable. Together they worked to group Huq’s native outlet types to match KraftHeinz’s own internal taxonomy, and experimented with different update intervals and aggregations to produce the most effective set of results.
Once the form and structure were agreed and verified on both sides, Huq scheduled a regular feed to deliver updates to Reuben’s team via an interactive dashboard.
The Results
Having access to in-store customer trends insights at this frequency and definition was a first for the International Finance team at KraftHeinz. It helped the company to plan their manufacturing and supply operations by accurately anticipating demand across different channels in markets ranging from Japan to the US to France. This new sensitivity to changing levels of demand has become a benchmark for planning internally. It is especially important now as the global market treads a path between pandemics, rising costs and changes in disposable income.
Join the world's fastest growing organisations

How Aviva Investors Used Huq's High-Frequency Insights to Invest
Investor case study
Aviva Investors
Jonathan Bayfield, Head of UK Real Estate Research at Aviva Investors
The data helps us to make better investment decisions
The Pandemic has had systemic consequences for places and how people use them. Covid-19 has accelerated change in existing trends. It has also created new ones.
Aviva Investors, the global asset management business of Aviva plc has sought to build these thematic changes into its investment process. The speed of change made decision-making complex. Trends that unfolded over years changed shape in days.
The challenge
The main challenge for Aviva Investors was how to stay informed on market shifts. Conventional indicators report monthly at best. Other data lacked the detail to be useful. Aviva Investors needed access to high-frequency data with granular capabilities.
The solution
As one of the largest European real assets investment managers, Aviva Investors looked for data that reflected how much activity is taking place in different parts of the economy. Key metrics centre on how people use places, and how that changes with time. Topics include the measurement of pedestrian footfall levels, store-visits and workplace presence.
Huq Industries offers effective measurement of these KPIs through its macro indicators outputs. This mobility-derived product allows for comparisons by sub-market, or industry, and geographic region. Huq’s mobility data has full timestamp coverage. This enables its macro indicators to be published daily with a 48-hour lag. These attributes make it ideal for measuring fast-paced change in great detail.
Over the last 15 months Huq has supported Aviva Investors in its analysis of UK and European Real Asset spatial trends. Aviva Investors draws on 30+ verified indices from Huq Industries’ Macro Indicators catalogue. Sectors measured are as diverse as waste plants, hotels, data centres and airports. In addition, regional outputs contrast office usage across 16 major cities on 3 continents. Huq’s measurement platform for cities and retail, provides Footfall and Catchment Area data and how that changes with time.
The results
Aviva Investors used Huq’s Macro Indicators and footfall solutions to track changes in behaviour during the pandemic. The frequent and granular data helps to inform their decision-making. Insights derived from Huq’s mobility solutions form the basis of research and articles written by Aviva Investors’ research team for their investment partners.
“Huq’s mobility data allows us to measure footfall, almost in real time, by submarket and by region. The data helps us to make better investment decisions and allows us to appropriately manage risk on behalf of our investor clients”.
Huq’s mobility data helps us to make better investment decisions and allows us to appropriately manage risk on behalf of our investor clients.
Jonathan Bayfield, Head of UK Real Estate Research at Aviva Investors
Join the world's fastest growing organisations

Verifying In-store Footfall Accuracy Using Sales Performance Results
Retail case study
Walmart
Verifying In-store Footfall Accuracy Using Sales Performance Results
The correlation between model and the actual sales figures ρ=0.85, with a MAPE of 3.8%
This article shows how mobility data can be used to accurately predict net sales results for consumer- driven businesses like Walmart, the leading US big box retailer.
The Objective
The goal is to extract results from Huq Industries’ Footfall and Dwell-time modules that are highly correlated with the net sales figures published by Walmart in its quarterly trading updates. This output can then be incorporated into downstream models and systems to inform research for analysts and investors.
Step by Step Guide
Step 1: Get Walmart net sales data
Walmart publishes its net sales data within its quarterly trading updates, which can be found on its Investor Relations webpage. Note that for the purposes of this analysis, use is made only of the ‘Walmart US’ net sales segment.
Step 2: Find Walmart store visits
Huq’s mobility data serves as a proxy for consumer demand across Walmart’s US stores. This data is pre-enriched by Huq Industries in a process that extends raw geo-spatial data to include point of interest (POI) attributes such as business name, type and location.
Extracting Walmart visit data is therefore made easy by filtering on the raw place name (place_name), the standardised name (brand_name), or indeed by ignoring the POI attributes and using the WiFi SSID observed by the mobile device (impression_ssid) to match Walmart-specific patterns.
Step 3: Extract Walmart store visits
One way to quantify demand across the Walmart estate using Huq’s enriched geo-spatial data would be to count the number of distinct mobile devices (ie. panelists) present at Walmart each day. This approach can be useful in many analyses but after much experimentation there is a second strategy that produces results that more closely reflects behavioural nuance – and this is related to dwell.
During the same enrichment process that supplies the point-of-interest attributes, an estimate of dwell is also calculated and added to the resource. These properties can be accessed and manipulated via the columns impression_dwell_lower_bounds and impression_dwell_upper_bounds, which represent the upper and lower estimate for visit duration. These are calculated using the cumulative elapsed time calculated by continuous observations of a mobile device in the same place.
For the purposes of this study however, it is beneficial to develop a measurement of dwell that is less strict. The strategy used in this exercise groups observations into visits where they occur within 65 minutes of each other – without requiring them to be continuous per se.
Step 4: Test and training datasets
Walmart provides seventeen quarters of historical results via its investor portal. These are split into two sets; one to use for our training set and the other to test our output against. The training set helps us to select the optimal combination of parameters from the signal candidates described in Step 6. How this is evaluated is explored in Step 7.
The first twelve rows are chosen for training, and the remaining five are retained for testing. Separating them chronologically avoids test information leaking into the training process and causing lookahead bias.
Step 5: Define rough signal form
At this point take the training set from Step 4 then prepare it by eliminating behavioural outliers and concretely defining our measure of ‘dwell’.
i. Preparing the data
It is very common to find elements of noise within a dataset, and Huq’s enriched ‘Events’ feed is no exception. Some characteristics may be derived from interference at the sensor level; some artefacts may be behavioural and completely natural. As our demand metric relates to dwell, it is necessary to eliminate data points that show excessively little or large dwell before applying it. Filtering the data in this way excludes facets such as Walmart employees or other false positives derived from the enrichment process. Our chosen strategy filters the detected dwell value by an upper threshold Du , a lower threshold Dl and also determines whether to filter on a daily or per-visit basis, Db.
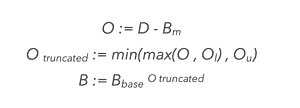
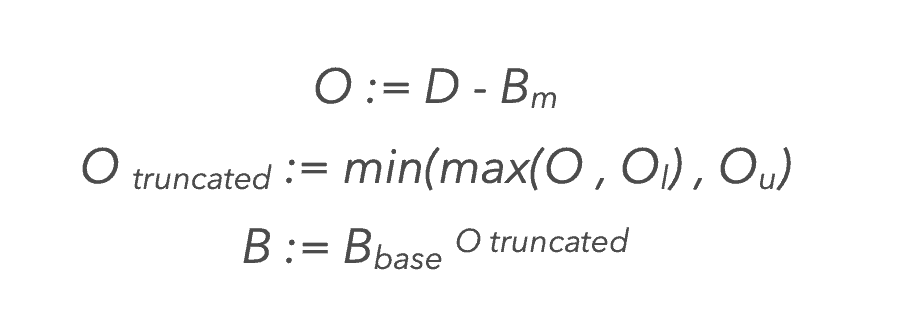
ii. Transform dwell into ‘demand signal’
Let’s assume that dwell-time and spending money in- store is a non-linear relationship. Specifically, let’s suggest that there is a ‘normal’ level of dwell Bm and a ‘normal’ propensity for Walmart store visitors to spend, Bbase, both of which are constants.
We can then raise Bbase by the difference between the observed dwell value and the ‘normal’ value, Bm. To keep this value from exploding or vanishing, it is expedient to truncate the difference in the range of Ol to Ou before raising the power.
This can be summarised as follows:
iii. Normalise the data for panel growth
The size of Huq’s mobility panel changes over time as the number of apps supplying data increases, and apps’ own audience sizes fluctuate. As this study results in a time-series output, it is imperative to account for these changes in the normalised result so as to accurately represent the real trend. Similarly, it is also important to account for growth in the number of daily measurements observed per device using Huq’s measurement software in order to maintain a consistent view of ‘dwell’.
It may also help to consider how these characteristics vary geographically. The normalisation strategy employed in this exercise works by dividing the ‘demand signal’ observed across Walmart locations by the equivalent metric for the full US panel on equivalent day. This approach may be further improved by normalising on a localised basis to account for regional variations in data coverage, and by pre-filtering the data to remove individual app or panelist outliers.
iv. Respect seasonality in signal generation
Different week parts – weekdays, weekends and public holidays – have significance for in-store retail behaviour, and it is beneficial to recognise this in signal preparation. Accordingly, the normalised output is grouped using this classification, and is supplied to the model independently.
Step 6: Test and training datasets
The many possible combinations of parameters in Step 5 produce a huge number of candidates for signal representation, numbering 750K+. So, which candidate set offers the closest match to Walmart’s net sales values? A simple regression model (see Step 7) allows us to identify the best candidate set.
Step 7: Regression and validation
On the basis that we can expect longer dwell-times to lead to higher net sales results, a suitable model to use in this instance is non-negative least-squares regression as the inductive bias is well suited to this problem.
How do we know which signal output is best suited to net sales prediction? We’ll look for the result with the smallest mean absolute percentage error (MAPE), and use ‘leave-one-out cross validation’ to make best use of the limited supply of training data available in Walmart’s quarterly net sales figures archive.
The end result
The Pearson correlation between the output of the regression model and Walmart’s actual net sales figures on the (completely unseen) test set is ρ=0.85, with a MAPE of just 3.8%.
Conclusions
Using this parameter selection strategy it emerged that the optimal preparation steps and parameters are:
(i) remove dwell-time outliers, keeping daily device dwell values in the range of 0 to 160,
(ii) construct ‘demand signal’ by subtracting 30 from the daily dwell figure, and bound to the range of -12 to 60, then raise to the power of 1.03
(iii) normalise by counting 2hr-truncated timestamps across the full US dataset, where devices must have visited a non- residential location
Lastly, aggregate results by day and divide the ‘demand signal’ by this value.
Join the world's fastest growing organisations

How Hertsmere Used Evidence to Measure Covid-19 Recovery
Customer case study
Hertsmere Council
How Hertsmere Used Evidence to Measure Covid-19 Recovery
We no longer need to pester pedestrians to answer surveys!
Hertsmere is the gateway to south Hertfordshire, lying across the M25 and M1 in the East of England. The Borough is largely rural, but boasts beautiful market towns and has great transport links. The council began using Huq’s place monitoring insights in June 2021 at the time when the country was coming out of the Covid-19 pandemic.
The Challenge
Hertsmere Borough Council was keen to understand how pedestrians use their local high streets, and more particularly how these places were affected by the pandemic.
We know anecdotally how our local towns have fared, but without factual evidence we had no basis on which to make decisions,” says Lesley Crisp, Principal Economic Development Officer at Hertsmere. “We had one undersubscribed survey on market performance and nothing around the town centre – so we were delighted to find that CommunityVision could supply real insights to give us the evidence we need.
The Solution
Huq’s Customer Success Manager Gemma Mariotti worked with Lesley to identify the key information that would help the Council. They agreed to focus on Hertsmere’s four main town centres:
- Borehamwood
- Bushey Heath
- Potters Bar
- Radlett
Hertsmere wanted mobility data insights to answer three key questions:
What are our dominant catchment areas for each town centre?
Do market days in Borehamwood have an effect on footfall in the town centre?
Huq’s place monitoring platform offers a range of modules designed to deliver mobility insights capturing how and when people use the chosen places. Using Footfall and Catchment Area Map modules, Huq provided Hertsmere with the data they needed.
Evidence answers Hertsmere’s questions
#1 How is footfall recovering from the pandemic?
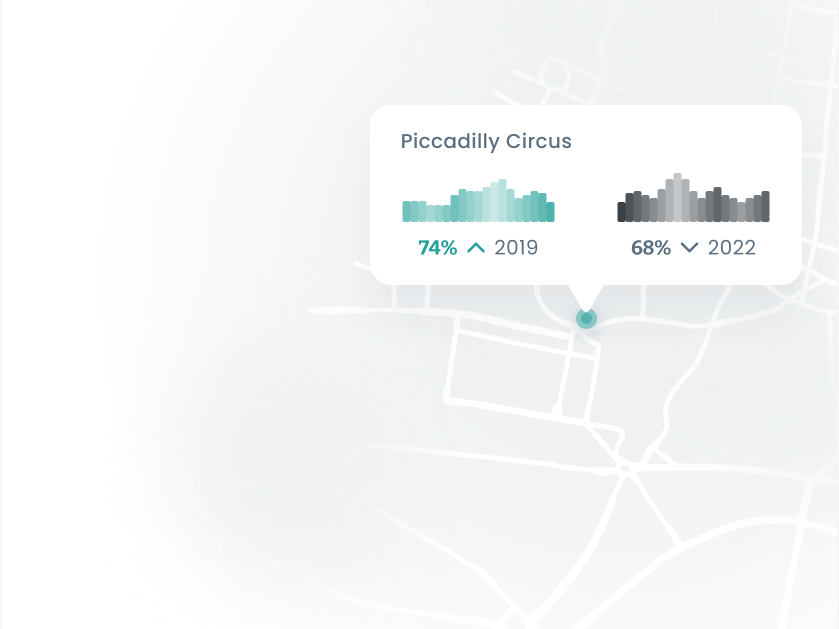
Huq’s unique cloud-based platform provides historic mobility data insights which allow Hertsmere to overlay graphs tracking footfall across 2019, 2020 and 2021. These insights show clear trends in town centre recovery – including, for Bushey Heath, a dramatic increase in footfall over November and December compared to pre-pandemic levels.
#2 What are the dominant catchment areas for each town centre?
Huq’s insight platform offers catchment area maps, which represent the dominant area that town centre visitors travel from – and rarely constitutes a simple radius. The Council was able to compare Catchment Areas at different times, showing a significant increase in Radlett’s catchment area over Christmas – possibly due to key draws such as the theatre, specialist essential retail shops and a large restaurant area.
#3 Do market days in Borehamwood have a positive or negative effect on footfall?
Hertsmere used Huq insights to compare footfall on market days to other days, to identify whether they have an impact on when and how people use the towns. By comparing market days on Tuesdays and Saturdays to the Borehamwood footfall baseline (marked as 100%), we can look for patterns in the data suggesting a correlation between them. In this case, the uplift in footfall associated with market days was not significantly higher than normal.
Join the world's fastest growing organisations

Interview with Lesley Crisp, Principal Economic Development Officer at Hertsmere
An interview with
Lesley Crisp
Principal Economic Development Officer at Hertsmere Borough Council
Huq's insights help us to make smarter, evidence-led decisions
Hertsmere Borough Council selected Huq to provide monitoring coverage of four of its towns in June 2021. Prior to this, the council had never had a systematic monitoring solution in place. Instead they had relied on surveys carried out at intervals in different locations.
Our second year with Huq’s platform
Hertsmere Borough Council was keen to understand how pedestrians use their local high streets, and more particularly how these places were affected by the pandemic.
Which funds have you used the data for?
We used insight from Huq’s place monitoring platform as an evidence base to plan, implement and measure the impact of changes made using Welcome Back (WBF) and Shared Prosperity (SPF) funding.
Which modules did you decide to use?
We used Catchment areas to learn where people come from, Footfall to know how many, and Hourly Footfall to see when.
What were your main measurement aims?
When we started using Huq’s platform we where keen to study three specific areas.
For some time we had been running Market Days in our borough. We wanted to see whether attendance had recovered post-Covid. Similarly, we were aware that our Town Centres had suffered badly during that period. How quickly were people coming back? The same interest applied to the Night Time economy as well.
What did you learn from the insights?
We analysed four years worth of data to establish a pre-pandemic benchmark (how events performed before the pandemic). Compared to that baseline, footfall and hourly footfall data showed only a minimal uplift on the days and hours that the markets ran.
We then looked at how market days performed as restrictions eased while the country came out of lockdown. We saw no change to the performance of our Town Centre on market specific days based on footfall data.
Market Days averaged 7% below a normal day in 2022! Our hourly metrics also show the majority of Town Centre footfall occurred outside of the hours of the market day meaning the market had little to no effect in that period.
One a separate note, we wanted to improve the Night Time economy! Fridays and Saturdays showed a decrease in performance during the pandemic (as expected), in the ‘new normal’ we are starting to see improvements in our nighttime economy above the levels of prepandemic.
We are monitoring this moving forwards to create a more complete sample size to concretely understand if it is improving.
Making the case for change
Borehamwood market will be closing in August – we know the market days haven’t been successful, we truly understand to what extend this is the case with Huq’s data but we also had a feeling based on what our feedback was. Now we can invest our resources into other activities where demand is greater.
What's next for the Council?
Sky Studios is coming to Borehamwood in the Summer of 2022. We can’t wait to see the impact that this has on the local economy and small independent businesses as new workers and residents come to the area (along with the occasional celebrity!).
The UK Shared Prosperity Fund (UKSPF) deadline is also just around the corner, with funding to continue the work that we are doing across Hertsmere to make it a greener, cleaner and more vibrant place.
Huq’s place monitoring data remains an important asset for us as we plan, action and measure the effects of our interventions. And with growing emphasis on evidence-based choices we’re certain that role will grow.
Join the world's fastest growing organisations
Interview with Fraser Willcox, Economic Development Officer at Dacorum
Using Location insights to effectively allocate Welcome Back Funding (WBF) with
Fraser Willcox
Economic Development Officer at Dacorum Borough Council
The data help us make decisions on how to put Dacorum on the map
In December 2021, Dacorum Borough Council decided to use Huq’s place monitoring platform to provide coverage of 5 of its towns for Welcome Back Funding (WBF). The modules they selected include Catchment, Dwell, Footfall, Footfall Density and Place Satisfaction. In this interview, Fraser Willcox – Economic Development Officer – offers his insights into what Dacorum are doing to improve places and communities within the council using Huq’s data.
Using Mobility Data to Measure the Welcome Back Fund (WBF) Interventions
Dacorum Borough Council had two principal interets in accessing Huq’s place monitoring insights for their centres. Reflecting WBF aims, their first concern was to understand how centres were recovering from Covid-19 and how changes in visitor behaviour compared year-on-year. The second relates to their regular Market Day, and what Huq’s footfall data suggests about the impact those events have on the local economy.
Which funds have you used the data for?
Dacorum Borough Council procured Huq through the Welcome Back Fund (WBF/ERDF).
What are you analysing/monitoring?
We are currently receiving insight on the following modules: footfall, dwell, density, catchment, satisfaction and visitor frequency. We receive quarterly reports from our Customer Success Manager at Huq, and in our first report we examined three key questions; how have our locations recovered from the pandemic, how has the way people use our spaces changed year on year and how are our market days performing?
What did you learn?
Hemel Hempstead is the largest town within the borough of Dacorum. With regards to footfall, we found that the town centre has shown good signs of pandemic recovery, with an increase from 2020-2021. Footfall for 2022 is 100% when compared with the same period in 2021, although still only 50% compared with the same period pre-pandemic.
Although footfall fell during the pandemic, average dwell time had a slight increase of 2% during Covid measures and has increased by a further 16% in the new normal, indicating that people are spending on average 16 minutes or longer in the area per visit.
The catchment module allows us to see the 20%, 50% and 80% catchment areas for our chosen areas and monitor how this changes over time. Data has shown us that the 20% localised catchment area for Hemel Hempstead in 2021 was smaller than it was 2020, excluding areas such as Bovingdon and Kings Langley in the south. This reduction in catchment size indicated that a larger proportion of footfall was coming from the more immediate area. The 20% catchment area for 2022 saw an increase compared to 2021, returning to a similar area of that in 2020.
2019 satisfaction data showed that while Hemel has a strong retail focus, essential and non-essential retail was still taking place within Hemel only 32%-37% of the time. 2020 saw a dramatic increase in essential retail activity of around 17%, with non-essential retail also increasing by 18%. This change is likely due to an increased tendency to shop local and travel less during the pandemic. 2021 continued in a similar fashion, and 2022 to date has seen an increase in essential retail activity and use of public services.
Between July 2021 and April 2022 there was an average of 3 visits to Hemel town centre for each visitor. In November 2021, there was an increase in average visit frequency, potentially linked to the approaching Christmas period. Average visit duration has been increasing slightly as we progress throughout 2022.
Which actions did you take?
So far, the data has been helpful in qualifying the success of some of the larger town centre events. Like the rest of the country, Hemel Hempstead recently celebrated the Queens Platinum Jubilee, where we had a day of activity in a central park adjacent to one of our high streets. Coinciding with the ‘Party in the Park’, footfall in Old Town High Street on Thursday 2nd June 2022 was 149% up from the average Thursday from the previous month. Similarly, footfall in Hemel Hempstead Town Centre was up 224% on the same day when compared with the previous month.
What's next for the Council?
Over the past year we’ve been listening to businesses and residents from across the area to help us develop a forward looking and compelling story for Hemel Hempstead.
We’re doing this so that together we can put the place on the map, highlight the great things that make us special and the opportunities we offer to attract investment, create jobs and attract funding from Government. Alongside the views and opinions of those in the area, the data will help us to make informed decisions on next steps to take in order to achieve the above.
Join the world's fastest growing organisations

Optimise sales forecasting
Sales forecasting
How can I optimise resourcing?
What can my team do to improve sales?
How can we use data to stay ahead of the curve?
Location intelligence trusted by 300+ industry leaders


Increase visibility over sales potential with location insights
New ways to estimate demand
Tap into new opportunities and estimate the demand for specific products or services in different areas with foot traffic patterns and customer behaviour insights.
Stay ahead of economic trends
Identify potential risk factors that could impact property performance or market demand by overlaying mobility data with relevant economic indicators such as GDP growth, unemployment rates, or consumer sentiment.
Optimise staffing and resourcing
Optimise staffing schedules to ensure adequate customer service during high-demand periods with catered foot traffic trends.
Identify methods to increase sales
Leverage trends to understand the levers that need to be pulled to increase sales and beat out the competition.
Maximise campaign impact
Create campaigns that coincide with peak visit times for maximum reach and engagement.
Empower predictive modelling
Leverage predictive models on historical mobility data to forecast changes in foot traffic and customer behaviour for proactive risk management.

200x
Brands
200x
Countries
$25.6Bn
Annual sales
This data enables us to gain insight into a crucial aspect of our business that would otherwise not be possible. Using it enables us to anticipate demand and create more robust planning
Reuben Ayley, Head of Food Service Finance (International)
Successful retail market expansion
Successful retail expansion
What can I do to optimise location selection?
How can data help us drive customer engagement?
How can we ensure successful market penetration?
Location intelligence trusted by 300+ industry leaders
Understand your market
Pinpoint potential locations that align with your target audience and business objectives by identifying areas with high foot traffic, frequent visits, and customer engagement.
Pinpoint your audience
Understand the demographics, behaviours, and preferences of the visitors in the identified areas.
Instantly identify potential markets
Find market potential in trends on foot fall, visit frequency, and economic indicators. Determine if the area has room for growth and if there's a strong demand for your offerings.
Capitalise on market entry timing
Time your retail expansion to coincide with peak visit times and ideal customer behaviour trends, maximising your chances of success.
Drive informed decisions
Leverage foot traffic data and customer behaviours to validate the effectiveness of your new store strategy and make adjustments as needed.
3400
Stores
38
Countries
$12.5Bn
Annual sales
Huq’s catchment insights allows JD to more accurately assess the impact of the wider retail catchment on the sales potential of new store opportunities
Alastair Browne, JD Group Head of Site Research & Strategic Insight
Speeding up economic development
Successful local economies
How can I ensure we make the correct investments?
How can data help us to attract new businesses?
How can we work to create thriving, sustainable towns?
Location intelligence trusted by 300+ industry leaders
Targeted infrastructure investment
Optimise infrastructure development, such as transportation hubs and public amenities, to support economic growth in those areas.
Attract more customers
Identify seasonal trends that attract visitors with targeted activities to align with these trends and optimise your offerings and promotions.
Understand customer engagement
Monitor how placemaking initiatives or newly leased spaces impact customer behaviour and leverage location insights to make adjustments to your strategies.
Enhance visitor experiences
Develop informed strategies to enhance customer experiences, such as optimising area hospitality and supporting local businesses.
Business attraction and support
Attract businesses that align with local customer behaviours and provide support to industries that drive foot traffic.
Identify new workforce trends
Leverage location insights to pinpoint evolving commute patterns and understand where and when residents travel for work.
Optimise your portfolio
Monitor and report on the performance of your investments using foot traffic trends, customer engagement, and visit patterns.
985k
Population
23.8Bn
£GDP
187
Stations & hubs
Colleagues in local government now use outputs from Huq’s data for travel insights across the Glasgow City region. Uses include origin-destination analyses, and learning what draws people to local neighbourhoods
Dr Andrew McHugh, Senior Data Science Manager, UBDC / University of Glasgow
4.8Bn
GBP Influence
3
Gov Departments
8
Uni partners
Huq’s data is real-time and that makes 3DI’s data even stronger and more valuable. Both local and central government bodies will be able to use it to get a clearer picture of the real economic impacts of Covid-19 across the country
Benjamin Lucas (PhD, FHEA), Managing Director at 3DI