Find how long people spend in your sites
Get accurate visitor dwell-time made for decision makers in Local Government, Retail, Real Estate, and Finance teams.
Book a demo
Dwell-time provides leading indicators on the performance of the local economy
- Store Planner, MNC retailer with 3,400 stores
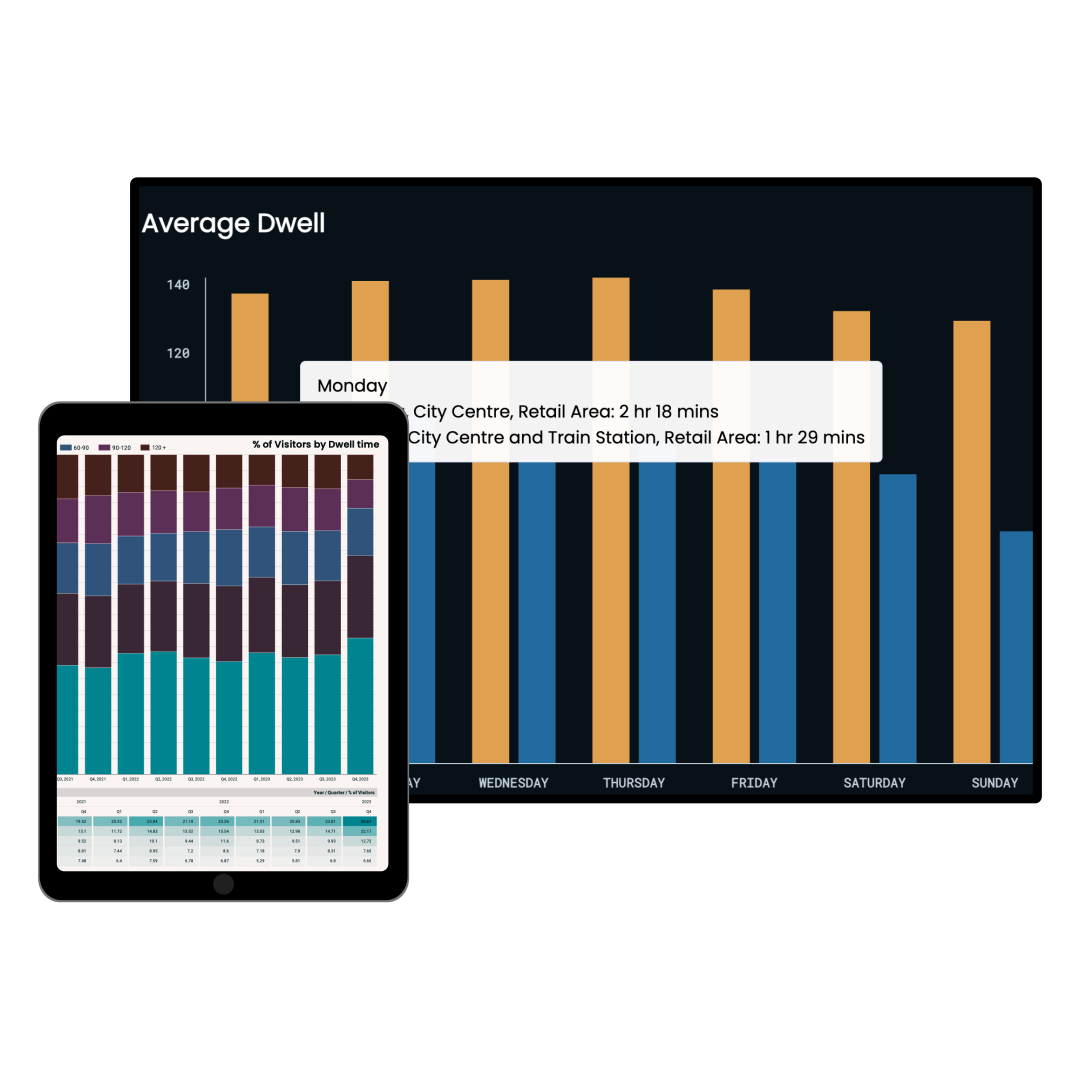
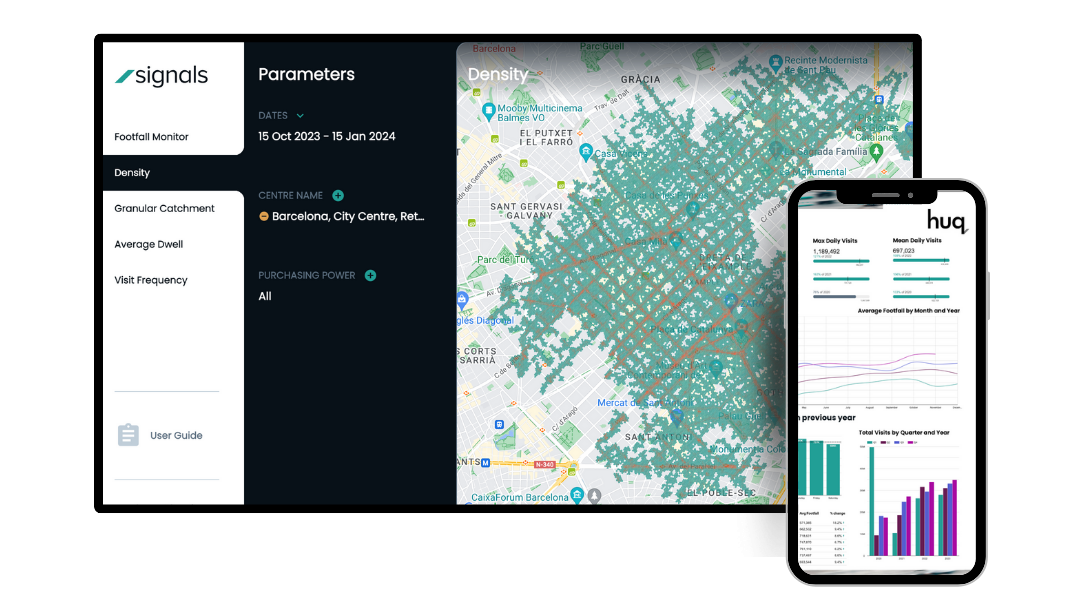
Dwell time monitoring
How long do visitors spend in this place?
Dwell-time is a measure of the average time that visitors spend within an area per trip. Get the output in minutes, updated everywhere on a daily basis.
- Instant reports
- No hardware needed
- Global coverage
- Any place, any size
- Demographic visibility
- 5+ years' history
Explore use cases
Learn why Huq’s data is trusted by over 300+ industry leaders
Getting started is easy
Get instant access to insights worldwide.
Speak to our mobility experts to get tailored insights that ensure your reach your goals.
Book a demo