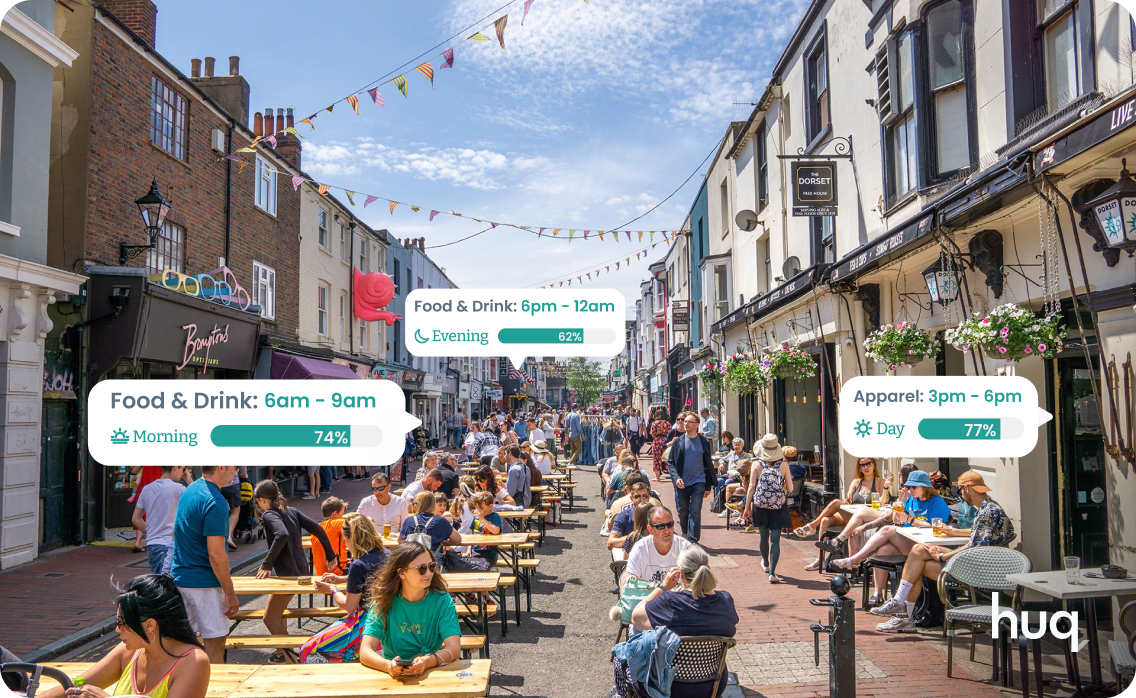
Daypart Footfall
Know when customers are most active to tailor your offering for their needs
Build certainty into every decision with real insight into daypart footfall behaviour.
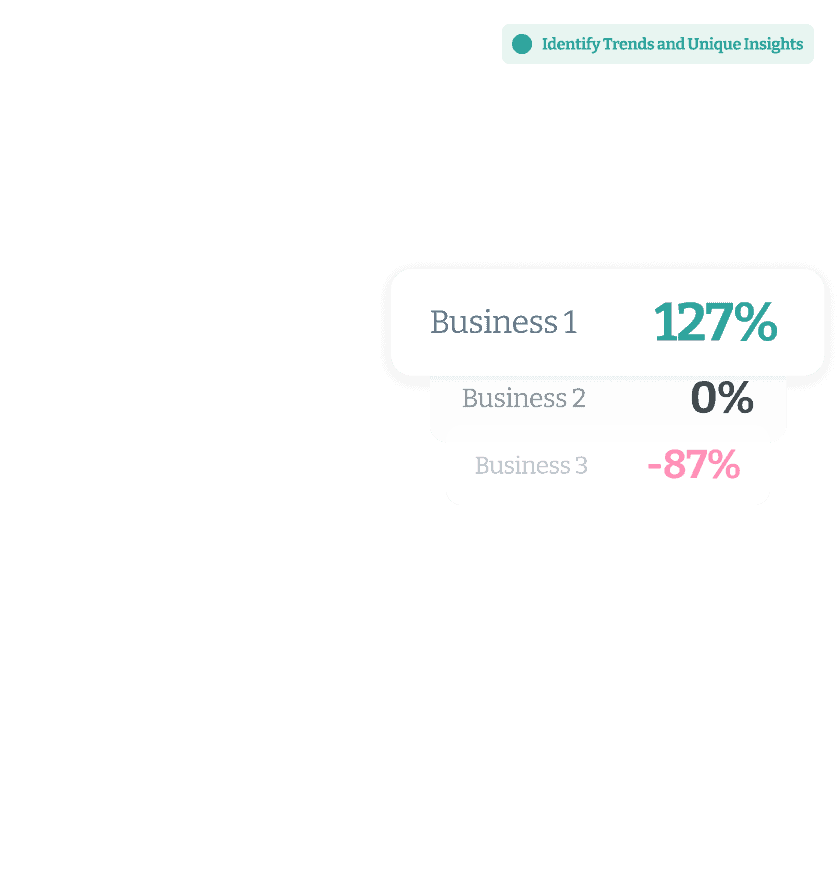
Unlock insights: where footfall meets time
Gain insight into the footfall dynamics and timestamps of your visitors so you can see exactly where consumers are going and how long they’re visiting.
By understanding how and when your customers move in an area, organisations can leverage personalisation for a targeted approach to site selection and investment opportunities.
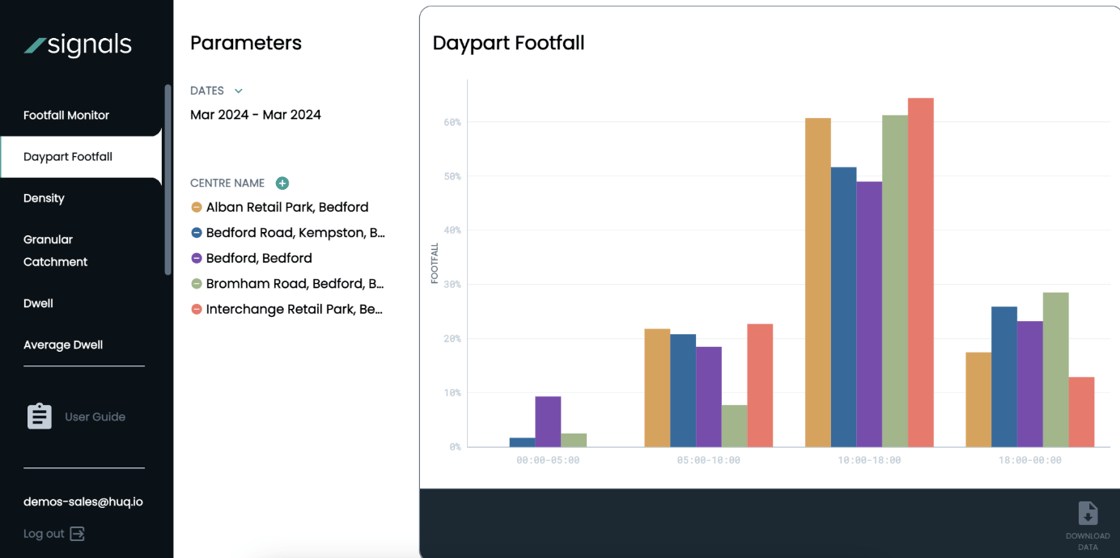
What data will you be able to see?
Daypart timestamps

Footfall count

Daypart value %
See how daypart data gives you the confidence to make data-led decisions effectively

Retail
Understand your retail performance against customer engagement and visitation
- Improve customer loyalty by matching peak dayparts with your product matrix to attract the right footfall and maximise revenue potential for your stores.
- Tailor your marketing strategy to increase ATV and drive revenue by matching your value proposition matrix to your customer profiles.
- Improve resource allocation by identifying peak periods and aligning store opening hours, labour rotas and inventory levels to actual customer behaviour
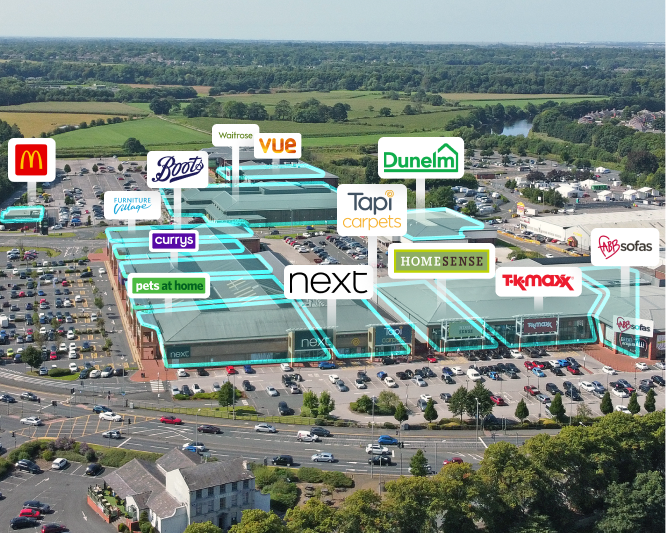
Real Estate
Unlock the true potential of your real estate assets by using Daypart Footfall trends to define space utilisation and tenant mix strategies
- Profile asset-linked footfall to tailor space allocation in order to focus your tenant mix strategy.
- Increase customer loyalty and reach by mapping the right product offering in the right locations.
- Support lease negotiations by benchmarking actual peak footfall to increase rental rates and ROI.
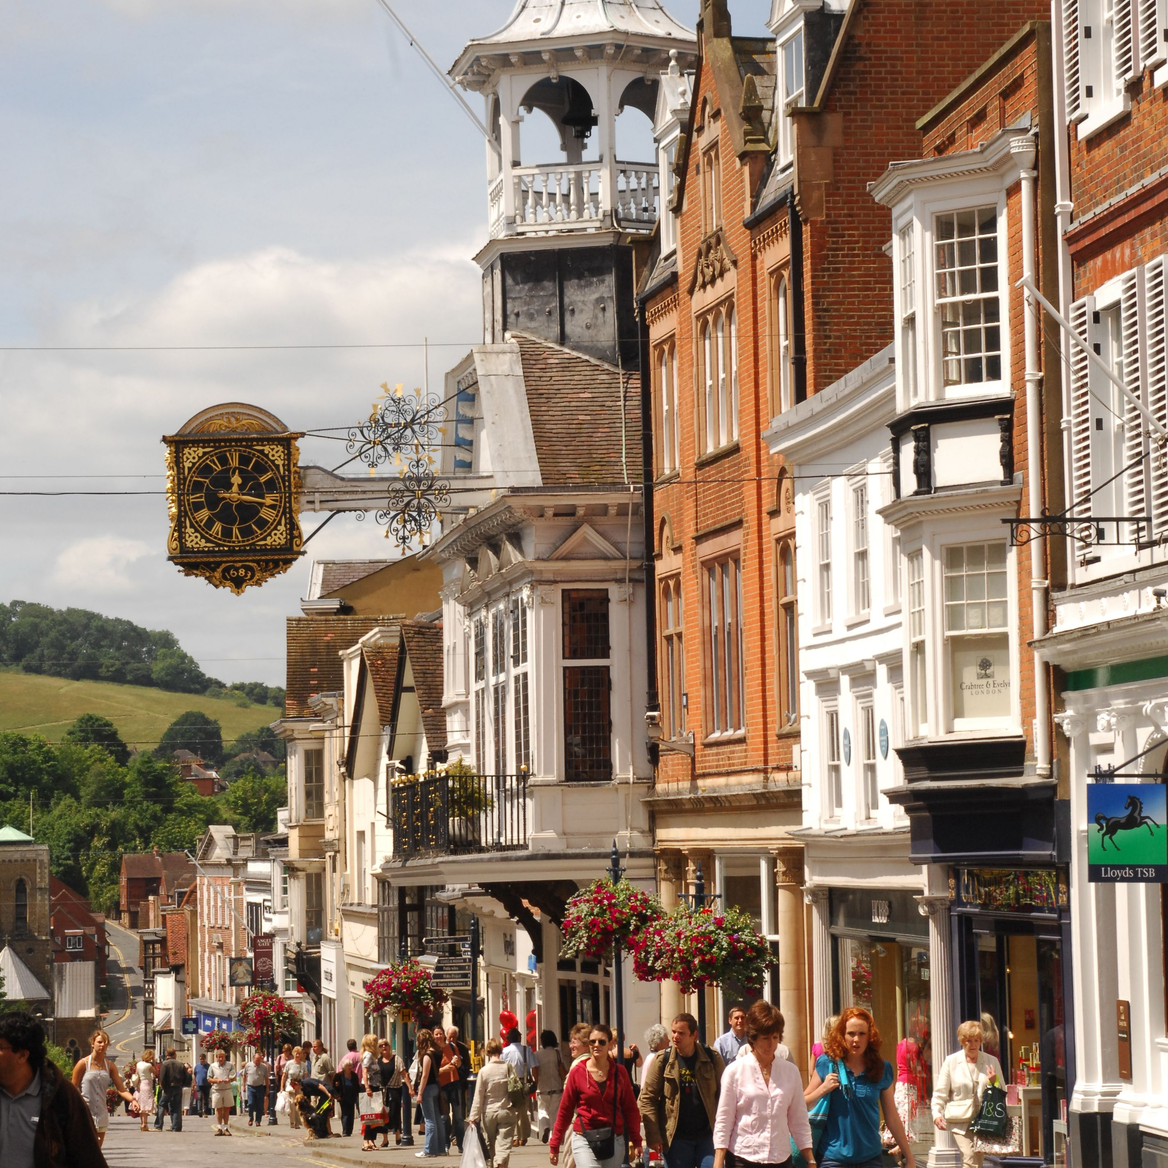
Public Sector
Guide urban development strategies that meets the needs of your communities
- Improve urban planning and resource allocation by aligning public services to the needs and dynamics of your community.
- Identify the best times for community events to maximise event attendance and boost the engagement among the public.
- Understand peak demand for transportation services to prioritise optimal routes planning.
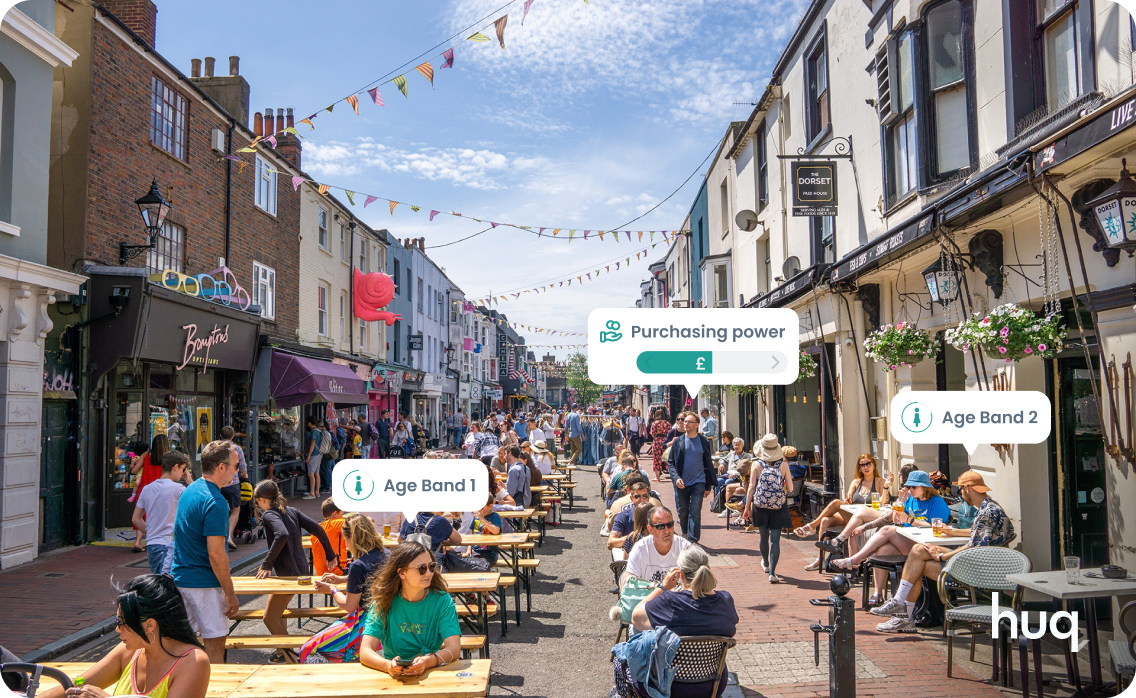
Demographics
Find out who is visiting your locations
Build certainty into every decision with real insight into visitor profiles and footfall behaviour.
Understand your customers
Gain an in-depth understanding of your visitors and their behaviour patterns with Demographic insight to map who’s visiting your sites and how they move and spend.
By understanding who your customers are, their purchasing power and behavioural patterns, organisations can tailor their product offering and tenant mix strategy to their visitor profiles to maximise ROI and asset performance with the right brand offering.
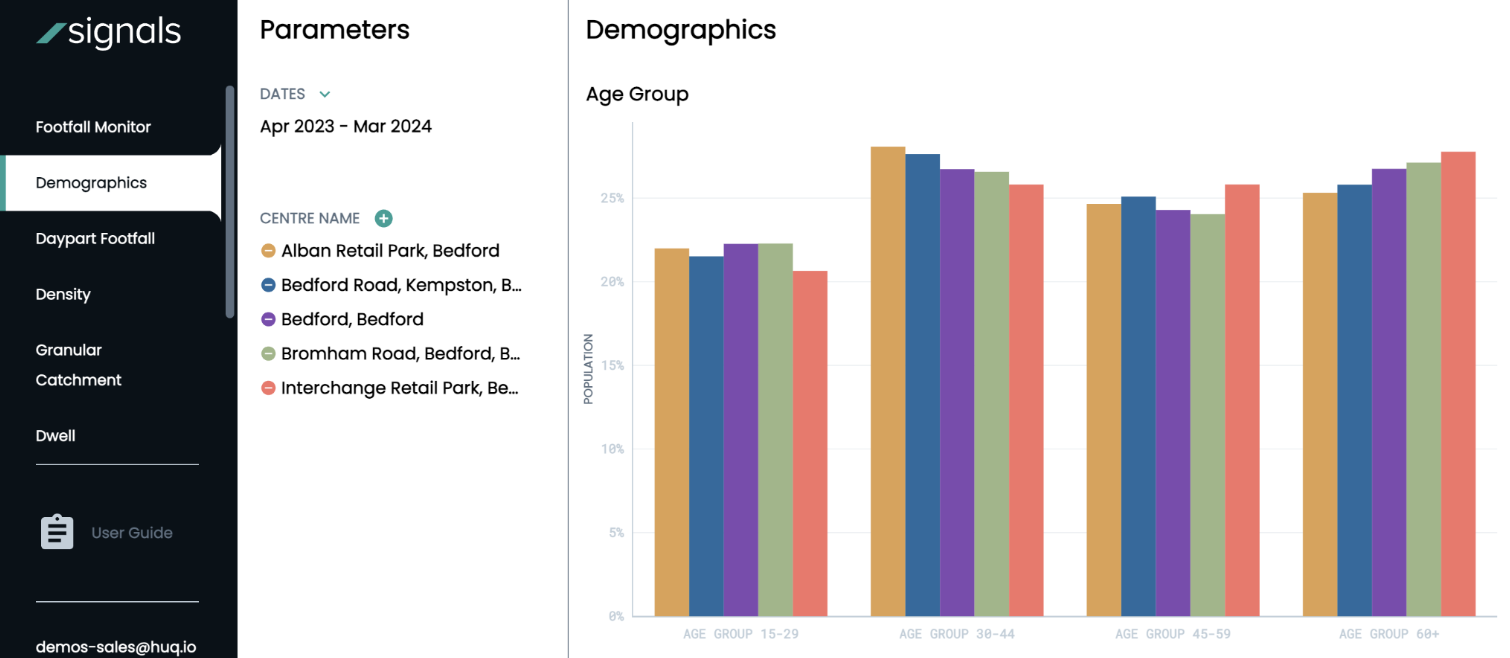
What Demographic data is included?
Age bands:
15 - 60+
Purchasing power

Gender split
See how Demographic data gives you the confidence to make data-led decisions effectively

Retail
Increase the impact and ROI of marketing campaigns by understanding your visitor profile
- Maximise sales and improve customer satisfaction by tailoring your product offering to better meet the needs and preferences of your customers.
- Tailor your marketing strategy to increase ATV and drive revenue by matching your value proposition matrix to your customer profiles.
- Increase customer engagement and reach by mapping the right brands to your visitors.
Real Estate
Attract the right tenant mix for your visitors
- Identify the right mix of tenants for your visitors to increase footfall, property value and tenant retention.
- Align demand and supply dynamics more effectively in order to reduce risk of site selection.
- Support rental valuations by understanding how footfall and visitor behavioural patters vary across and within your asset portfolio.
Public Sector
Understand tourist and initiative-linked footfall to develop prosperous communities
- Quantify the economic benefits of public sector actions and guide policymaking with footfall and visitor profile insights for local government and BIDs.
- Prioritise infrastructure investments and urban planning to meet the needs and preferences of the community.
- Enhance public engagement with the community by mapping visitor profiles to locations for events and activities that resonate with your actual and target demographic.
Spend Data with Mastercard®
Unlocking insights: where geo-spend meets footfall
Build certainty into every decision with real insight into geo-spend and footfall behaviour.
Make geo-spend and footfall your leading indicators for data-led decisions
Integrating Mastercard’s aggregated and anonymised geo-based insights with Huq’s location insights lets you see exactly where consumers are going, how long they’re visiting and the geo-spend category dynamics of the location they’re in.
By understanding how your customers move and spend in an area, organisations can maximise revenue potential, optimise portfolios and identify development initiatives.
What data will you be able to see?
Indexed transaction data from 2019
Spend data across the UK including CDRC retail centres
Total spend index
Total transaction index

Total unique cards index
Spend by account index
Spend by transaction index
Transactions per account index
See how geo-spend data gives you the confidence to make data-led decisions effectively
Retail
Understand your retail performance against the wider market through footfall and geo-spend tracking
- Identify locations which have the right footfall and geo-spend characteristics to maximise revenue potential for your stores
- Truly understand your month-on-month performance by tracking total footfall and geo-spend across your store portfolio
- Optimise marketing and pricing strategies by knowing the customer and geo-spend profile and retail centre dynamics around your stores
Real Estate
Unlock the true potential of your real estate assets by using geo-spend and footfall trends to define space utilisation and tenant mix strategies
- Profile asset-linked footfall and geo-spend to identify brand repertoire in order to focus your tenant mix strategy
- Track total geo-spend and benchmark to other assets in order to understand relative asset performance
- Support rental valuations by understanding how footfall and geo-spend vary across and within your asset

Public Sector
Understand tourist and initiative-linked footfall and geo spend to develop prosperous communities
- Quantify the economic benefits of public sector actions and guide policymaking with footfall and geo-spend insights for local government and BIDs
- Prioritise infrastructure investments based on footfall dynamics and geo-spend levels
Footfall Data
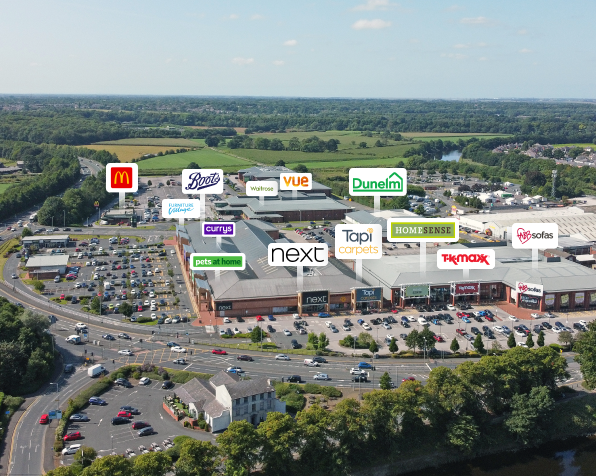
How many people visit my location?
Get the leading footfall counting system built for decision makers in Local Government, Retail, Real Estate, and Finance teams.
Footfall monitoring is the single most important insight we use to manage places
- Head of Economic Development
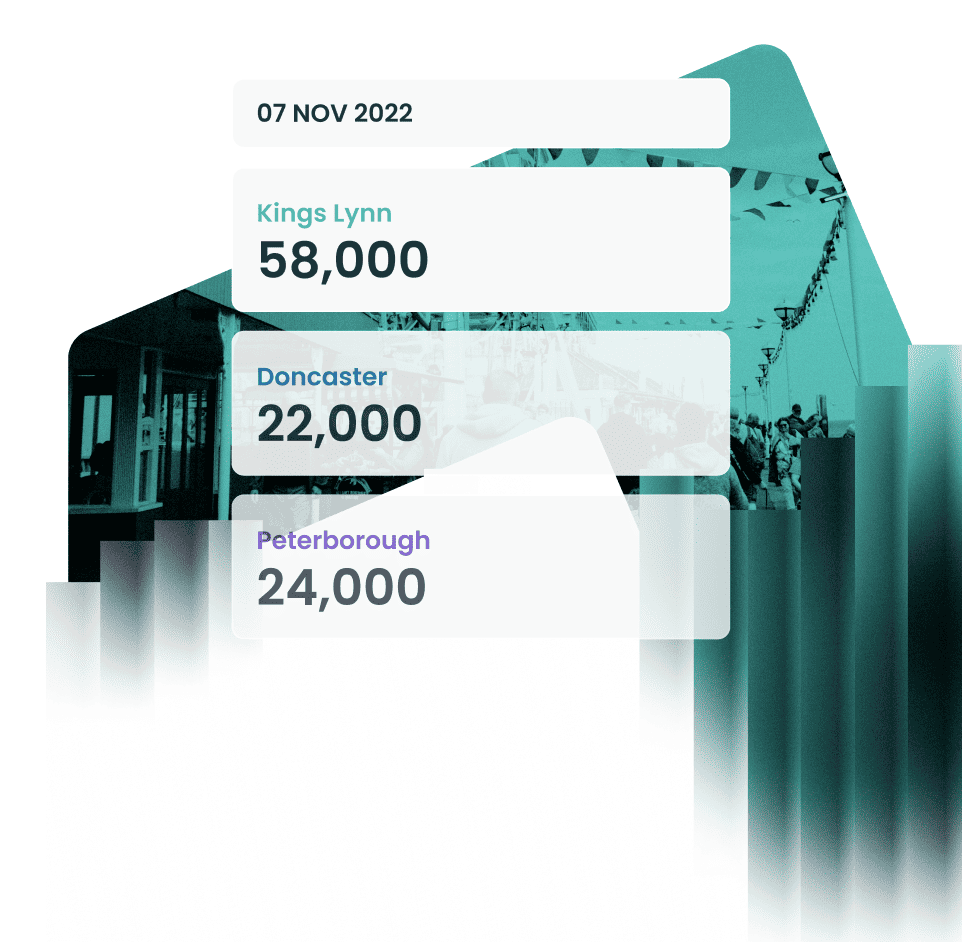
Accurate footfall monitoring
How many people are in this place?
Learn how many unique visitors are present in the places you manage, and how that changes with time. Get near-real time insights without the double counting!
- Daily footfall counts
- No hardware needed
- Global benchmarking
- Instant insights
- Demographic visibility
- 5+ years' history
Sign up for your free sample report
Interested in seeing how your business could benefit from footfall data? Let us know which locations you’re interested in and we’ll send you your free sample reports.
Learn why Huq’s data is trusted by over 300+ industry leaders
Getting started is easy
Get instant access to footfall insights, worldwide.
Speak to our location experts to get tailored insights that ensure your reach your goals.
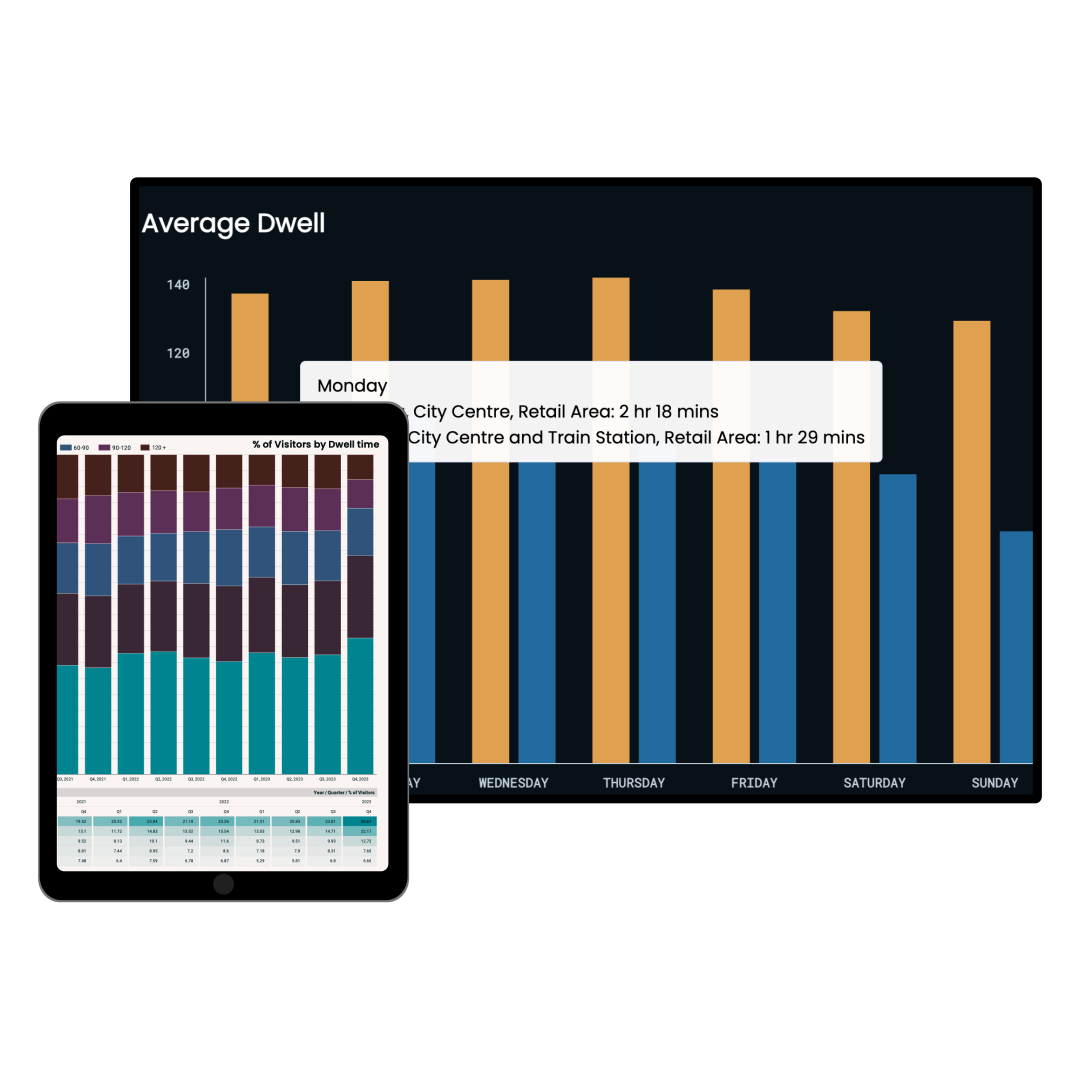
Dwell time data
Find how long people spend in your sites
Get accurate visitor dwell-time made for decision makers in Local Government, Retail, Real Estate, and Finance teams.
Dwell-time provides leading indicators on the performance of the local economy
- Store Planner, MNC retailer with 3,400 stores
Dwell time monitoring
How long do visitors spend in this place?
Dwell-time is a measure of the average time that visitors spend within an area per trip. Get the output in minutes, updated everywhere on a daily basis.
- Instant reports
- No hardware needed
- Global coverage
- Any place, any size
- Demographic visibility
- 5+ years' history
Learn why Huq’s data is trusted by over 300+ industry leaders
Getting started is easy
Get instant access to insights worldwide.
Speak to our mobility experts to get tailored insights that ensure your reach your goals.

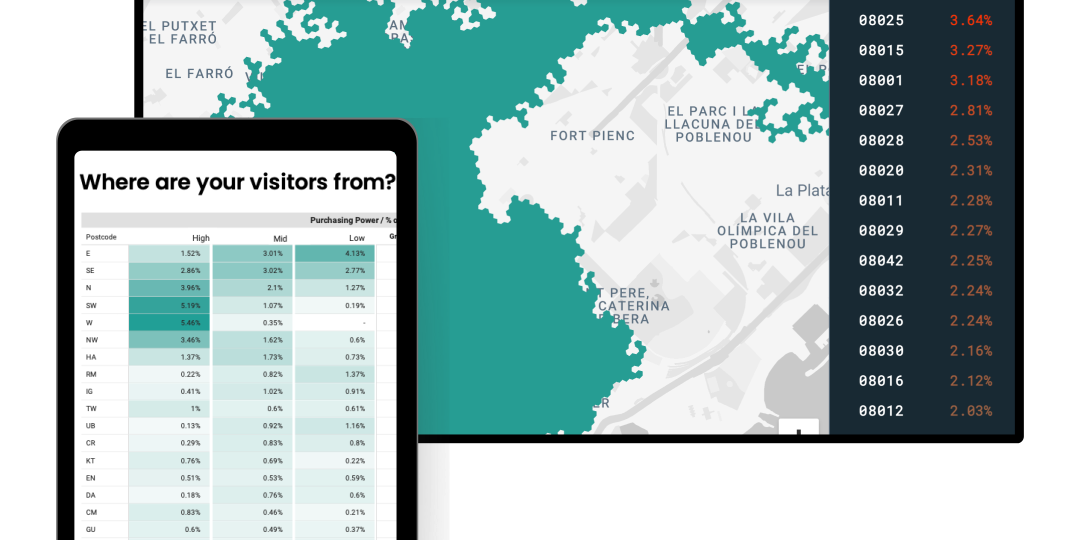
Granular catchment data
Where do visitors originate and where do they go?
Discover where visitors to places travel in from. Use Granular catchment insights to enrich your footfall data!
This granular insight allows us to quantify how many visitors come from which postcodes
- Head of Economic Development
Accurate origin and destination monitoring
What is Granular Catchment?
Granular Catchment is the first ever product that quantifies number of visitors to specific destinations according to where they travel from.
- Postcode-level granularity
- Footfall insight enrichment
- Multi-area monitoring
- Hardware-free solution
- Global coverage
- 5+ years' history
Learn why Huq’s data is trusted by over 300+ industry leaders
Getting started is easy
Get instant access to insights worldwide.
Speak to our mobility experts to get tailored insights that ensure your reach your goals.
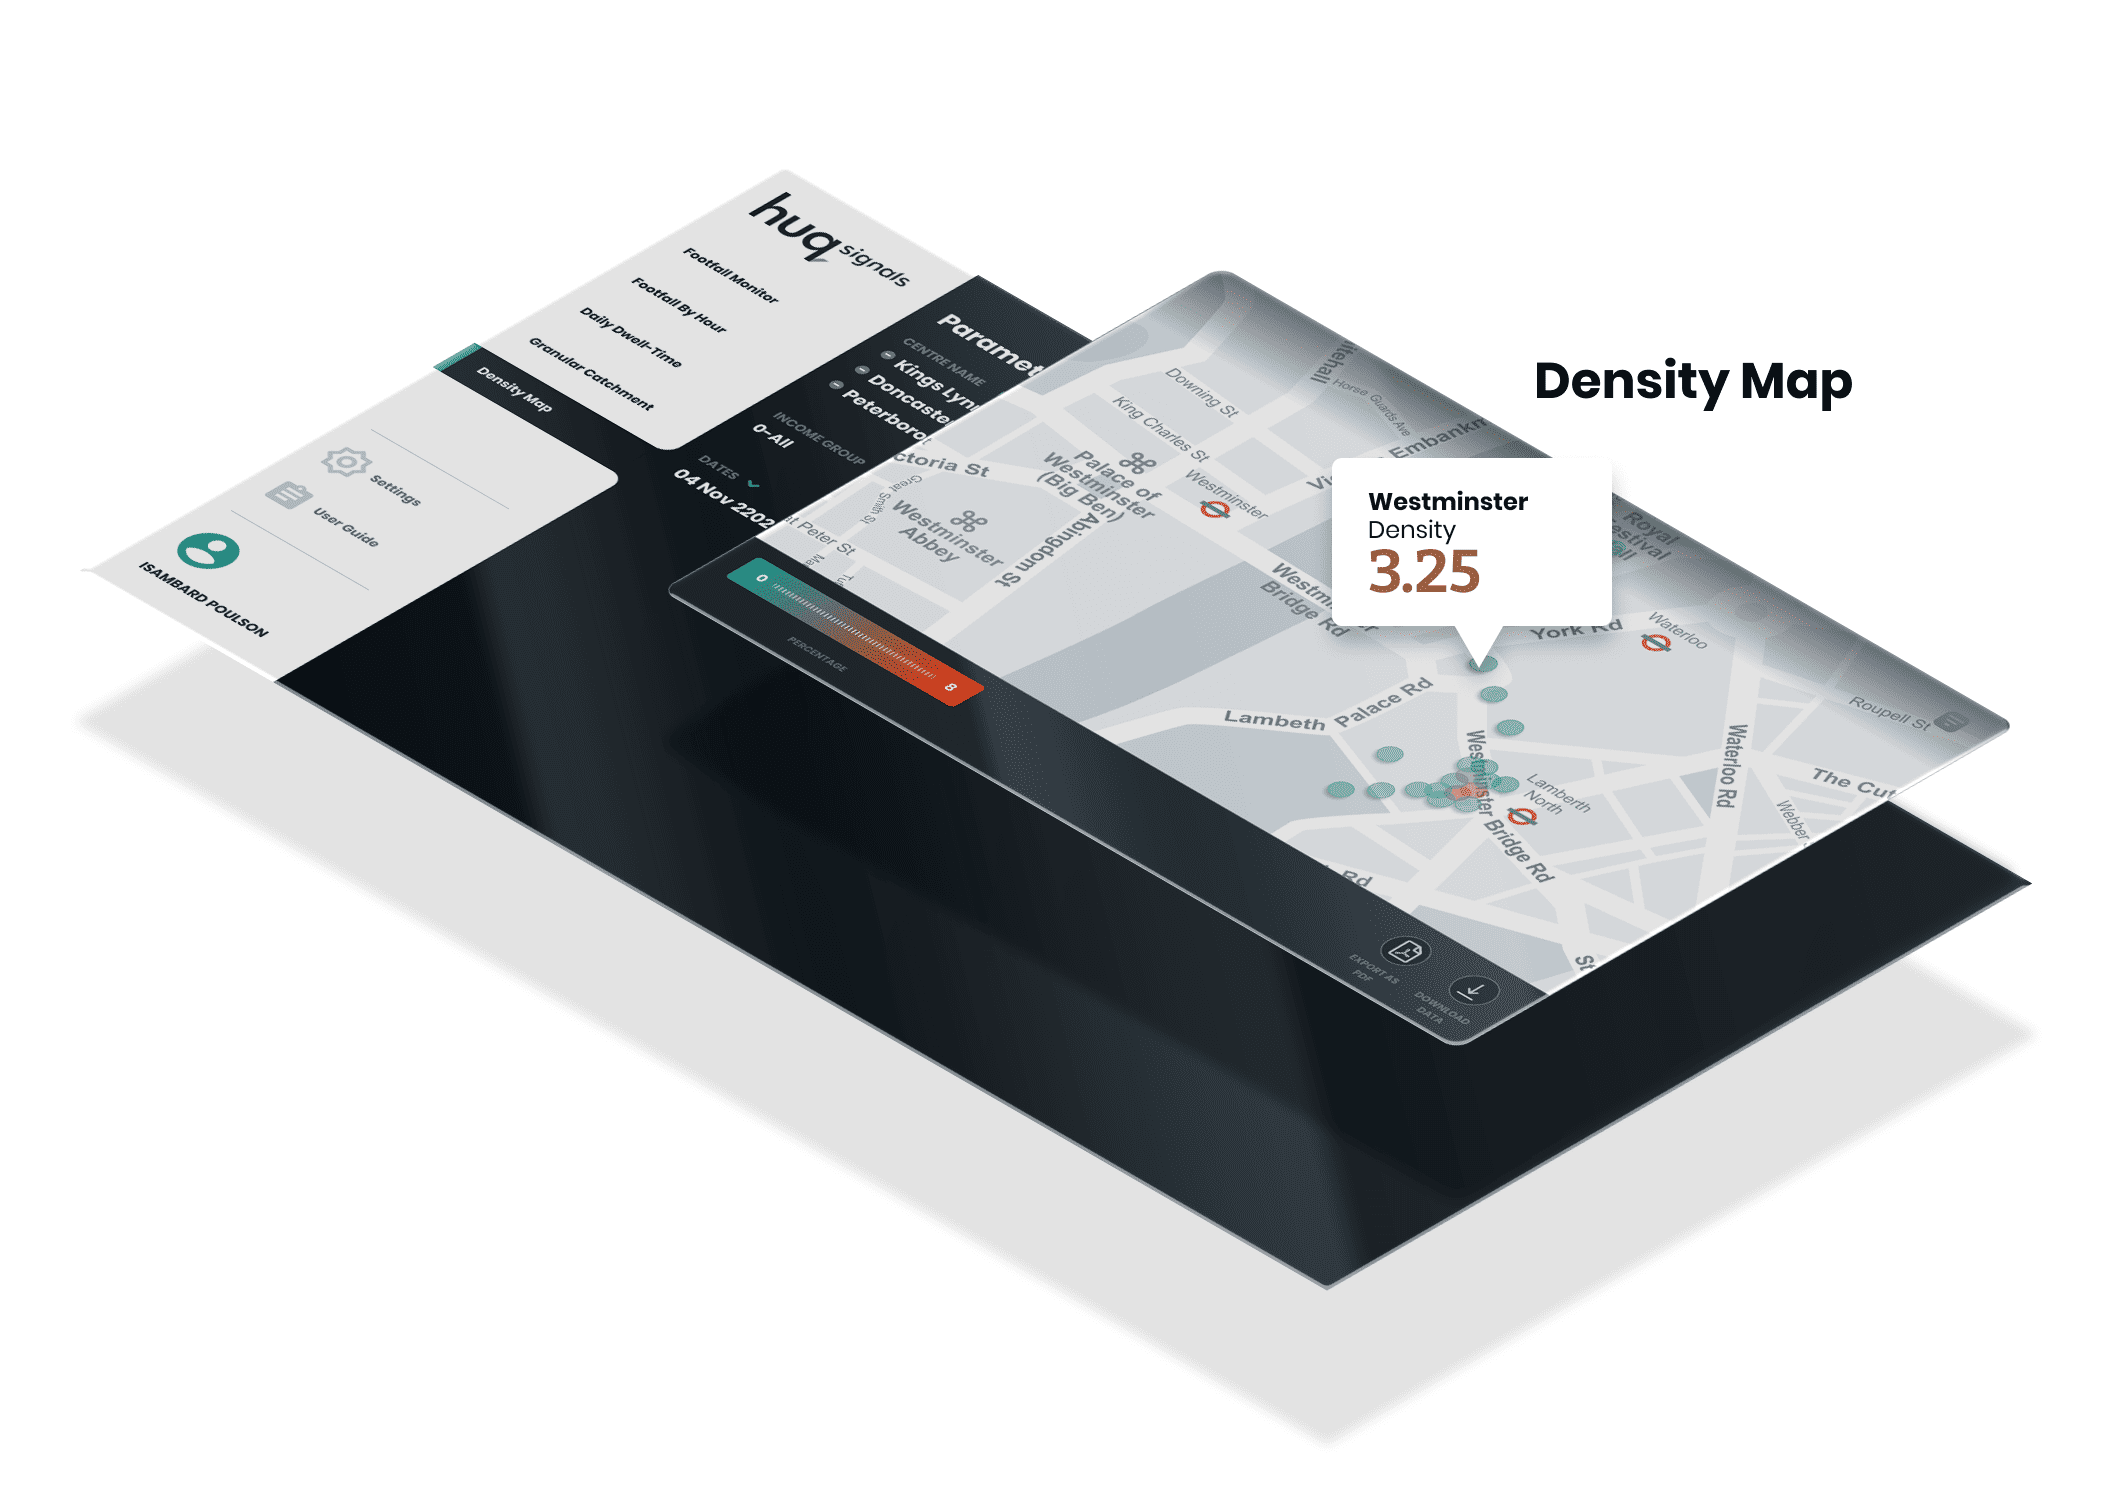
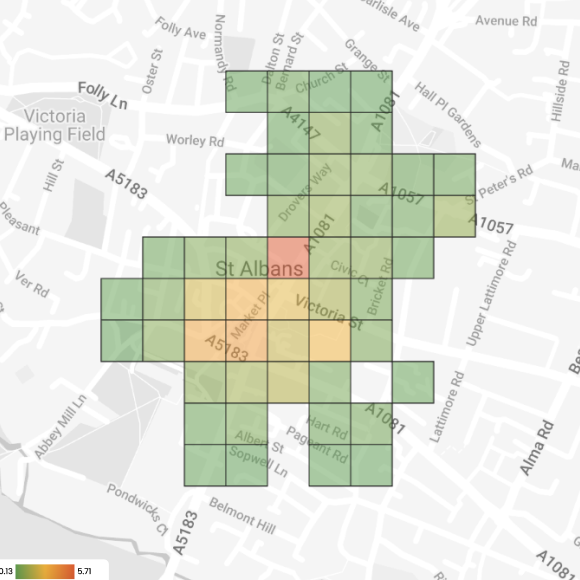
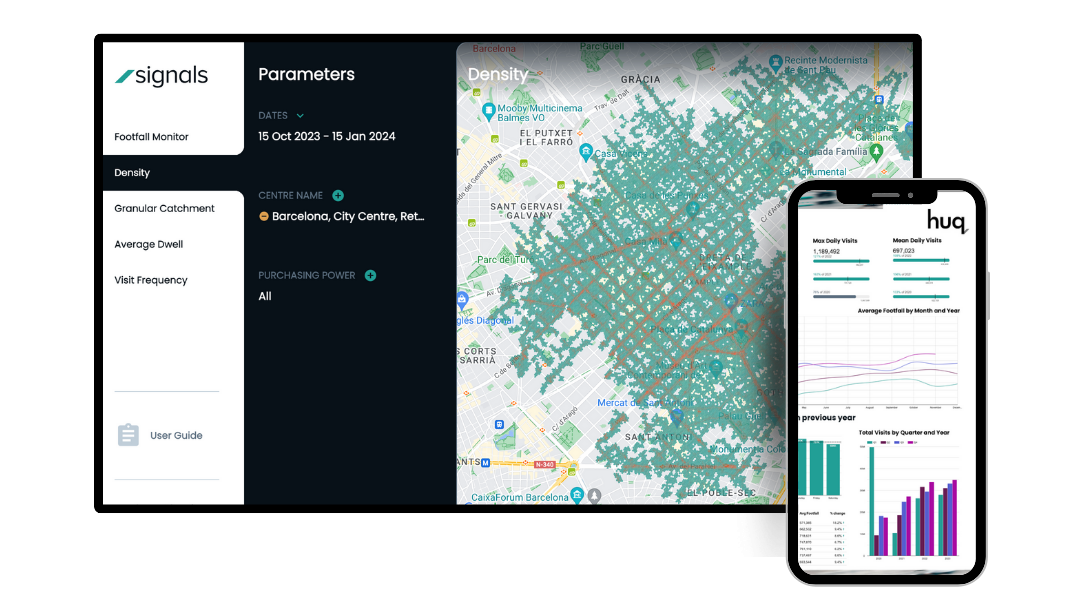
Density
Discover hotspots and dead zones in any place
Find the most popular streets and parts of towns with visitor density monitor to optimise your strategies.
Density monitoring helps us find the most used parts of our towns
- Head of Economic Development
Live occupancy monitoring
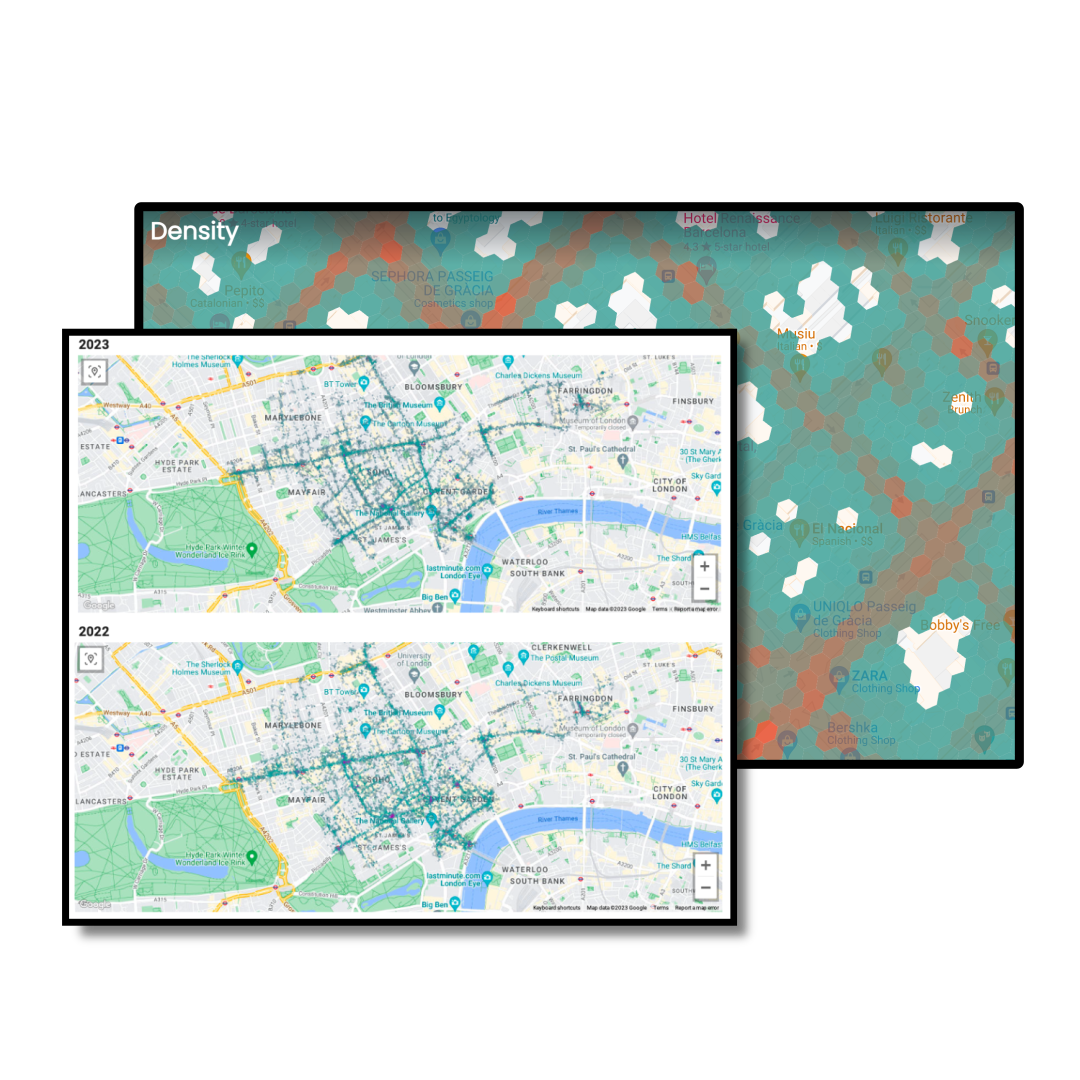
What is density monitoring?
Density monitoring is a visualisation of pedestrian flows and hotspots across whole towns, streets and centres. Determine the places that attract most visitors to the areas you manage.
- Daily heat-map outputs
- Granularity to 10m
- Get score benchmarks
- Multi-area measurement
- Download reports to PDF
- 5+ years' history
Find the most valuable retail opportunities for within a centre or street. Learn how to optimise space investments based on usage.
Sign up for your free sample report
Interested in seeing how your business could benefit from footfall data? Let us know which locations you’re interested in and we’ll send you your free sample reports.
Learn why Huq’s data is trusted by over 300+ industry leaders
Getting started is easy
Get instant access to insights worldwide.
Speak to our mobility experts to get tailored insights that ensure your reach your goals.

Research
Research & insights
Browse the articles below for thought leadership, data-driven insights and reports published by Huq using its own primary data.
Insights


Data Quality
Big decisions require reliable data
Huq’s insights platform is built to provide the most accurate reflection of performance across the places you care about.
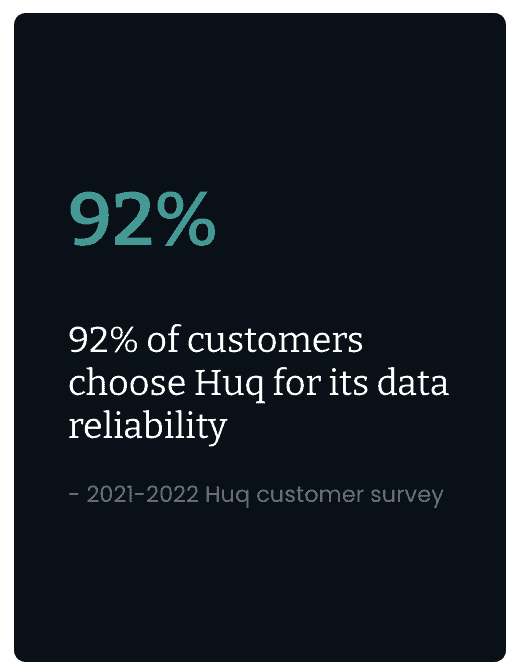
92%
of customers chose Huq for its data reliability
* 2022-2023 Huq customer survey

Why does data quality matter?
When you're basing decisions on evidence, that information needs to be right. Why else have it? Poor evidence can lead to misuse of funds and inefficiencies. It's vital to get it right.
How does Huq do it differently?
Huq is the only measurement provider to put reliability at the heart of what it does. Our platform owns the end-to-end measurement process from collection to processing, storage and publication. Every element of our systems are known, qualified and optimised for accuracy. And we test it too!
1st party data collection
Huq collects and processes all data on a first-party basis. This produces verified accuracy in an entirely transparent system.
Precision-based approach
Huq's SDK (GPS) Data is accurate to 10m, more granular than any other method of data gathering in the market.
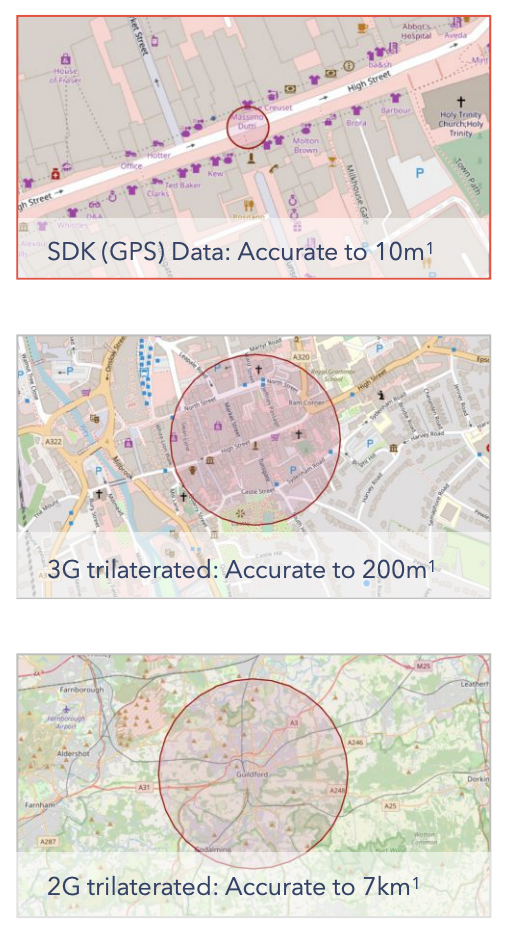
A fully-integrated mobility data platform
Huq's mobility data platform is unique in that all data, processing and reporting is carried out on a first-party basis. This enables Huq to provide the most accurate measurement data in an entirely transparent system.
#1
Huq is the only place insights platform to verify its data
- 2022 analysis of computer platforms
5yrs
Record history available to verify insights with
- Full nationwide coverage going back to 2019
A data collection and processing method that is built for quality

First-party insights
Huq uses observational data that it fully understands - and that means collecting it directly using our proprietary, purpose-built technology.

Unique methodology
Our processing architecture uses multiple sources to validate and improve 1Bn+ observations daily using the best technologies available.

Academically verified
Leading academic, public and commercial institutions to continuously verify the accuracy of Huq's insights using scientific methods.

Used by 100+ councils
Huq’s insights are trusted by local and central government to inform policy decisions; to allocate and disperse £Billions in public funding.
Learn why Huq’s data is trusted by over 300+ industry leaders

A platform built for reliability
Platform security
Huq operates a strict closed data ecosystem policy. Observational data is transformed into output products internally and is never exposed outside of its environment.
- Built on leading platforms
- High technical resilience
- Secure access policies
- Distributed data sources
- Encrypted data storage
- Regular penetration tests
- CIPP/E & CIPM qualified
- ISO27001/2 certification
- GDPR & CCPA compliant
- No PII data used or stored
- SAR response processes
- Do Not Track' compliant
Case studies
Trusted by 300+ industry leaders
Real-world examples showcasing the impact of Huq’s solutions on various industries and businesses.
Case studies
Experts agree
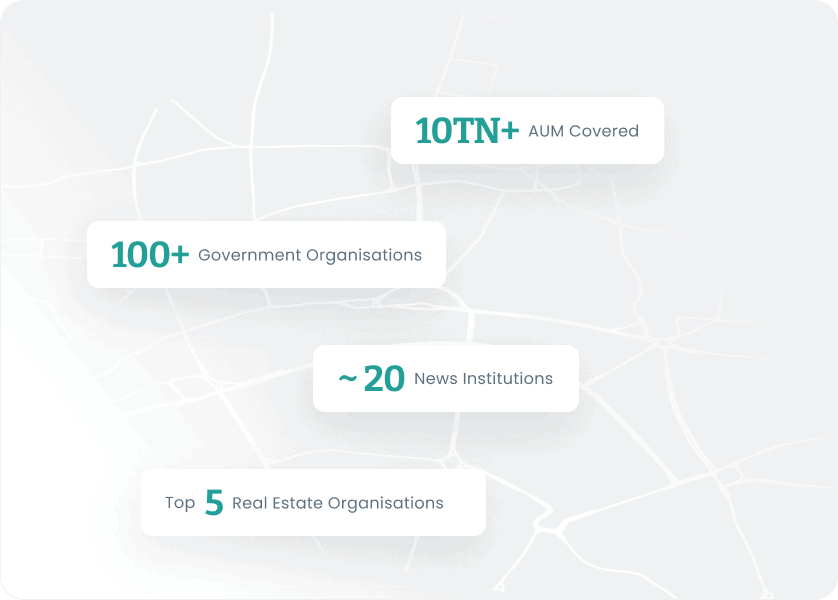
Trusted By:
- 100+ Government Organisations
- Top 5 Real Estate Organisations
- Major Retailers
- 10 Trillion+ AUM Covered
- ~ 20 News Institutions
- Major University Research Teams
Used by the leading researchers in location intelligence
"Through our work we have established that Huq’s UK mobility data set provides a robust and accurate means to understand real world behaviours across the UK and their spatial economic impact. The Huq data is extremely detailed and available with a very short time lag, facilitating both granular and up-to-date analysis of mobility patterns."