The Welcome Back Fund (WBF) provided UK council funding to help encourage visitors back to high streets and town centres in the wake of the Covid-19 pandemic. In this report rank councils by increases in catchment area size and ask – how successful was it?
The Welcome Back Fund (WBF)
The Welcome Back Fund (WBF) was announced in March 2021 as an extension to the Reopening High Streets Safely Fund (RHSSF). These funds enabled councils to invest in post-Covid recovery and to stimulate economic prosperity, especially through retail and leisure. The implementation period – the period over which councils are required to dispose of WBF funding – ran up until March 31st 2022.
In this report we look back at councils’ performance levels at the time of the Fund’s announcement and compare them to where they ended up in the three months to March 31s. The results are used to rank the best performing councils during the WBF campaign period across four key metrics: footfall, catchment, dwell-time and visit frequency.
Catchment area performance
Why is Catchment important? Catchment areas represent the dominant locations that visitors to towns, places and centres travel from. Use Catchment Areas to estimate the total addressable market local services based on catchment population. Catchments also provides the link to demographics and the means to characterise visitor populations by income or other attributes.
How Huq does it: Catchment maps use Huq’s classification of visitors’ approximate residential neighbourhoods, and uses that as a reference point to determine the average catchments for places. The same classification allows Huq to cross-reference visitors with authoritative demographic datasets such as the Census in order to inherit their estimated income values.
Catchment area increase during WBF
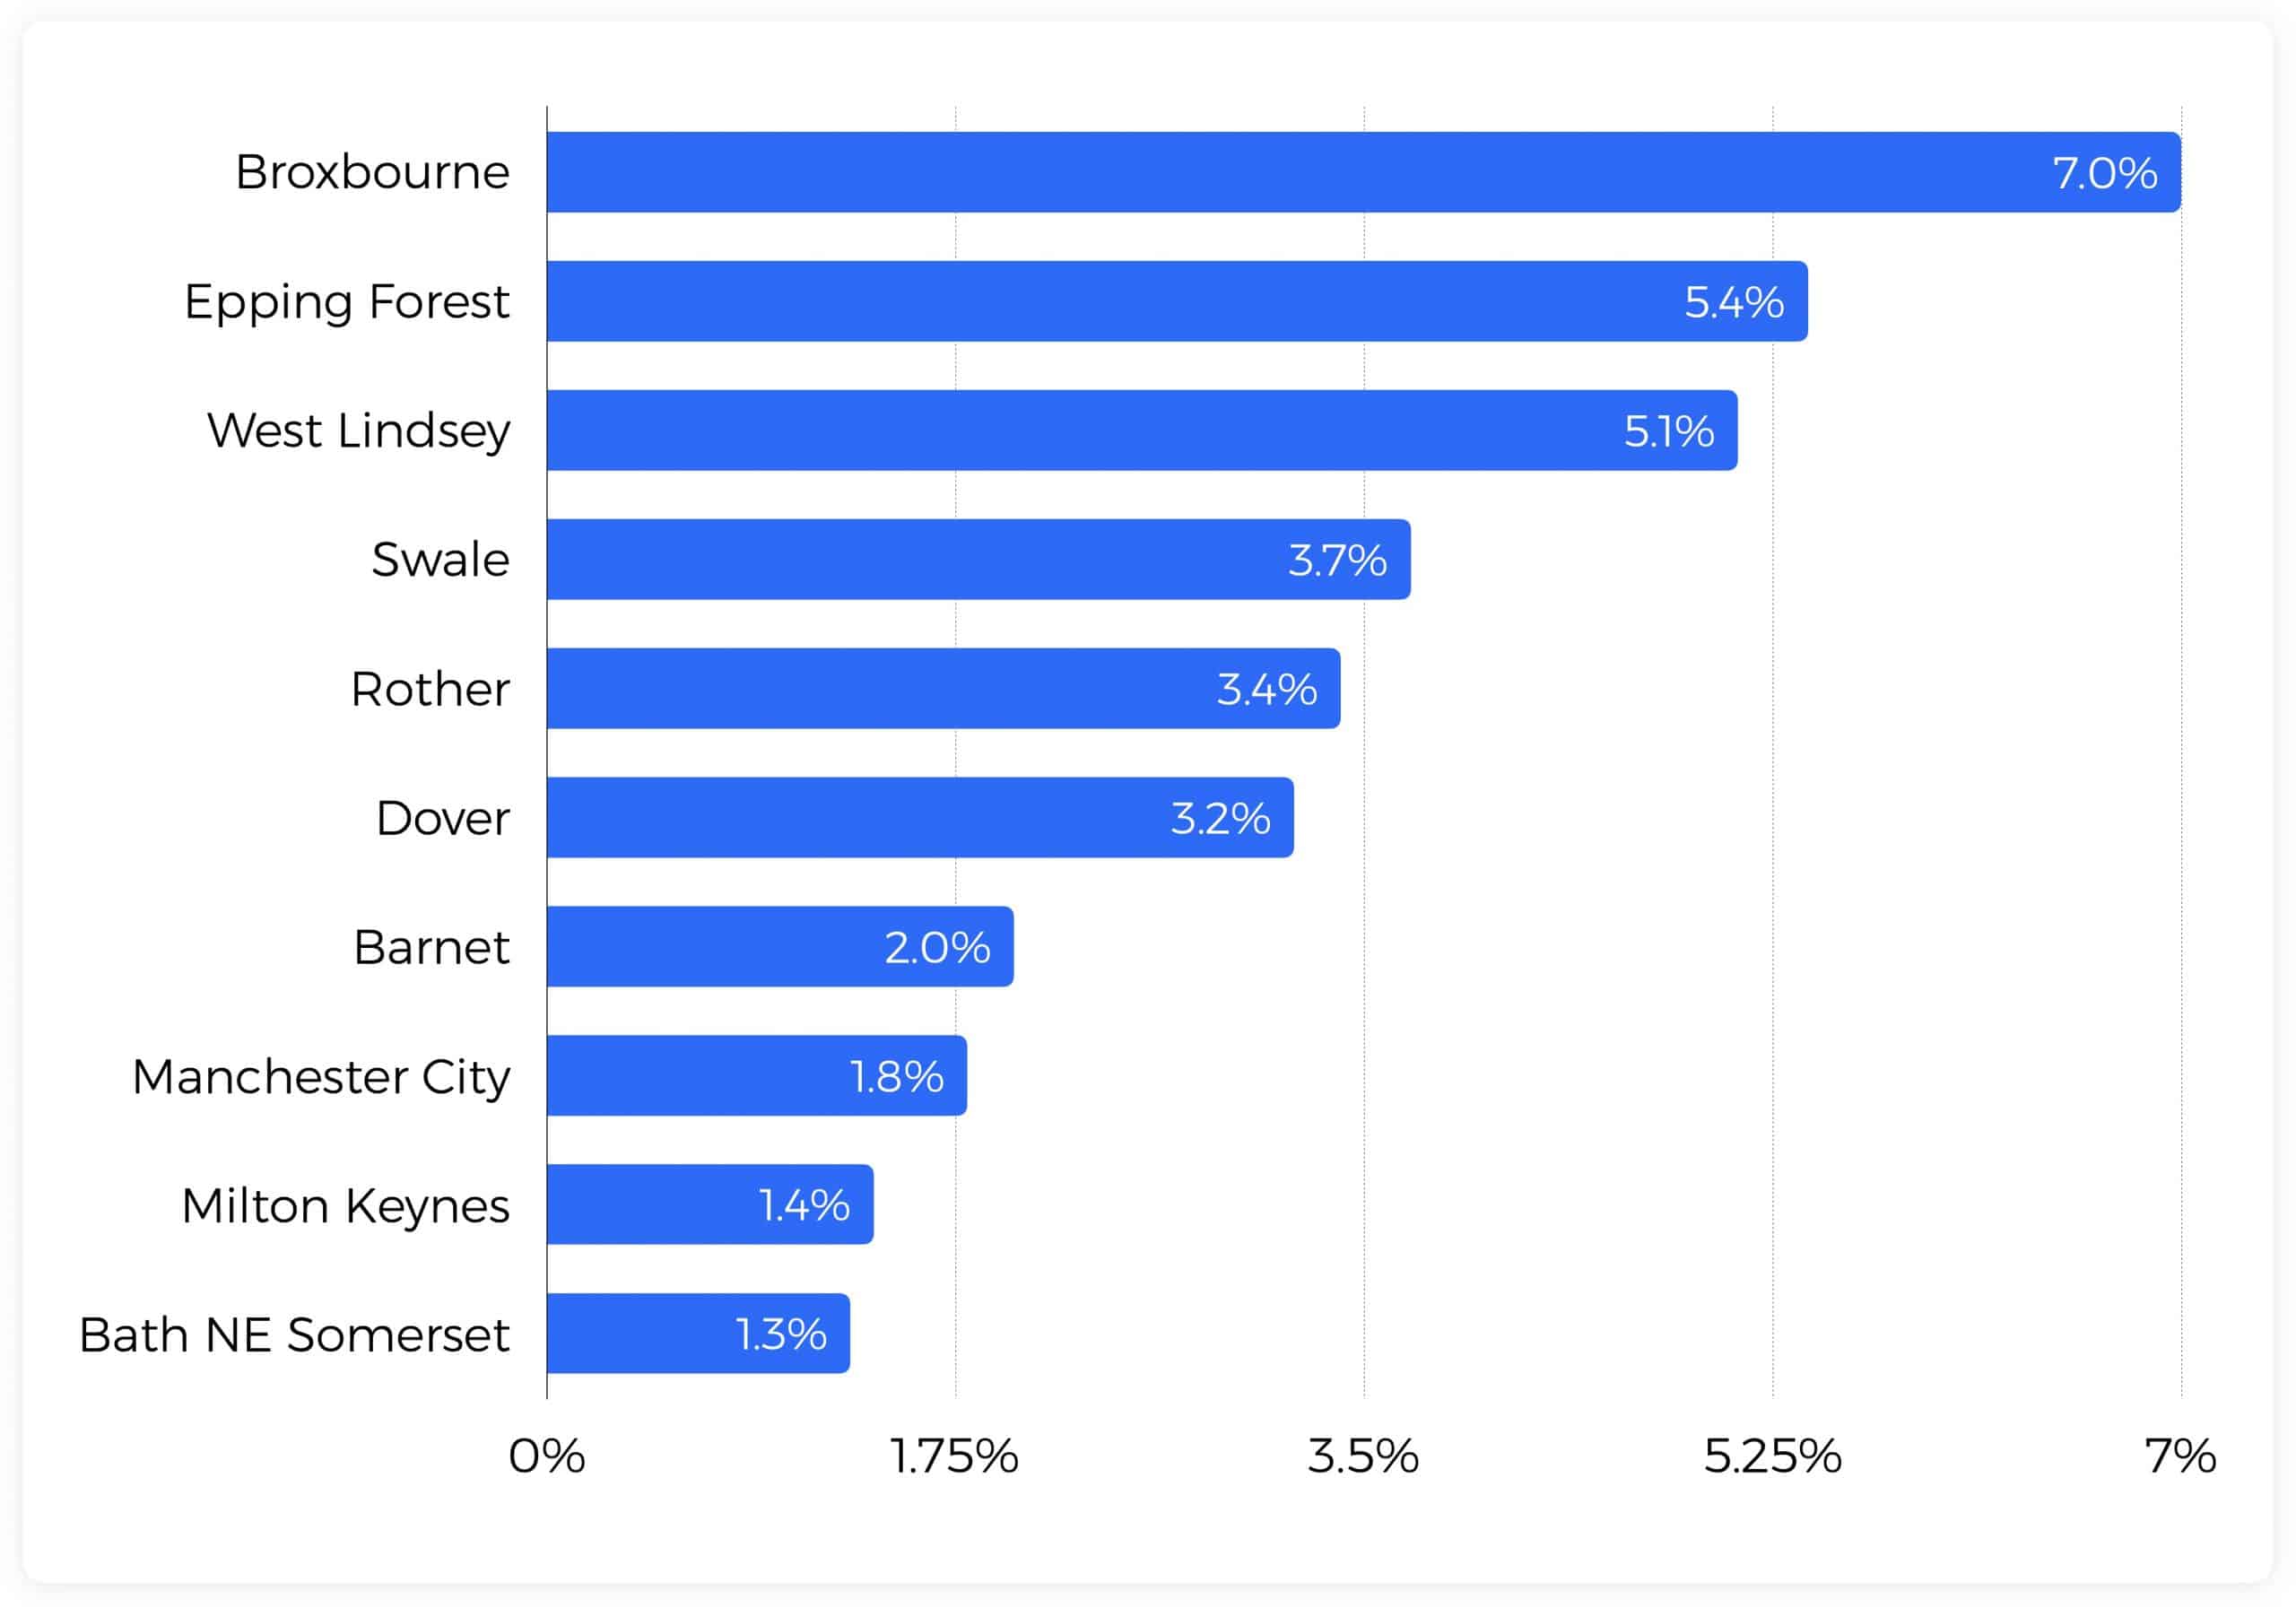
Broxbourne Council, located on the River Lea to the north east of London, takes gold for demonstrating the greatest increase – 7% – in catchment size over the Welcome Back Fund implementation period. That performance is followed by Epping Forest at 5.4%, also to the north east of London and West Lindsay, south of the Humber, just behind at 5.1%.
Across the top 10 winners, four are located in the South East, one in London and two in the East of England. Across all councils analysed, Huq found there to be a 0.3% contraction in catchment area size during the Welcome Back Fund implementation period, with those in the top 10 tracking collectively at 3.4%.
Methodology
Huq helps 50+ UK councils understand how people use their towns, high-streets and spaces. Its measurement platform offers insights into key performance indicators including:
- How busy places are
- Where visitors come from
- How long they stay for
- How often they come back
Using quality, first party observations and big data practices, these detailed and verified insights are available immediately, UK-wide. No hardware and no surveys required!

