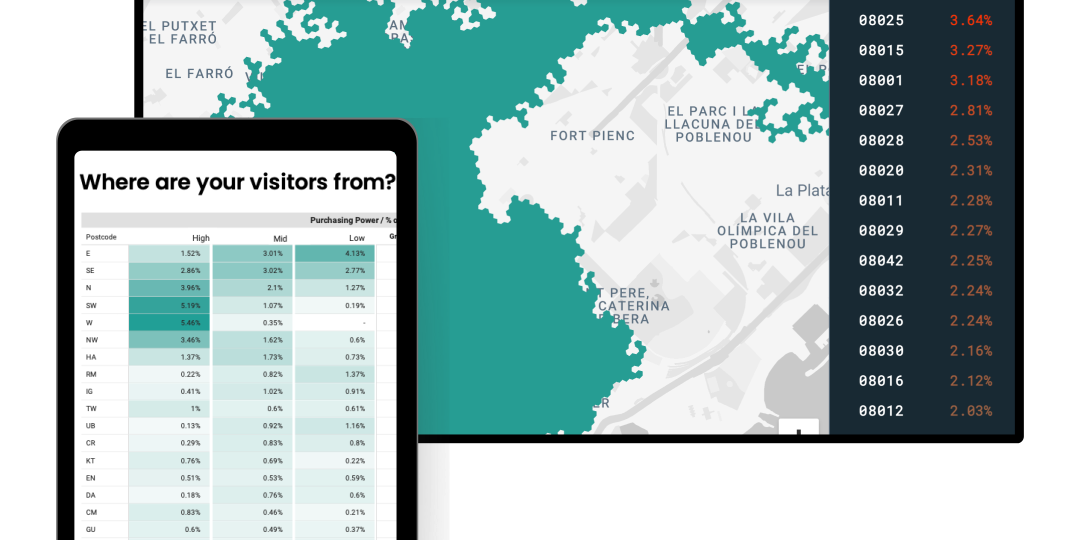
Where do visitors originate and where do they go?
Discover where visitors to places travel in from. Use Granular catchment insights to enrich your footfall data!
Book a Demo
This granular insight allows us to quantify how many visitors come from which postcodes
- Head of Economic Development
Accurate origin and destination monitoring
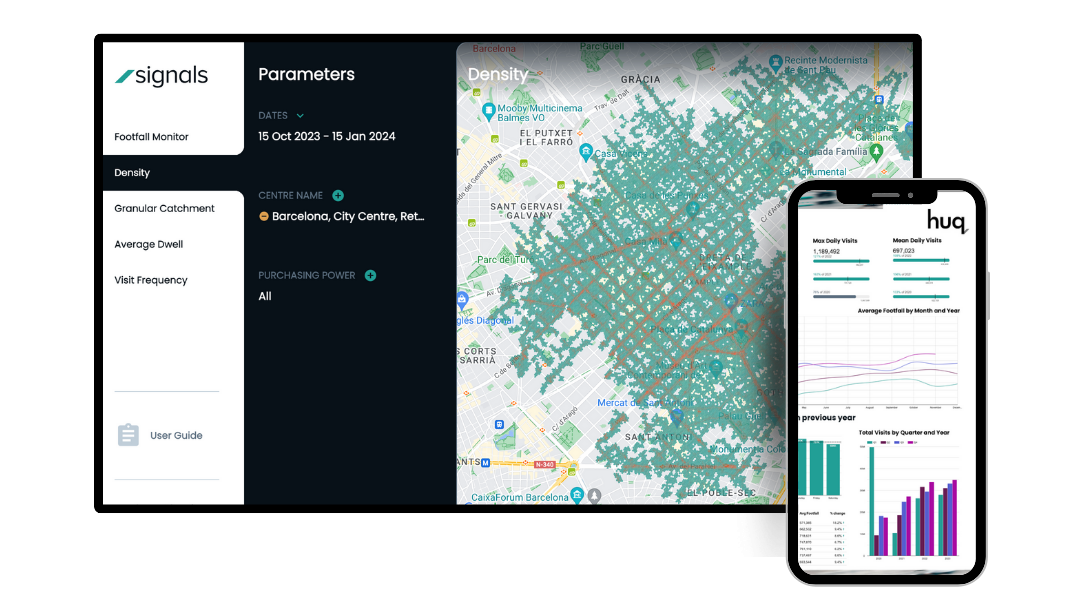
What is Granular Catchment?
Granular Catchment is the first ever product that quantifies number of visitors to specific destinations according to where they travel from.
- Postcode-level granularity
- Footfall insight enrichment
- Multi-area monitoring
- Hardware-free solution
- Global coverage
- 5+ years' history
Explore use cases
Learn why Huq’s data is trusted by over 300+ industry leaders
Getting started is easy
Get instant access to insights worldwide.
Speak to our mobility experts to get tailored insights that ensure your reach your goals.
Speak with an expert