The Top 10 Rising and Lagging Cities After Reopening on April 12th
To mark the re-opening of non-essential retail last week, Huq has used insights from Community Vision, it’s high-street measurement tool for local Councils, to chart the recovery of the top and bottom towns and cities across England and Wales. The data measures both pedestrian footfall and in-store visits to non-essential outlets across 10,000+ high-streets between Monday 5th and Saturday 17th April, aggregated to the city level.
Chelmsford in Essex has topped the list for footfall growth since non-essential retail’s reopening, with an increase of 71.9% over the first week. However, while Chelmsford has been busy in terms of footfall, Exeter has in fact seen the greatest rise in non-essential store visits, with levels almost tripling in the week (up 227.3%) – albeit from a small base.
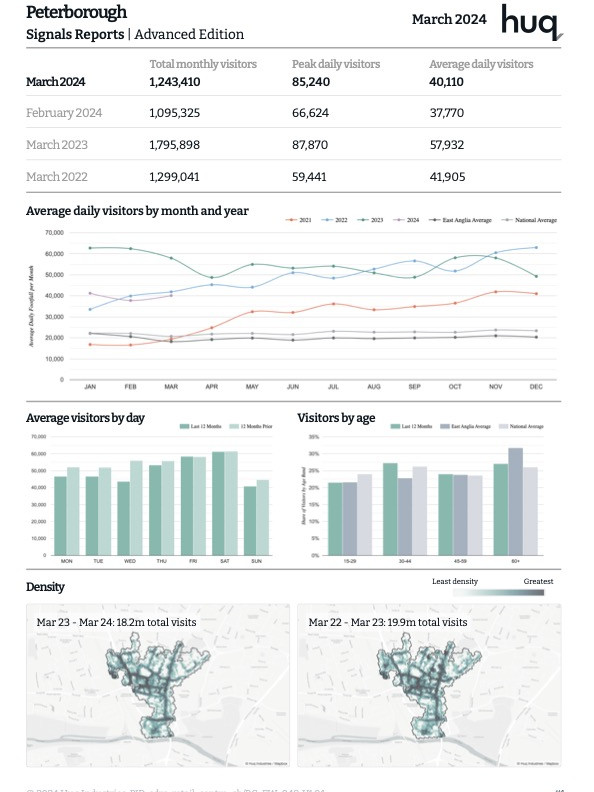
Data from Community Vision has also revealed the ten towns and cities that are lagging in both footfall and recovery. Peterborough saw an increase of just 3.9% in footfall in the week since April 12th, while Southend-on-Sea saw store visits rise by only 5.3%.
Interestingly, Birkenhead near Liverpool features as the tenth highest riser for footfall but yet also appears as the fifth most lagging town for in-store visits. This contrast suggests lower levels of discretionary economic activity in spite of larger crowds.
Top 10 Towns & Cities for Increased Footfall
Chelmsford | 71.90% |
Bracknell | 70.40% |
Crawley | 58.80% |
Maidstone | 58.20% |
Basildon | 49.20% |
Solihull | 48.30% |
Bath | 47.20% |
Carlisle | 46.70% |
Southampton | 46.40% |
Birkenhead | 46.10% |
Top 10 Towns & Cities for Non-essential Retail
Exeter | 227.30% |
Ipswich | 183.30% |
Nottingham | 170.60% |
Bournemouth | 170.60% |
Cambridge | 150.90% |
Manchester | 137% |
Liverpool | 133.30% |
Bristol | 123.40% |
Leeds | 122.70% |
Norwich | 116.60% |
The 5 Most Lagging Towns & Cities for Footfall
Peterborough | 3.90% |
Slough | 6.60% |
Harlow | 7.30% |
Nuneaton | 7.70% |
Milton Keynes | 11.50% |
The 5 Most Lagging Towns & Cities for Non-essential Retail
Southend-on-Sea | 5.30% |
Burton upon Trent | 6.60% |
Derby | 7.10% |
Milton Keynes | 10% |
Birkenhead | 12.50% |
Community Vision is a platform that provides high-street usage insights to public health, town centre managers and economic development officers in local government across the UK. The product offers accurate footfall measurement data for the council area on a daily basis. It also provides breakdown of how that footfall is distributed across the area. Click here to discover more!
Huq Industries publishes high-frequency economic data across a range of themes derived from its first-party geo-mobility data. Our first-party, verified and compliant data supports a broad range of applications in financial services, real-estate, and public sector and CPG. Whichever research themes you are following, Huq offers a fast and reliable means to measure business and societal trends with confidence.
Related Stories
StickyGuides
The Ultimate Guide To Mobility Data – 2022
This guide contains all you need to know to reap the benefits of mobility data, whether you’re from a local government, building contractor or even in finance. Mobility data can really improve your…
Using Big Data to Unlock New Advantages in Transport Management & Planning
Until recently, data for Transport Planning has been based on surveys such to create a largely static, unchanging resources. The use of mobility data to provide a detailed, high-frequency view of…
What is the Shared Prosperity Fund (SPF) and Why is Monitoring So Critical?
What is the UK Shared Prosperity Fund and how is Huq’s platform central to customers who wish to take advantage of it? In this guide we examine the aims of the UK Shared Prosperity Fund and evaluate…
Open Data: Using Footfall to Measure Parks & Open Spaces Usage In the Pandemic
Discover how parks and green spaces played an important role for residents during the pandemic. Huq used mobility data with 149.2K parks and open space locations to conduct the first UK ‘big data'…
Using ‘Time of Day’ Mobility to Analyse Local High Street Performance | Part 4
Using ‘time of day’ mobility data to analyse local high street performance and find the impact of pandemic trends on rural and urban high streets.
Google Startup Stories: Huq CTO Talks About The Startup Journey
Huq Industries was recently featured in Google Cloud Startup Stories. Watch the video to hear Huq CTO Isambard Poulson talk about our exciting journey as a startup and Google Cloud Native Partner.
Exploring Local High Street Usage Through Mobility Data | Part 3
Exploring local high street usage through mobility data: In Part 3 of our blog series on Huq’s Local High Streets Report we look at the use of rural and urban high streets on different days of the…
Mobility Data Insights for Local High Streets | Part 2
Huq’s latest report on local high streets looks at how people in these places reacted to the restrictions introduced due to Covid-19, and how this can help councils plan for the future.
Evidencing the Impact of Covid-19 on Local High-Streets using Mobility Data | Part 1
We know through personal experience that people used their local high streets differently during the two years of the pandemic. But how can councils quantify those changes, and use that information…
New eBook! Pandemic Trends and The Future of Local High Streets
Download the ebook Pandemic Trends and The Future of Local High Streets for a detailed and informative look at how the UK’s local high streets have performed through the pandemic and until today.