How can I better understand market dynamics?
What can we do to minimise investment risks?
How can we capitalise on emerging opportunities?
Location intelligence trusted by 300+ industry leaders


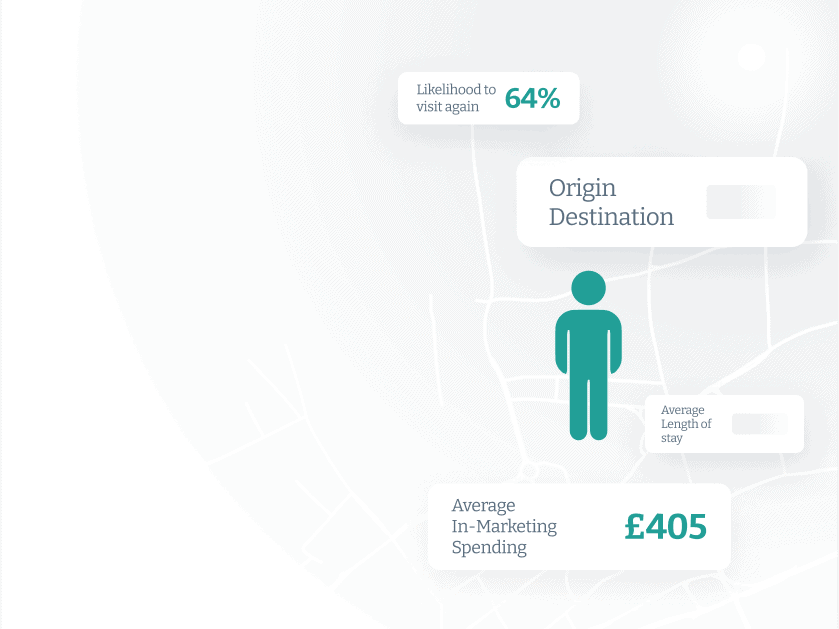
Understand your market
Complete customer profiles, sales data, and property information by layering mobility data with your existing data.
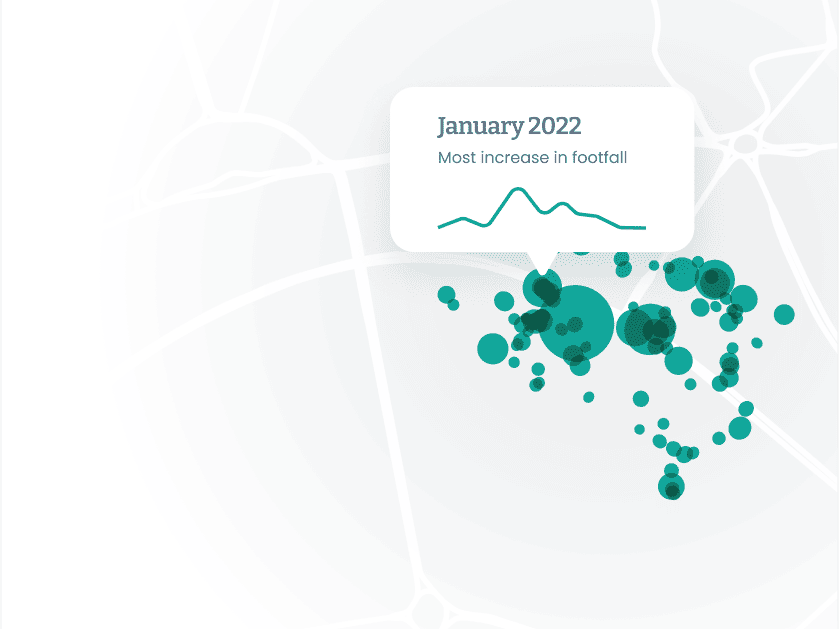
Pinpoint areas to prioritise
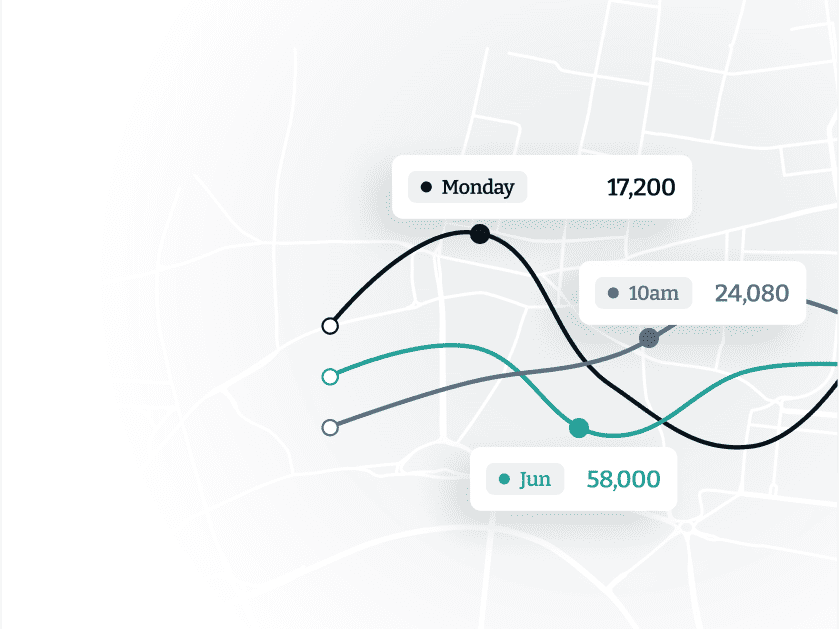
Leverage foot traffic, visit frequency, and customer demographics to understand high-traffic areas, popular destinations, and emerging trends.
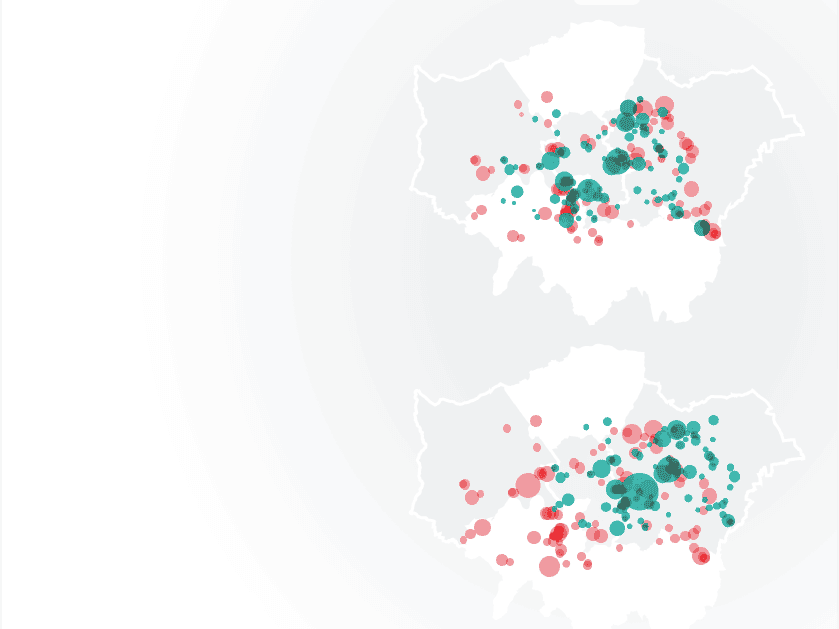
Monitor behaviour shifts
Identify changes in foot traffic patterns, peak visit times, and customer preferences to align your investments with evolving market dynamics.
Uncover investment risks
Mitigate risk while diversifying your investments across locations with insights into the stability of foot traffic, competition in the area, and economic indicators.
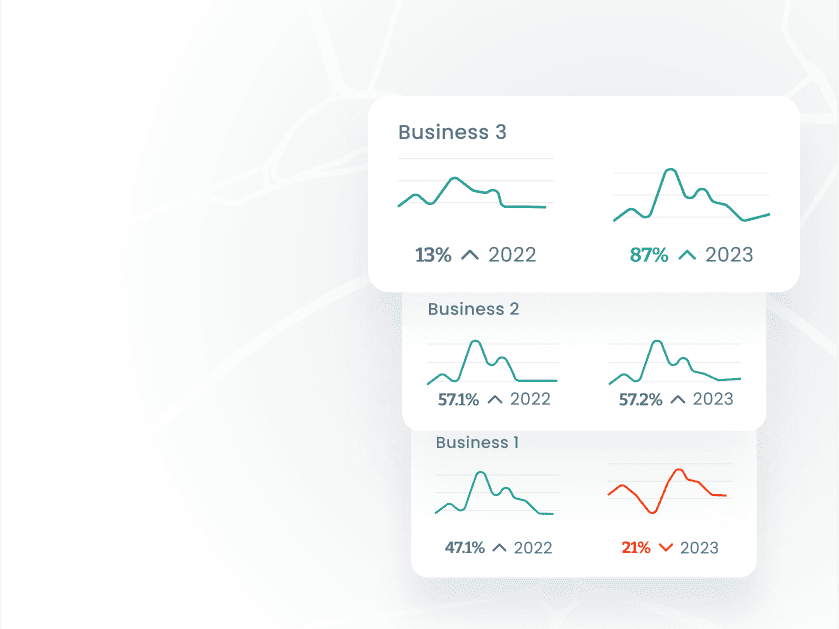
Drivie optimisation
Monitor the performance of your investments using foot traffic trends, customer engagement, and visit patterns.
3400
Stores
38
Countries
$12.5Bn
Annual sales
Huq’s catchment insights allows JD to more accurately assess the impact of the wider retail catchment on the sales potential of new store opportunities
Alastair Browne, JD Group Head of Site Research & Strategic Insight
223Bn
£GBP AUM
900+
Employees
12
Countries
Huq’s mobility data helps us to make better investment decisions and allows us to appropriately manage risk on behalf of our investor clients
Jonathan Bayfield, Head of UK Real Estate Research at Aviva Investors

