.svg)
Week 23 Weekly Wrap: Footfall Trends Revealed
UK retail footfall data shows a notable 1.5% uplift in major centres alongside improved engagement.

June 26, 2025
3 min read
Table of contents
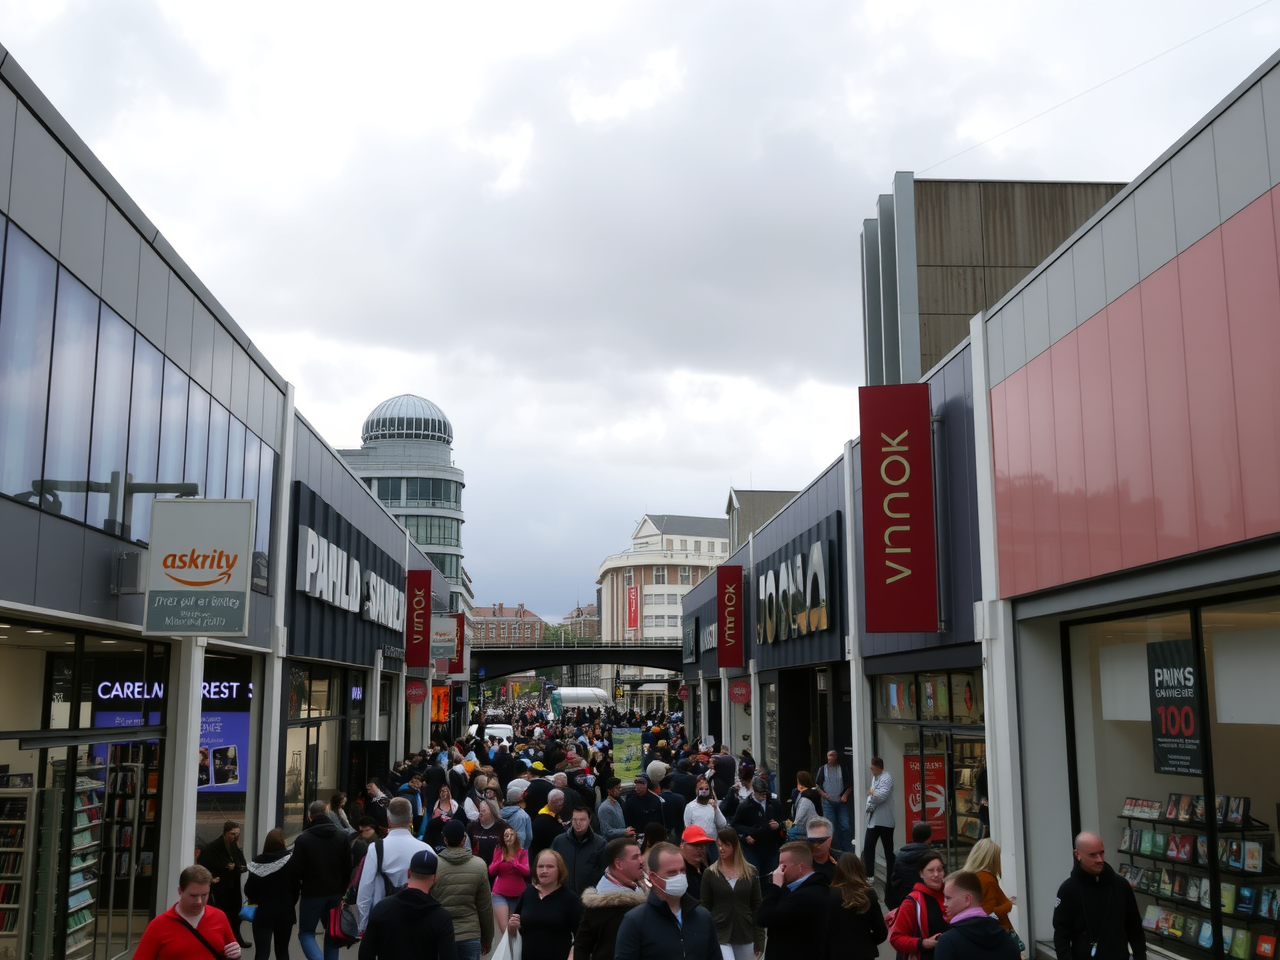
UK retail performance continues to evolve this week, with recent footfall statistics highlighting nuanced shifts across a range of retail centres. Early in the period, footfall data revealed a consistent recovery, with increasing engagement on every front. The latest figures from retail reports underscore that while visitor numbers fluctuate, dwell times are on a steady upward trajectory. In this Weekly Wrap, we uncover critical insights tied to footfall and explore the performance across diverse retail categories.
Major Retail Centres Trends
Major retail centres continue to register reliable activity. In Week 23, these centres reached an average daily count of 74,900 visitors, modestly up by 1.5% year‑on‑year, supported by an average dwell time of 117 minutes. Detailed insights are available in the Week 23 Major Retail Centres Footfall Data Update, which helps us analyse the steady improvement in footfall retail performance.
Local Retail Centres and Dwell Time Improvements
Local retail centres have shown a subtle yet encouraging trend. Week 23 figures reveal 14,400 daily visitors—a slight weekly rise of 1.5%—coupled with an 18.3% year‑on‑year gain in dwell time, now averaging 97 minutes. More details can be found in the Week 23 Footfall Analytics Update for UK Local Retail Centres, indicating that even modest increases in visitor counts can lead to richer in-store engagement.
Shopping Centres Performance Insights
Shopping centres have maintained strong performance amid evolving consumer habits. In Week 23, these venues witnessed an average of 33,700 daily visitors and dwell times around 116 minutes. In regional splits, England leads with 35,800 visitors at 124 minutes, while performance discrepancies across Scotland and Wales are visible. For further discussion on footfall statistics, see the UK Shopping Centres – Week 23 Performance Update.
Retail Parks: Weekly Growth and Challenges
UK Retail Parks experienced a notable weekly uplift with an average of 18,400 visitors—a 4.9% increase compared to previous weeks. However, year‑on‑year figures indicate a persistent decline of 7.8%. These contrasting trends echo challenges captured in earlier reports, such as the Week 21 update, emphasising that sustained footfall counting remains critical despite short-term gains. More information is offered in the Week 23 Retail Parks Performance Update.
High Streets and Town Centres Steady Performance
High streets and town centres have remained resilient with consistent, if unspectacular, numbers. The Week 23 report shows an overall average of 31,500 visitors and dwell times near 100 minutes, with England emerging as the strongest performer. This continuity reflects robust consumer attendance, detailed further in the Week 23 High Streets & Town Centres Update.
Analysis and Expert Insights
Joe Capocci, Huq Industries Spokesperson, remarked, "The evolving retail landscape demonstrates that while footfall trading is experiencing modest gains, increased engagement across centres points to a resilient market that is adapting well to consumer preferences." His comment highlights the importance of combining footfall analytics with strategic customer experience enhancements. Retailers across sectors are now focusing on in-store experiences, contributing to longer dwell times and bolstering overall performance.
Looking Forward
The data from major, local, shopping centres, retail parks and high streets presents a multi-faceted perspective on consumer behaviour. While percentages may vary, stronger dwell times confirm that shoppers are spending more quality time at these venues. This trend will be key to how brands adapt, whether by improving the footfall retail experience or by making targeted enhancements driven by detailed footfall data. The insights gleaned from these reports are essential for forecasting future trends in the competitive UK retail market.
Concluding Thoughts
This week’s analysis points to a cautious yet ongoing recovery within the retail sector. With mixed results across different retail centre types, increased engagement and longer visits appear to counterbalance slight declines in visitor numbers. Retailers that align their in-store experiences with these new trends may well see continued improvements in footfall analytics and overall market confidence.
Looking ahead, continuous monitoring and adaptation will be crucial. The detailed weekly evaluations serve as a benchmark for performance and offer retail professionals a solid foundation for strategic adjustments moving forward.
Media: For all media and press enquiries, please contact media@huq.io
About Huq Industries
Huq Industries is the leading provider of location intelligence across the UK, Europe, and the Middle East, specialising in delivering high-quality data insights on footfall, consumer behaviour, and retail performance. By leveraging advanced analytics, Huq Industries enables retailers and analysts to understand and respond to market trends effectively, ensuring they are well-equipped to navigate the changing landscape of high street and town centre commerce.
Get the latest intelligence Benchmark update each Thursday!
Frequently Asked Questions
Clear answers to the most common questions about movement intelligence, retail expansion, and location analytics.
Related Blogs and Insights



.svg)
Empowering strategic teams with the world's most accurate and accessible location intelligence.
Contact

.svg)