
Introducing Cross-Visitation: Retail Network Planning Data That Saves Millions in Investment
Which retail locations share the same audience? See the visitor overlap between target sites to improve planning efficiency and avoid wasted investment.

November 9, 2026
5 min read
Table of contents
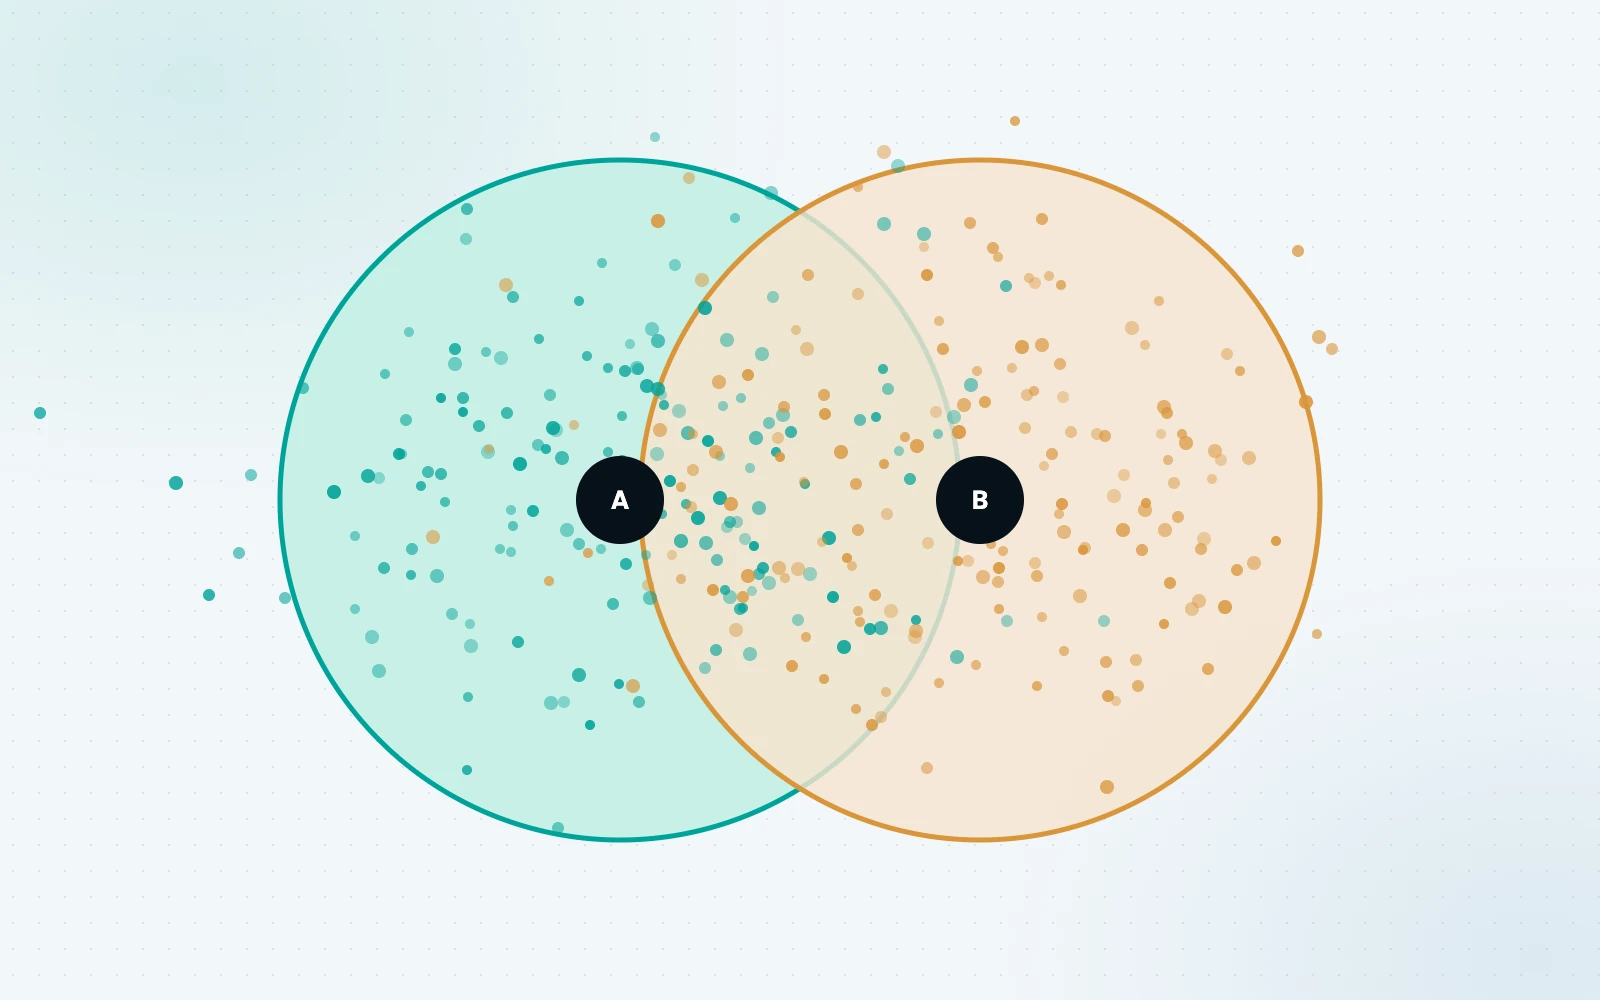
We’re excited to announce the launch of cross-visitation, our footfall data analytics tool that helps retailers validate location decisions and avoid investment in stores they don’t need.
It’s been in beta on the huq platform for a little while, as we’ve tested and refined the solution, and now we can do the big reveal!
What is huq’s cross-visitation tool?
Cross-visitation data provides must-have movement insights for retail brands looking to increase market share and make smarter network expansion decisions.
When assessing prospective store locations, retailers access footfall data from various sources. However, most data only goes so far. It’s not interconnected, so it doesn’t tell the whole story. That means too much guesswork, which leads to leaky budgets.
So, that’s where cross-visitation comes in…
Revealing visitor overlap between your target retail locations
As a global retail brand, you want the right level of market coverage, which often means investing in multiple stores in one area. But opening new stores costs a lot of money. The high street is volatile, and CFOs are breathing down your neck about bricks-and-mortar spend.
What if you could see the visitor overlap between your target retail locations?
Cross-visitation is that key piece of the puzzle. And huq’s solution provides fast, trustworthy real-world data on shared audiences that can save you millions of pounds in retail store investment.
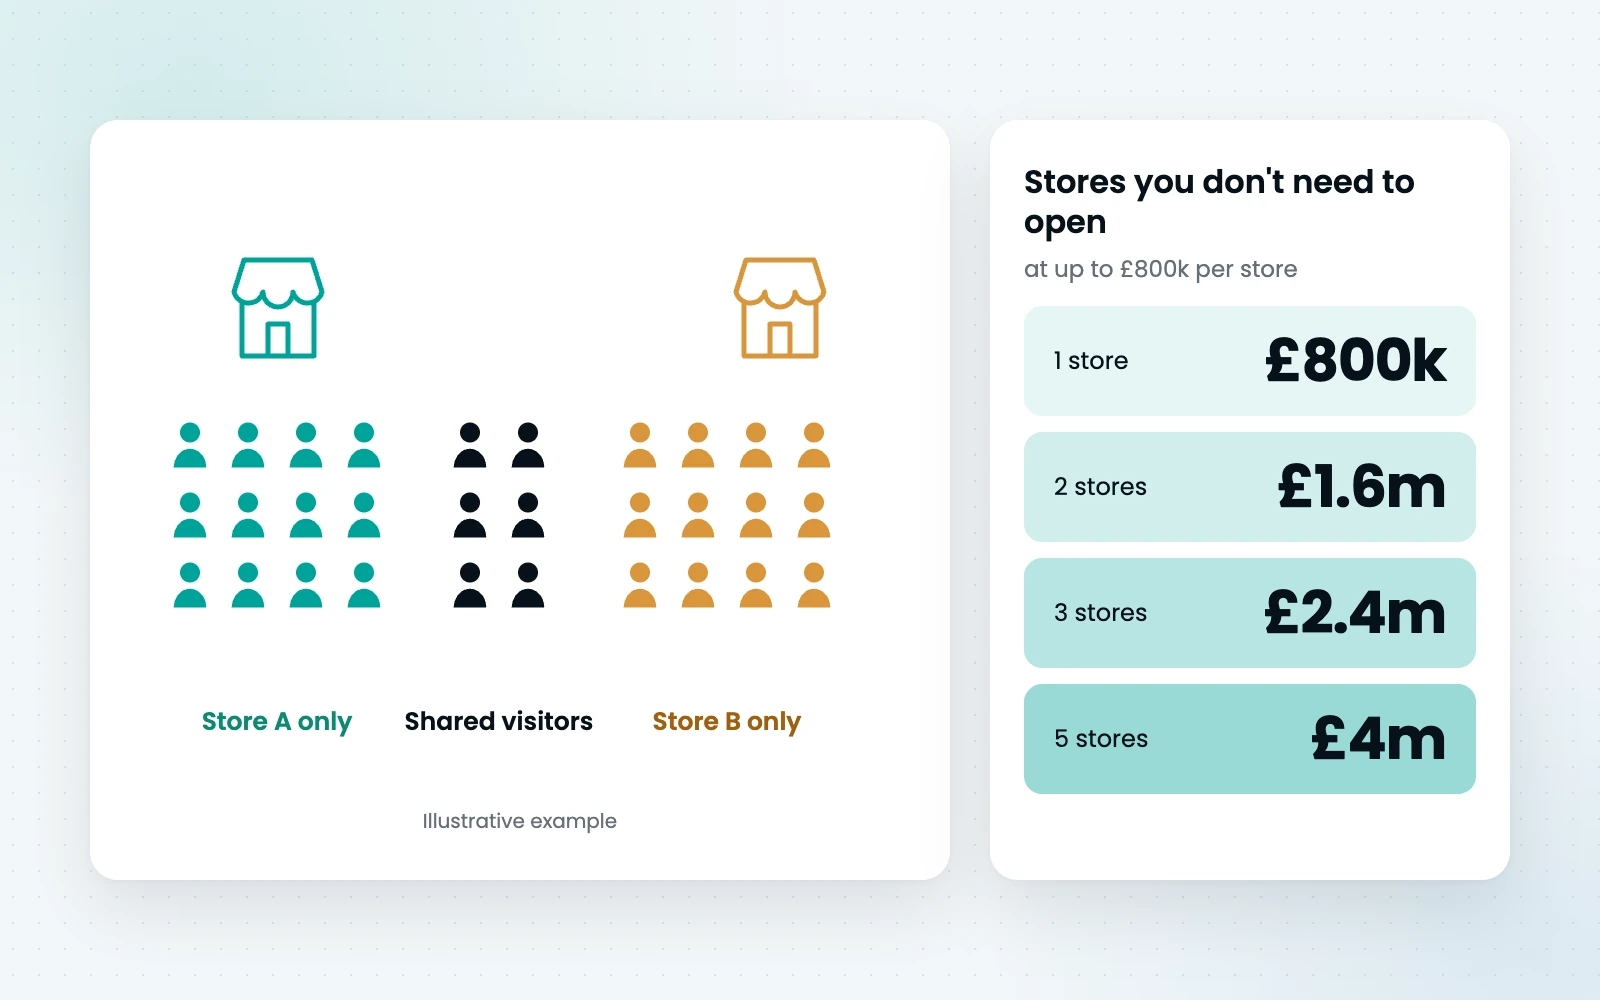
How? By revealing the proportion of people visiting a particular shopping location that also visit a nearby location. This allows you to judge whether both sites offer genuine opportunities to increase reach or attract largely the same audience (and aren’t worth the investment). And that’s news to your CFO’s ears.
What retail location planning insights does our tool offer?
Our cross-visitation insights tool provides interconnected data on shared audiences across retail locations. What does this mean? Well, say you have data on the number of people visiting location A and the equivalent for location B. What proportion of those visiting location A also shop at location B?
That’s exactly what cross-visitation data analysis shows you. You see the shared audience between any two locations, and the overall degree of crossover. These insights help you decide whether you need a store presence in both locations or you could achieve the same impact with just one.
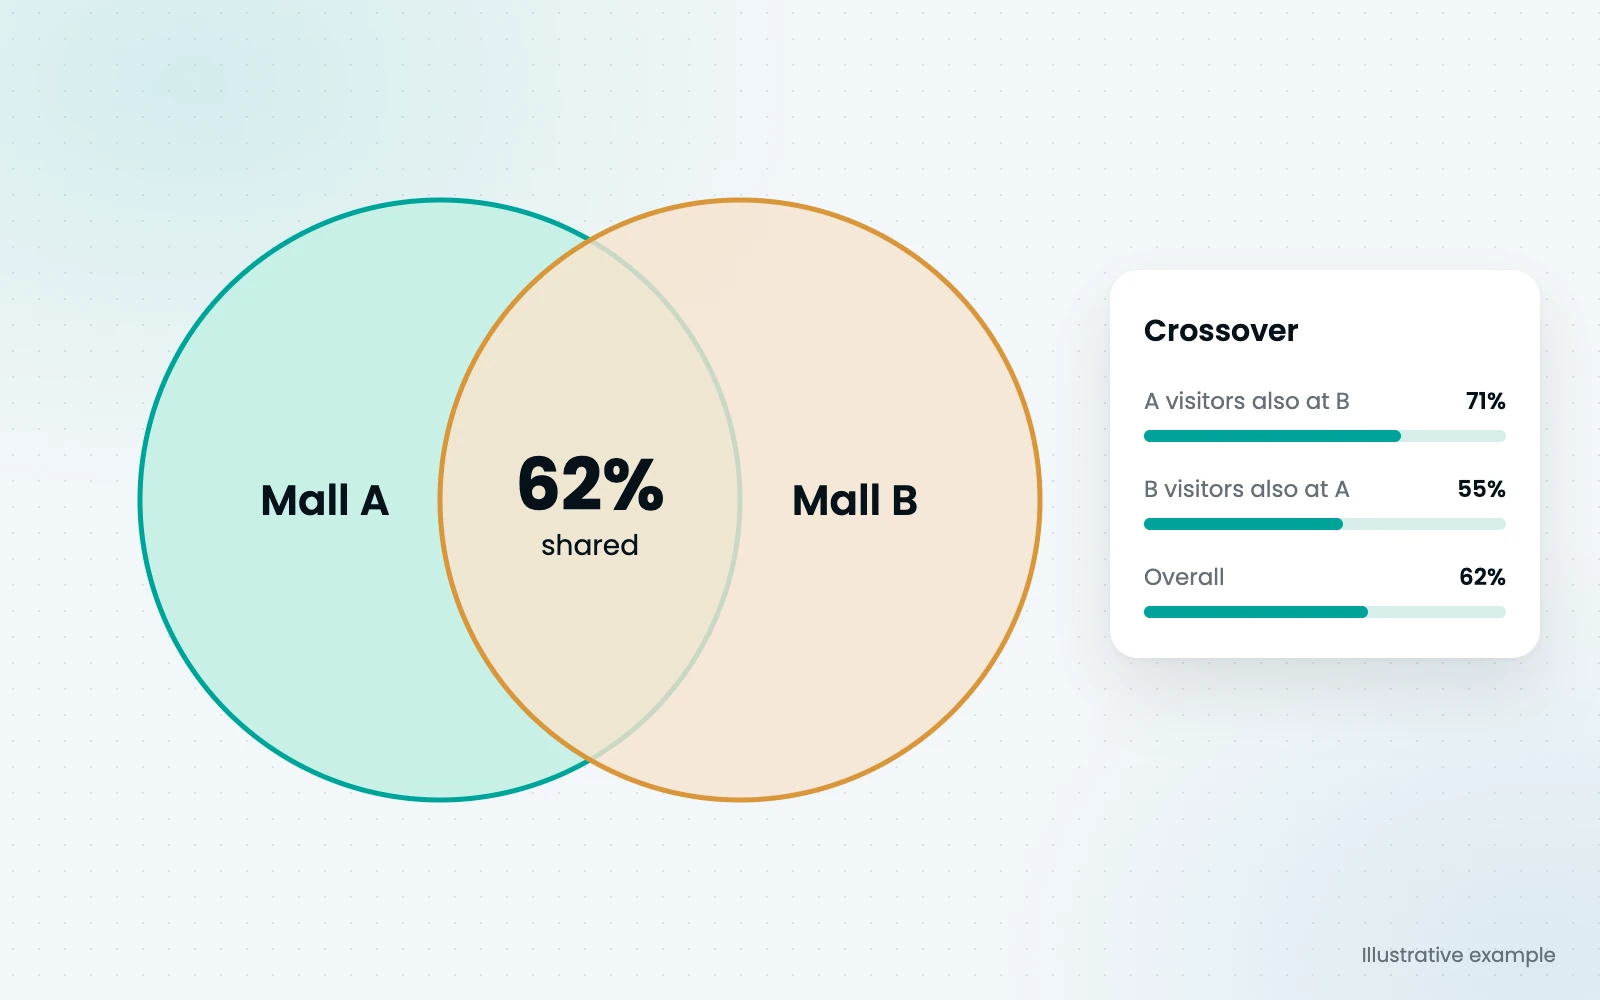
Flip this on its head, and you get the other main benefit of cross-visitation: finding unique market opportunities.
Our data analysis reveals where there’s minimal overlap between prospective locations within a specific catchment area. This is “market uniqueness”, i.e. where two (or more) malls or other shopping locations serve distinct audiences.
If you know that predominantly different people visit these locations, you can justify opening a store in each location to capture both audiences.

Amplify the opportunity and find the white space in your market
The great thing with cross-visitation is that retailers can go beyond simply comparing two store locations. You can cast a wider net. Our tool lets you pick up to 10 location pairs at once and compare the visitor overlap.
You’ll get a results matrix showing the correlation between stores (like below), from which you can pinpoint the best sites for increasing your customer reach and those likely to dilute your footfall when opening new stores.
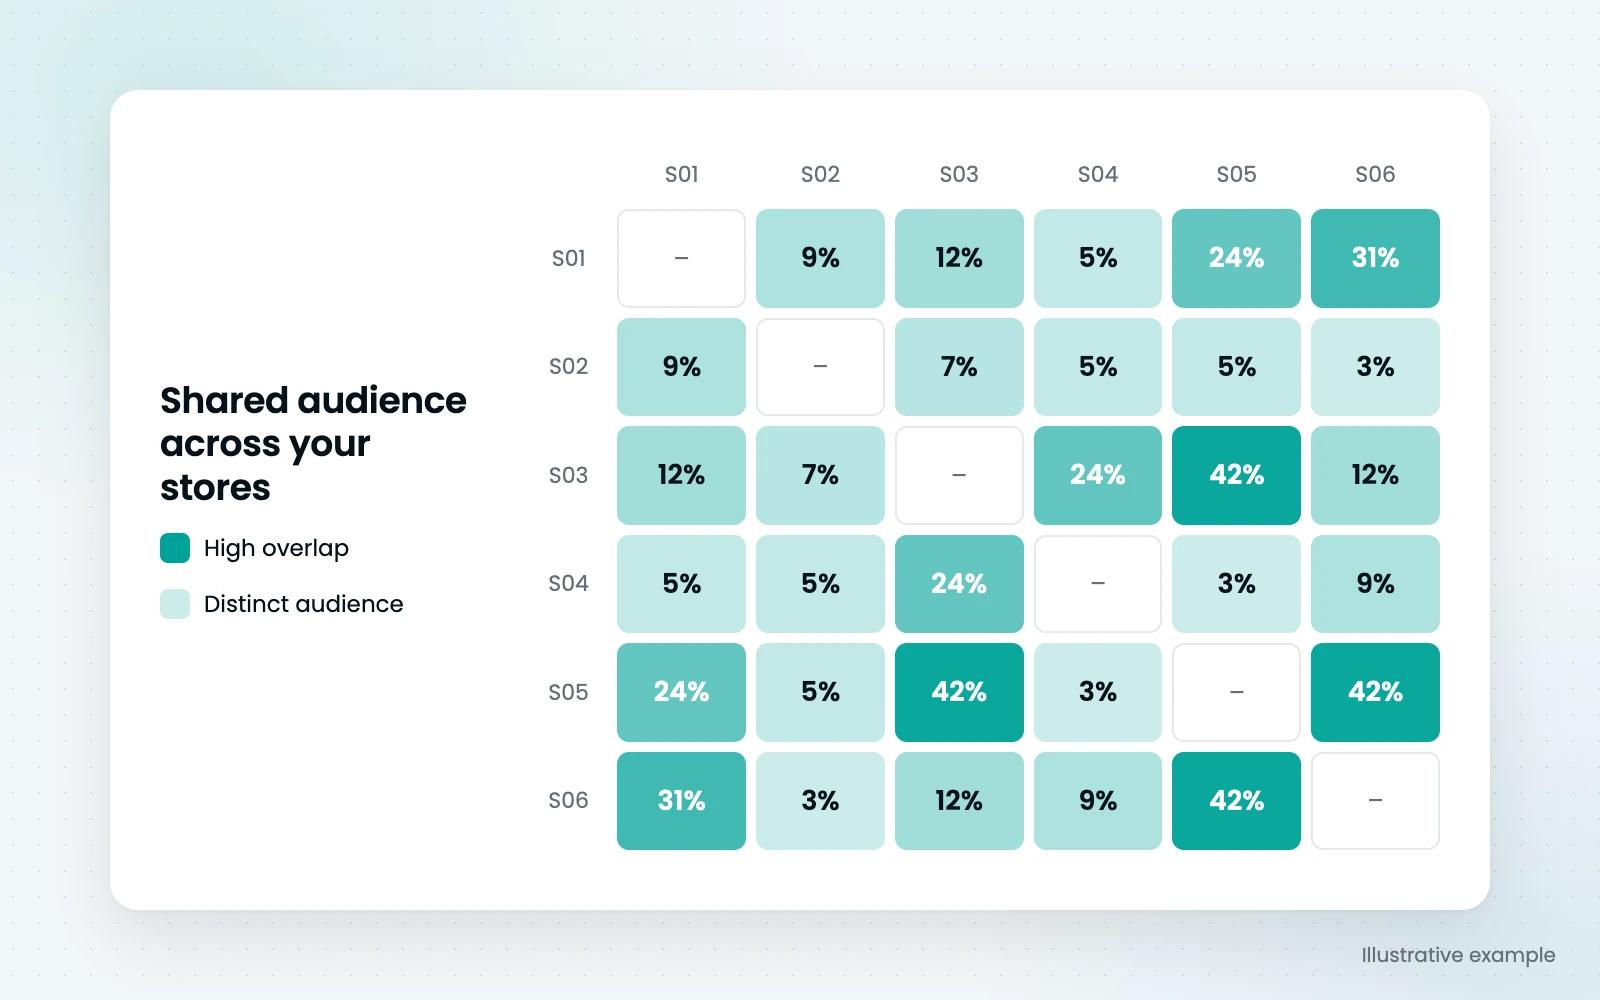
Selecting locations and generating visitor-overlap details takes just a few clicks. You can perform analysis at scale and pace, with an insight layer previously unavailable.
The result? Weeks saved in retail network planning, while shaving potentially millions of pounds off your budget.
What you need to know about our data
You might be thinking, “That all sounds great, but how accurate is the data and how is it validated?” Well, here’s what you need to know about our cross-visitation data:
- Combined insights from multiple anonymised and aggregated visitor data sources
- Street-level precision, benchmarked and stress-tested against thousands of locations per country every year
- 12-month trend data per result
- 2% MAPE vs CAA travel data (an extremely low margin of error)
- Available in 35 global markets (and counting)
You asked, we delivered
Demand for cross-visitation data has been sky-high. Over 300 companies use huq’s location intelligence, including top global retail brands, and some of the biggest names in the game have been knocking down the door for these shared audience insights.
After months of development and working closely with trusted retail technology and data providers, including Sensormatic, we delivered this in-demand addition to our retail location planning software.
Lorem ipsum dolor sit amet, consectetur adipiscing elit, sed do eiusmod tempor incididunt ut labore et dolore magna aliqua. Alexander Fairfax
Why is cross-visitation data so important?
Cross-visitation data provides crucial location insights which offer huge investment efficiency and cost-saving potential. Competition for customers is high as retailers vie for market share. So revealing which locations have significant visitor overlap and identifying where you should actually invest in new stores is a key edge over your retail rivals.
What’s the value opportunity?
We can’t overstate the value of these cross-shopping retail analytics. They provide real-world shared-audience analysis that can save millions in investment budgets for each of your target regions and markets.
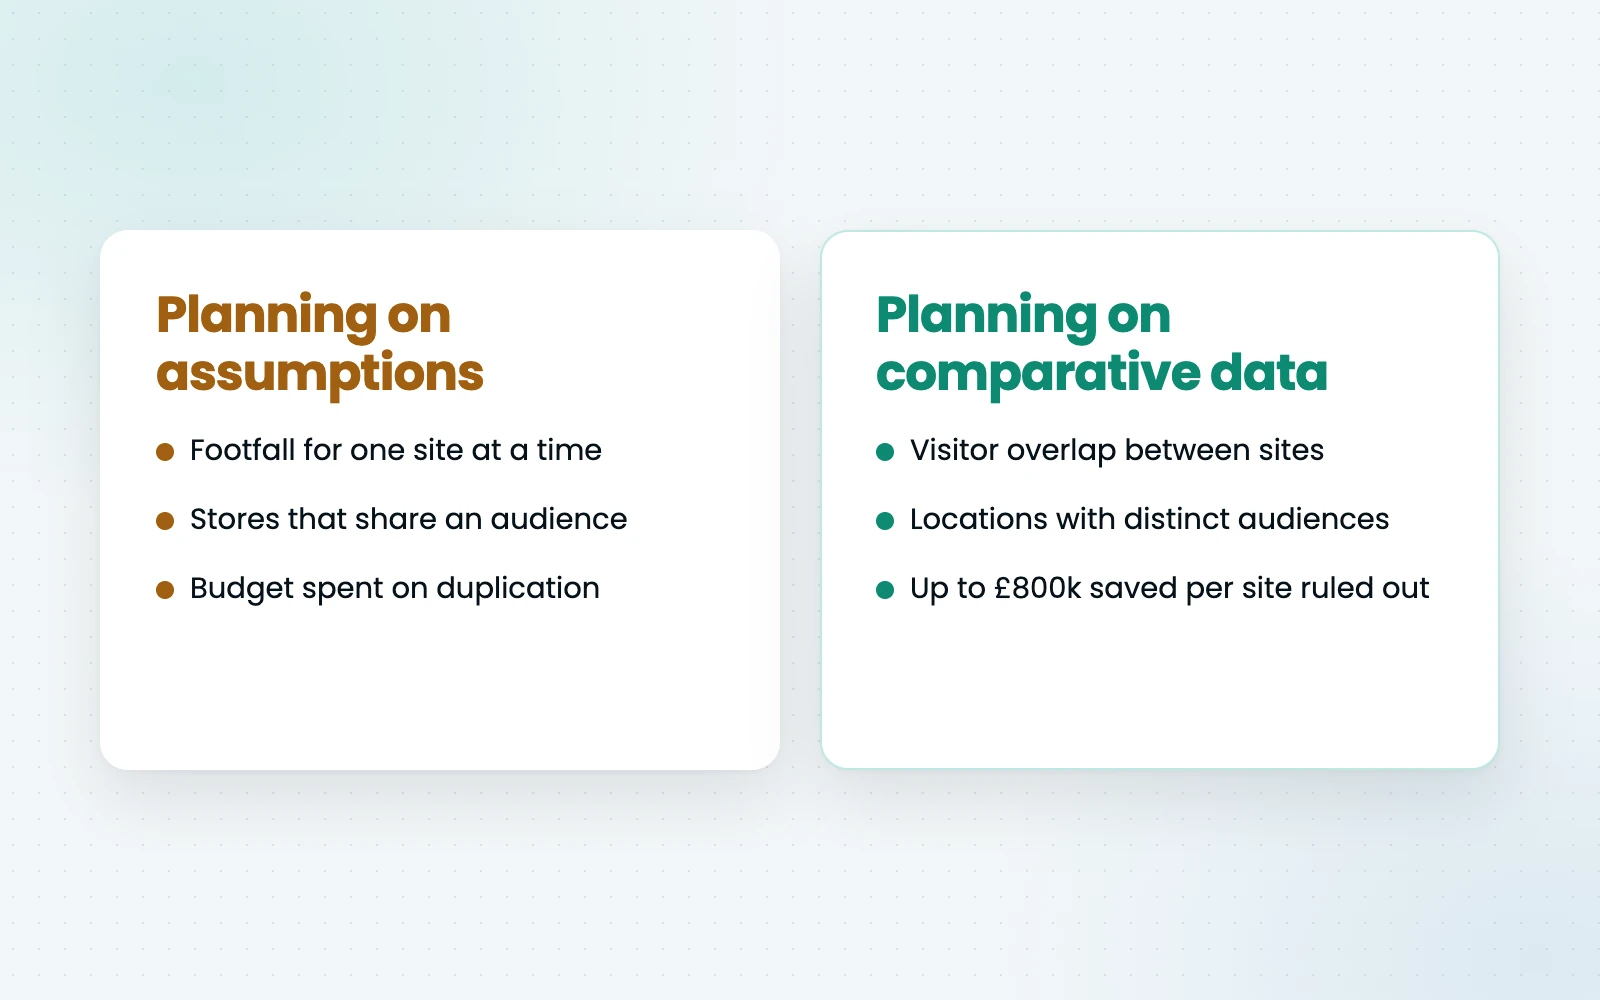
Using cross-visitation means your retail expansion planning just got a hell of a lot smarter. Base decisions on comparative visitor data rather than assumptions, and rule out certain locations, saving you up to £800k per site on stores that won’t grow your market share.
Key benefits of cross-visitation
- Enhancing store location visitation data with comparative footfall insights
- Visualising the shared audience of target locations (comparing up to 10 location pairs at one time)
- Increasing retail store investment efficiency
- Saving money on opening new stores with significant visitor overlap
- Diverting budget to store locations with distinct audiences
- Increasing market share by discovering unique market opportunities
- Putting real-world numbers behind retail expansion decisions
Interested in giving the tool a whirl? Get a free demo
Like the idea of seeing where you could achieve similar market coverage with the same investment? Why not get a free cross-visitation demo and see the solution in action?
We’ll walk you through the tool using relevant locations and show you how easy it is to use and the insights you can gather in seconds.

Frequently Asked Questions
Clear answers to the most common questions about movement intelligence, retail expansion, and location analytics.
Related Blogs and Insights

Empowering strategic teams with the world's most accurate and accessible location intelligence.
Contact

