.svg)
Week 23, 2025 Retail Parks Performance Update: Insights from Location Analytics
UK Retail Parks enjoyed a modest 4.9% weekly rise in footfall, reflecting short-term improvements despite long‑term declines. Dive into our update for key insights on retail park performance drawn from advanced location analytics and location intelligence data.

June 19, 2025
2 min read
Table of contents
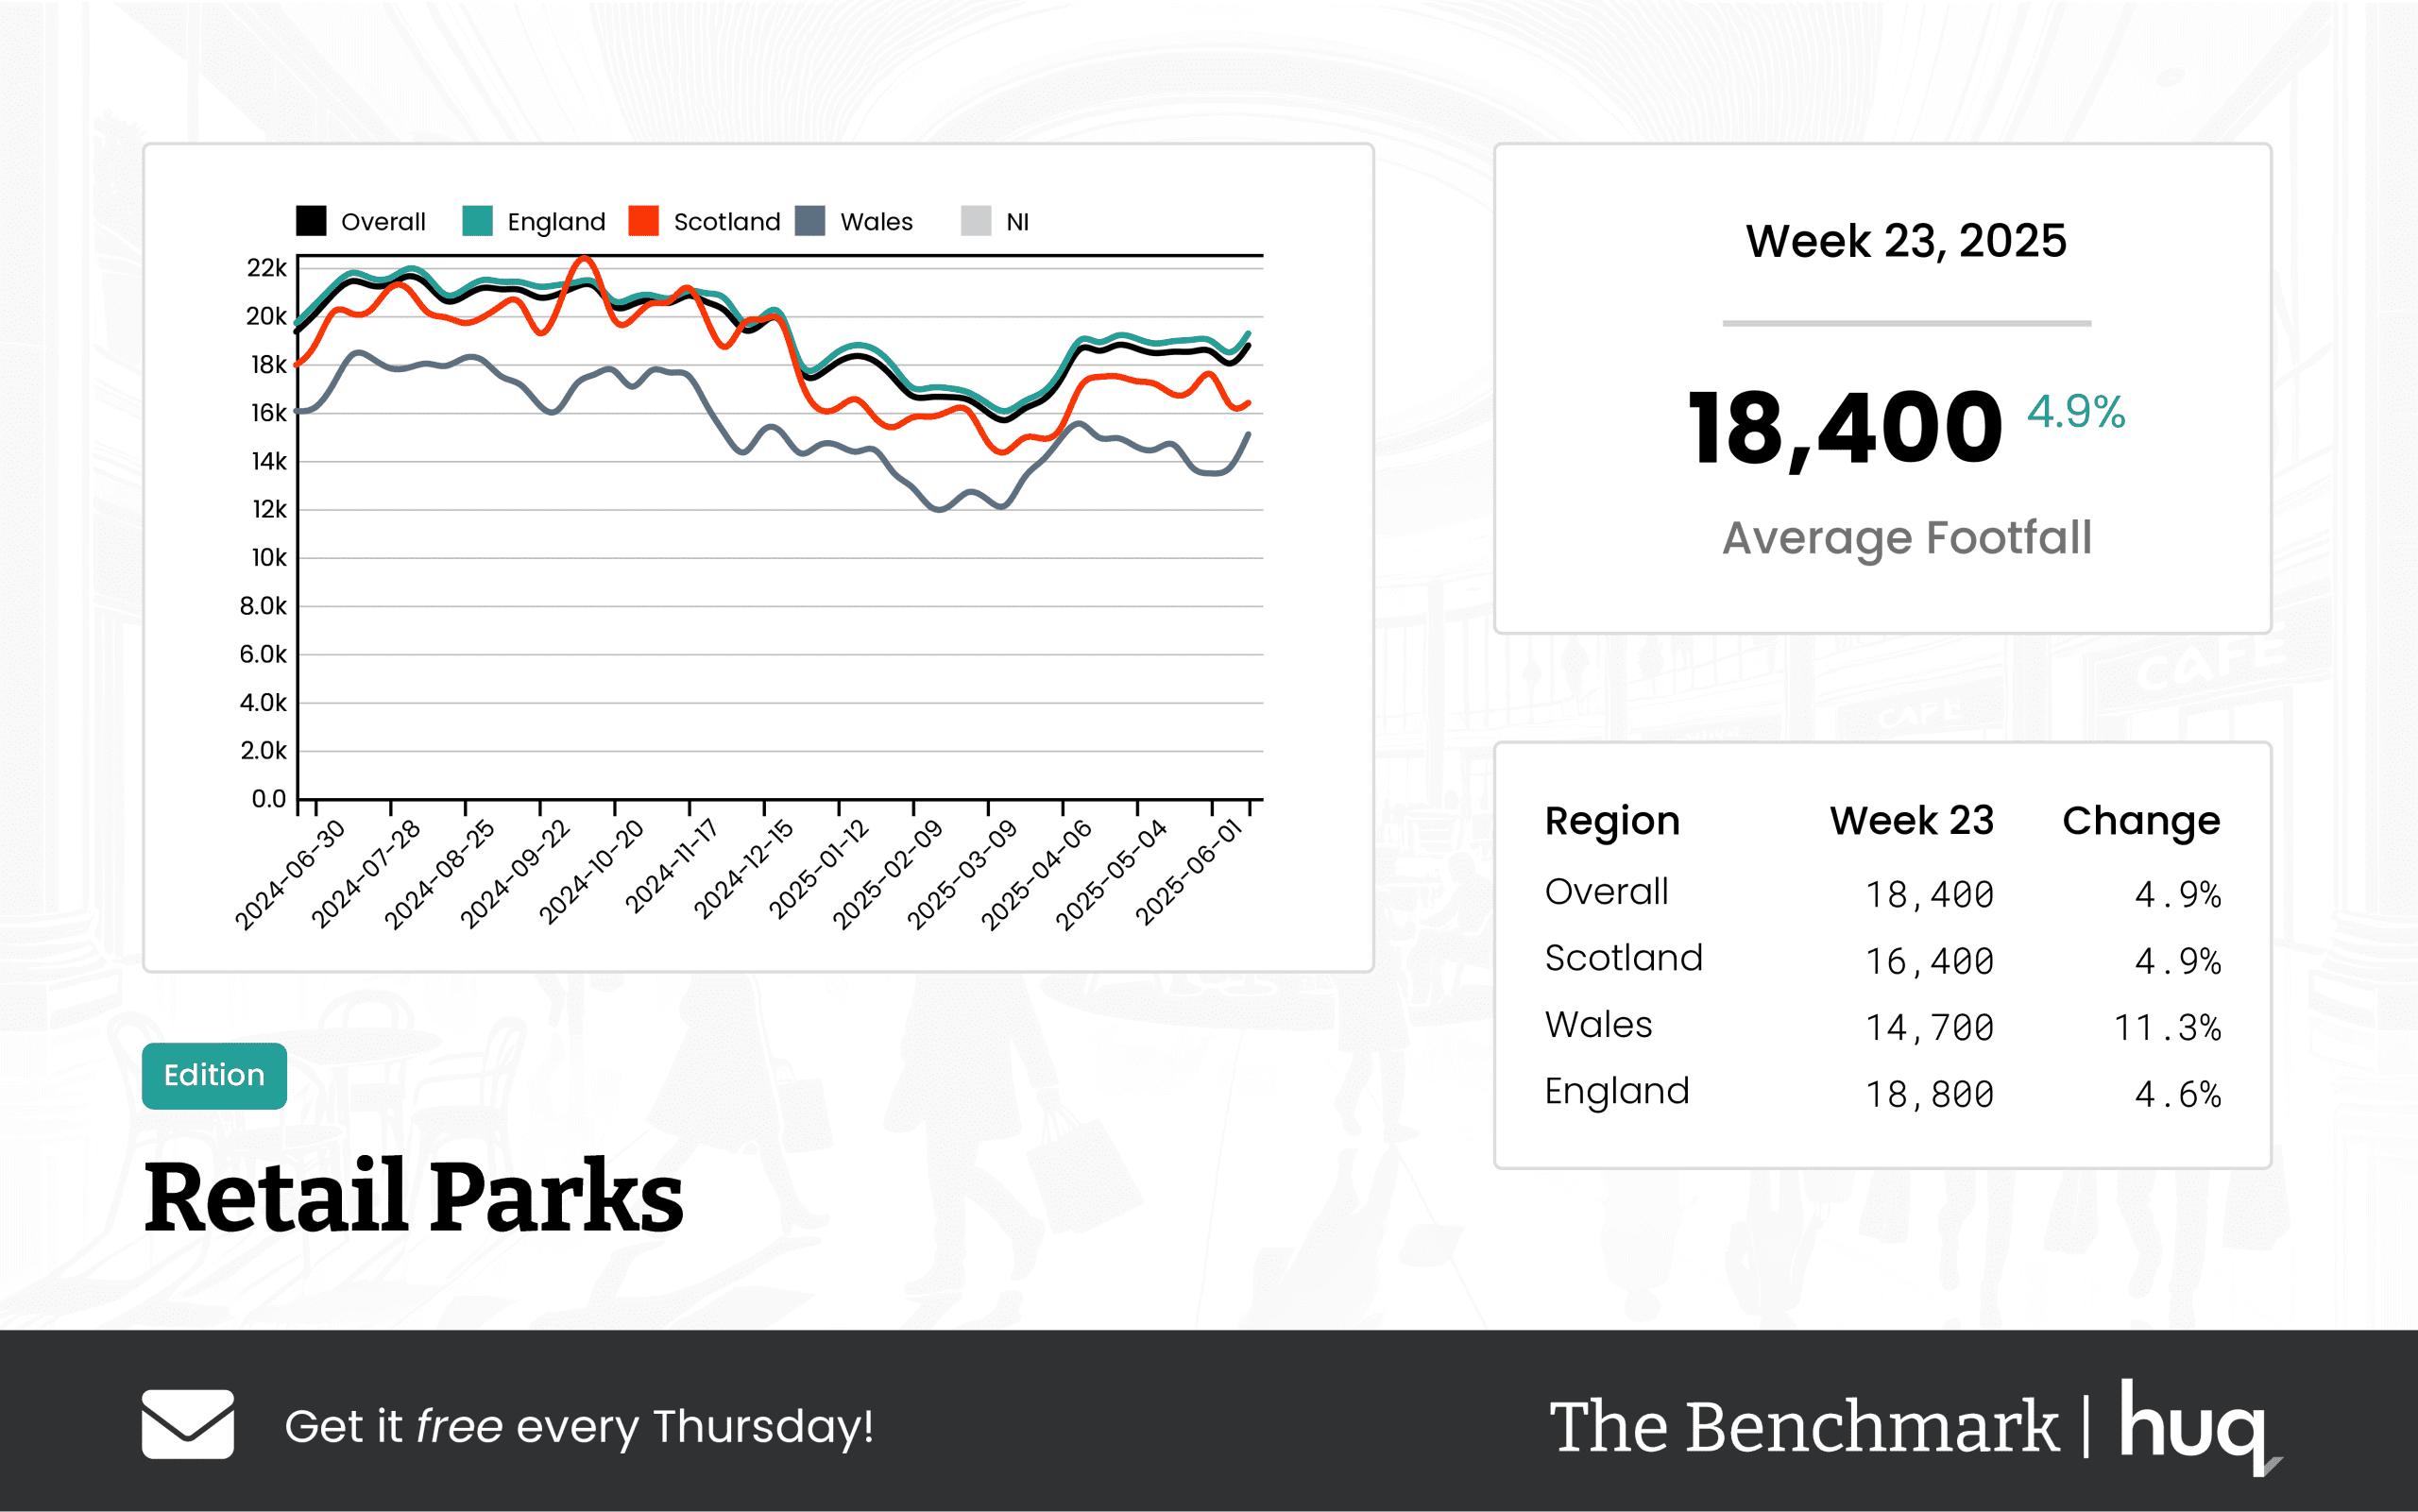
This week’s update on UK Retail Parks performance leverages detailed location analytics to provide a clear picture of evolving market trends. The report highlights crucial data on footfall, dwell time, and regional differences, offering a comprehensive view of where the industry stands and where it’s headed.
Overall Performance
For the week ending June 15, 2025, UK Retail Parks recorded an average of 18,400 visitors per day. This represents a 4.9% week‑on‑week increase, despite a 7.8% decline when compared to the same period last year. The short‑term uptick suggests a modest recovery, while the year‑on‑year figures underscore persistent challenges in attracting visitors over the longer term.
Regional Breakdown
• England: With an average of 18,800 visitors per day, England leads the regional performance. Its 4.6% weekly improvement is tempered by a slight 7.3% decline over the year, indicating steady activity amid ongoing market pressures.
• Scotland: The Nation experienced an average daily footfall of 16,400 visitors, registering a 4.9% weekly rise. However, the year‑on‑year trend is less encouraging, with an 11.1% decline observed, signalling a need for strategic interventions to boost sustained footfall.
• Wales: Notably, Wales observed the strongest weekly surge with a significant 11.3% rise, boosting its daily average to 14,700 visitors. Despite this encouraging week‑on‑week performance, the region still faces historic challenges with an 11.5% reduction over the past year.
Dwell Time Insights
Visitor engagement, as measured by dwell time, reveals that UK Retail Parks maintained an average visit duration of 76 minutes—a slight decrease of 1.3% from the previous week. England’s visitors spent about 77 minutes per visit, whereas Scotland trailed with an average of 59 minutes. Interestingly, Welsh retail parks stood out by recording the longest visit durations at 88 minutes, accompanied by a robust weekly increase of 14.3%. Over the longer term, while England has seen a sharp increase in dwell times, Scotland’s metrics have shown only marginal changes.
This update highlights the diverse performance metrics across regions and emphasises the importance of integrating location analytics into retail strategies. By understanding both short-term fluctuations and longer-term trends, stakeholders can better navigate the complexities of the retail landscape.
Media: For all media and press enquiries, please contact media@huq.io
About Huq Industries
Huq Industries is the leading provider of location intelligence across the UK, Europe, and the Middle East, specialising in delivering high-quality data insights on footfall, consumer behaviour, and retail performance. By leveraging advanced analytics, Huq Industries enables retailers and analysts to understand and respond to market trends effectively, ensuring they are well-equipped to navigate the changing landscape of high street and town centre commerce.
Get the latest intelligence Benchmark update each Thursday!
Frequently Asked Questions
Clear answers to the most common questions about movement intelligence, retail expansion, and location analytics.
Related Blogs and Insights



.svg)
Empowering strategic teams with the world's most accurate and accessible location intelligence.
Contact

.svg)