.svg)
Week 10 Weekly Wrap: Retail Trends and Location Analytics Update
Week 10 analysis shows a 6.2% drop in shopping centres' footfall. Explore how location analytics and location intelligence reveal evolving shopper trends.

March 20, 2025
3 min read
Table of contents
Introduction
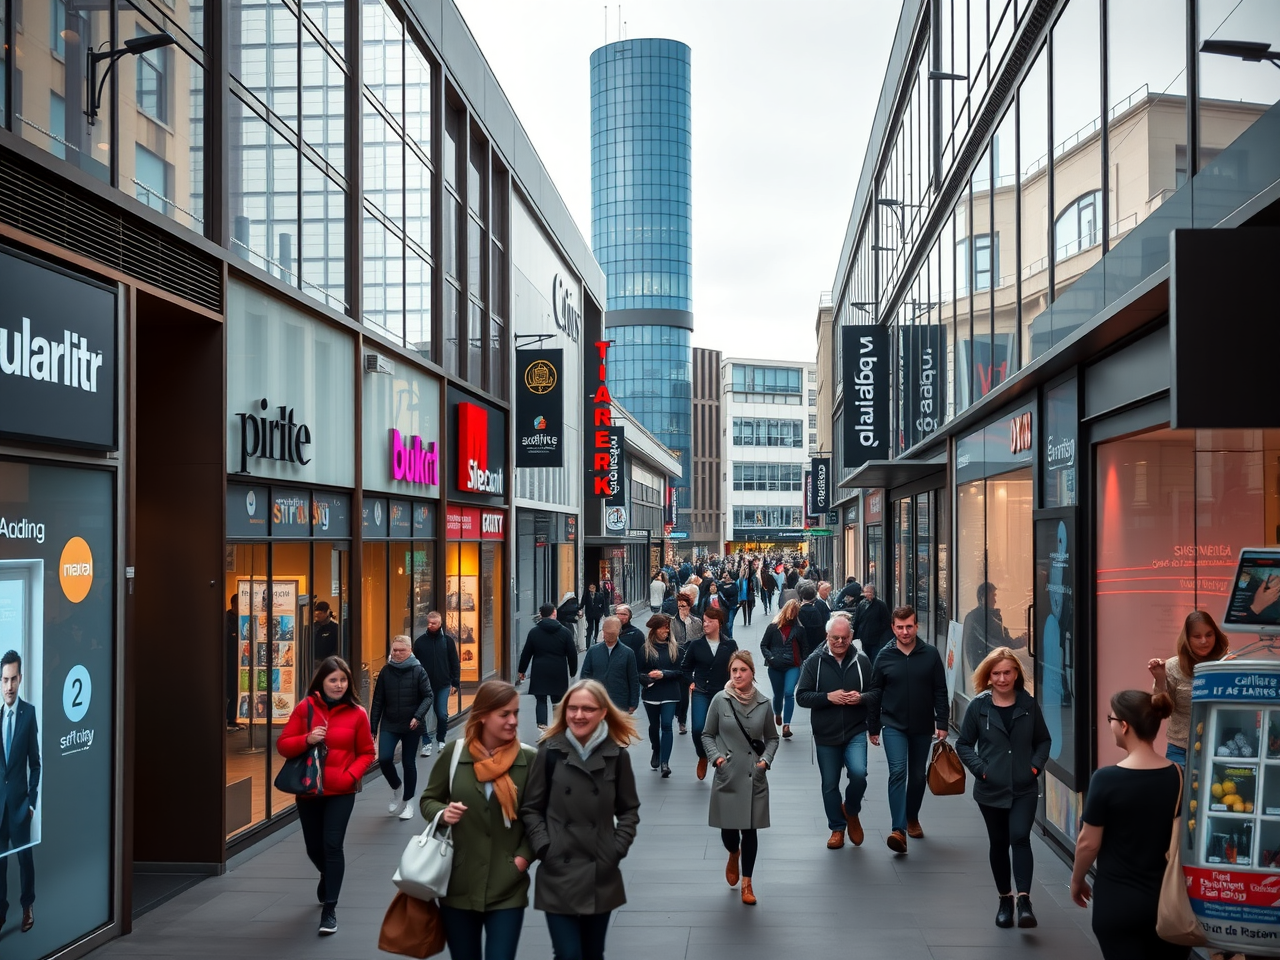
In Week 10, retail performance tests the resilience of locations across the UK. Early data shows that shifts in footfall and longer dwell times were common trends, offering important insights via location analytics. Retail centre insights and evolving consumer behaviour are evident from the updated statistics and detailed regional breakdowns.
Local Retail Centres
Local Retail Centres have experienced a modest decline in visits, with an overall average of 12,700 daily visits. Reports indicate that England sees 12,800 visits while Scotland and Wales have experienced sharper declines. Despite reduced numbers, dwell times increased to 95 minutes, suggesting that consumer engagement has strengthened; more details are available in the Local Retail Centres update.
Shopping Centres
Shopping Centres recorded an average of 24,500 daily visits. The performance update shows a 6.2% week-on-week decline with England and Wales being particularly affected, even as Scottish centres saw a marginal weekly increase. Dwell times averaged 109 minutes, reflecting a noticeable 6.8% weekly drop but a strong 13.5% yearly improvement; further insights can be found in the Shopping Centres performance update.
Retail Parks
Retail Parks demonstrated a moderate repression in footfall with an average of 15,600 visits per day, alongside minor regional declines. Variation is evident with Scottish Retail Parks posting a 2.7% weekly drop and English parks showing a steeper decline. Notably, Welsh parks even experienced a slight increase, and dwell time figures played out a 6.8% drop overall; complete details are noted in the Retail Parks performance update.
Major Retail Centres
Major Retail Centres remain a robust segment with an impressive daily average of 66,800 visits. Both England and Scotland face short-term declines, though Scotland recorded higher activity, while Wales showed strong annual recovery. Dwell time trends are positive with an overall average of 116 minutes; this trend exemplifies retail centre insights, as more details are provided in the Major Retail Centres update.
High Streets & Town Centres
High Streets and Town Centres saw an average footfall of 26,800 visits with mixed regional performance. English centres experienced modest drops, while Scottish sites enjoy a slight weekly increase despite an annual decline. Welsh centres maintained impressive engagement with dwell times of 113 minutes, as reported in the High Streets & Town Centres update.
Expert Insights and Market Reflection
The analysis points towards a market where footfall performance is contracting, yet dwell time trends show increasing engagement. "Contracting footfall coupled with increased dwell time shows that visitors are making thoughtful visits," said Joe Capocci, Huq Industries Spokesperson.
Conclusion
Week 10 reveals that UK retail is in a phase of transformation. Despite challenges like a 6.2% dip in footfall at shopping centres, the increasing visit durations indicate a shift towards quality visits over quantity. Retail stakeholders are now better equipped to leverage location intelligence, optimise strategies, and respond to changing consumer behaviour across different regions.
Media: For all media and press enquiries, please contact media@huq.io
About Huq Industries
Huq Industries is the leading provider of location intelligence across the UK, Europe, and the Middle East, specialising in delivering high-quality data insights on footfall, consumer behaviour, and retail performance. By leveraging advanced analytics, Huq Industries enables retailers and analysts to understand and respond to market trends effectively, ensuring they are well-equipped to navigate the changing landscape of high street and town centre commerce.
Get the latest intelligence Benchmark update each Thursday!
Sign Up NowFrequently Asked Questions
Clear answers to the most common questions about movement intelligence, retail expansion, and location analytics.
Related Blogs and Insights



.svg)
Empowering strategic teams with the world's most accurate and accessible location intelligence.
Contact

.svg)