.svg)
Week 10, 2025 Local Retail Centres – Footfall Statistics Update
UK Local Retail Centres saw a modest decline in footfall data with daily visits dipping slightly while dwell times rose; footfall analytics reveal evolving visitor engagement trends.

March 20, 2025
2 min read
Table of contents
Overall Performance
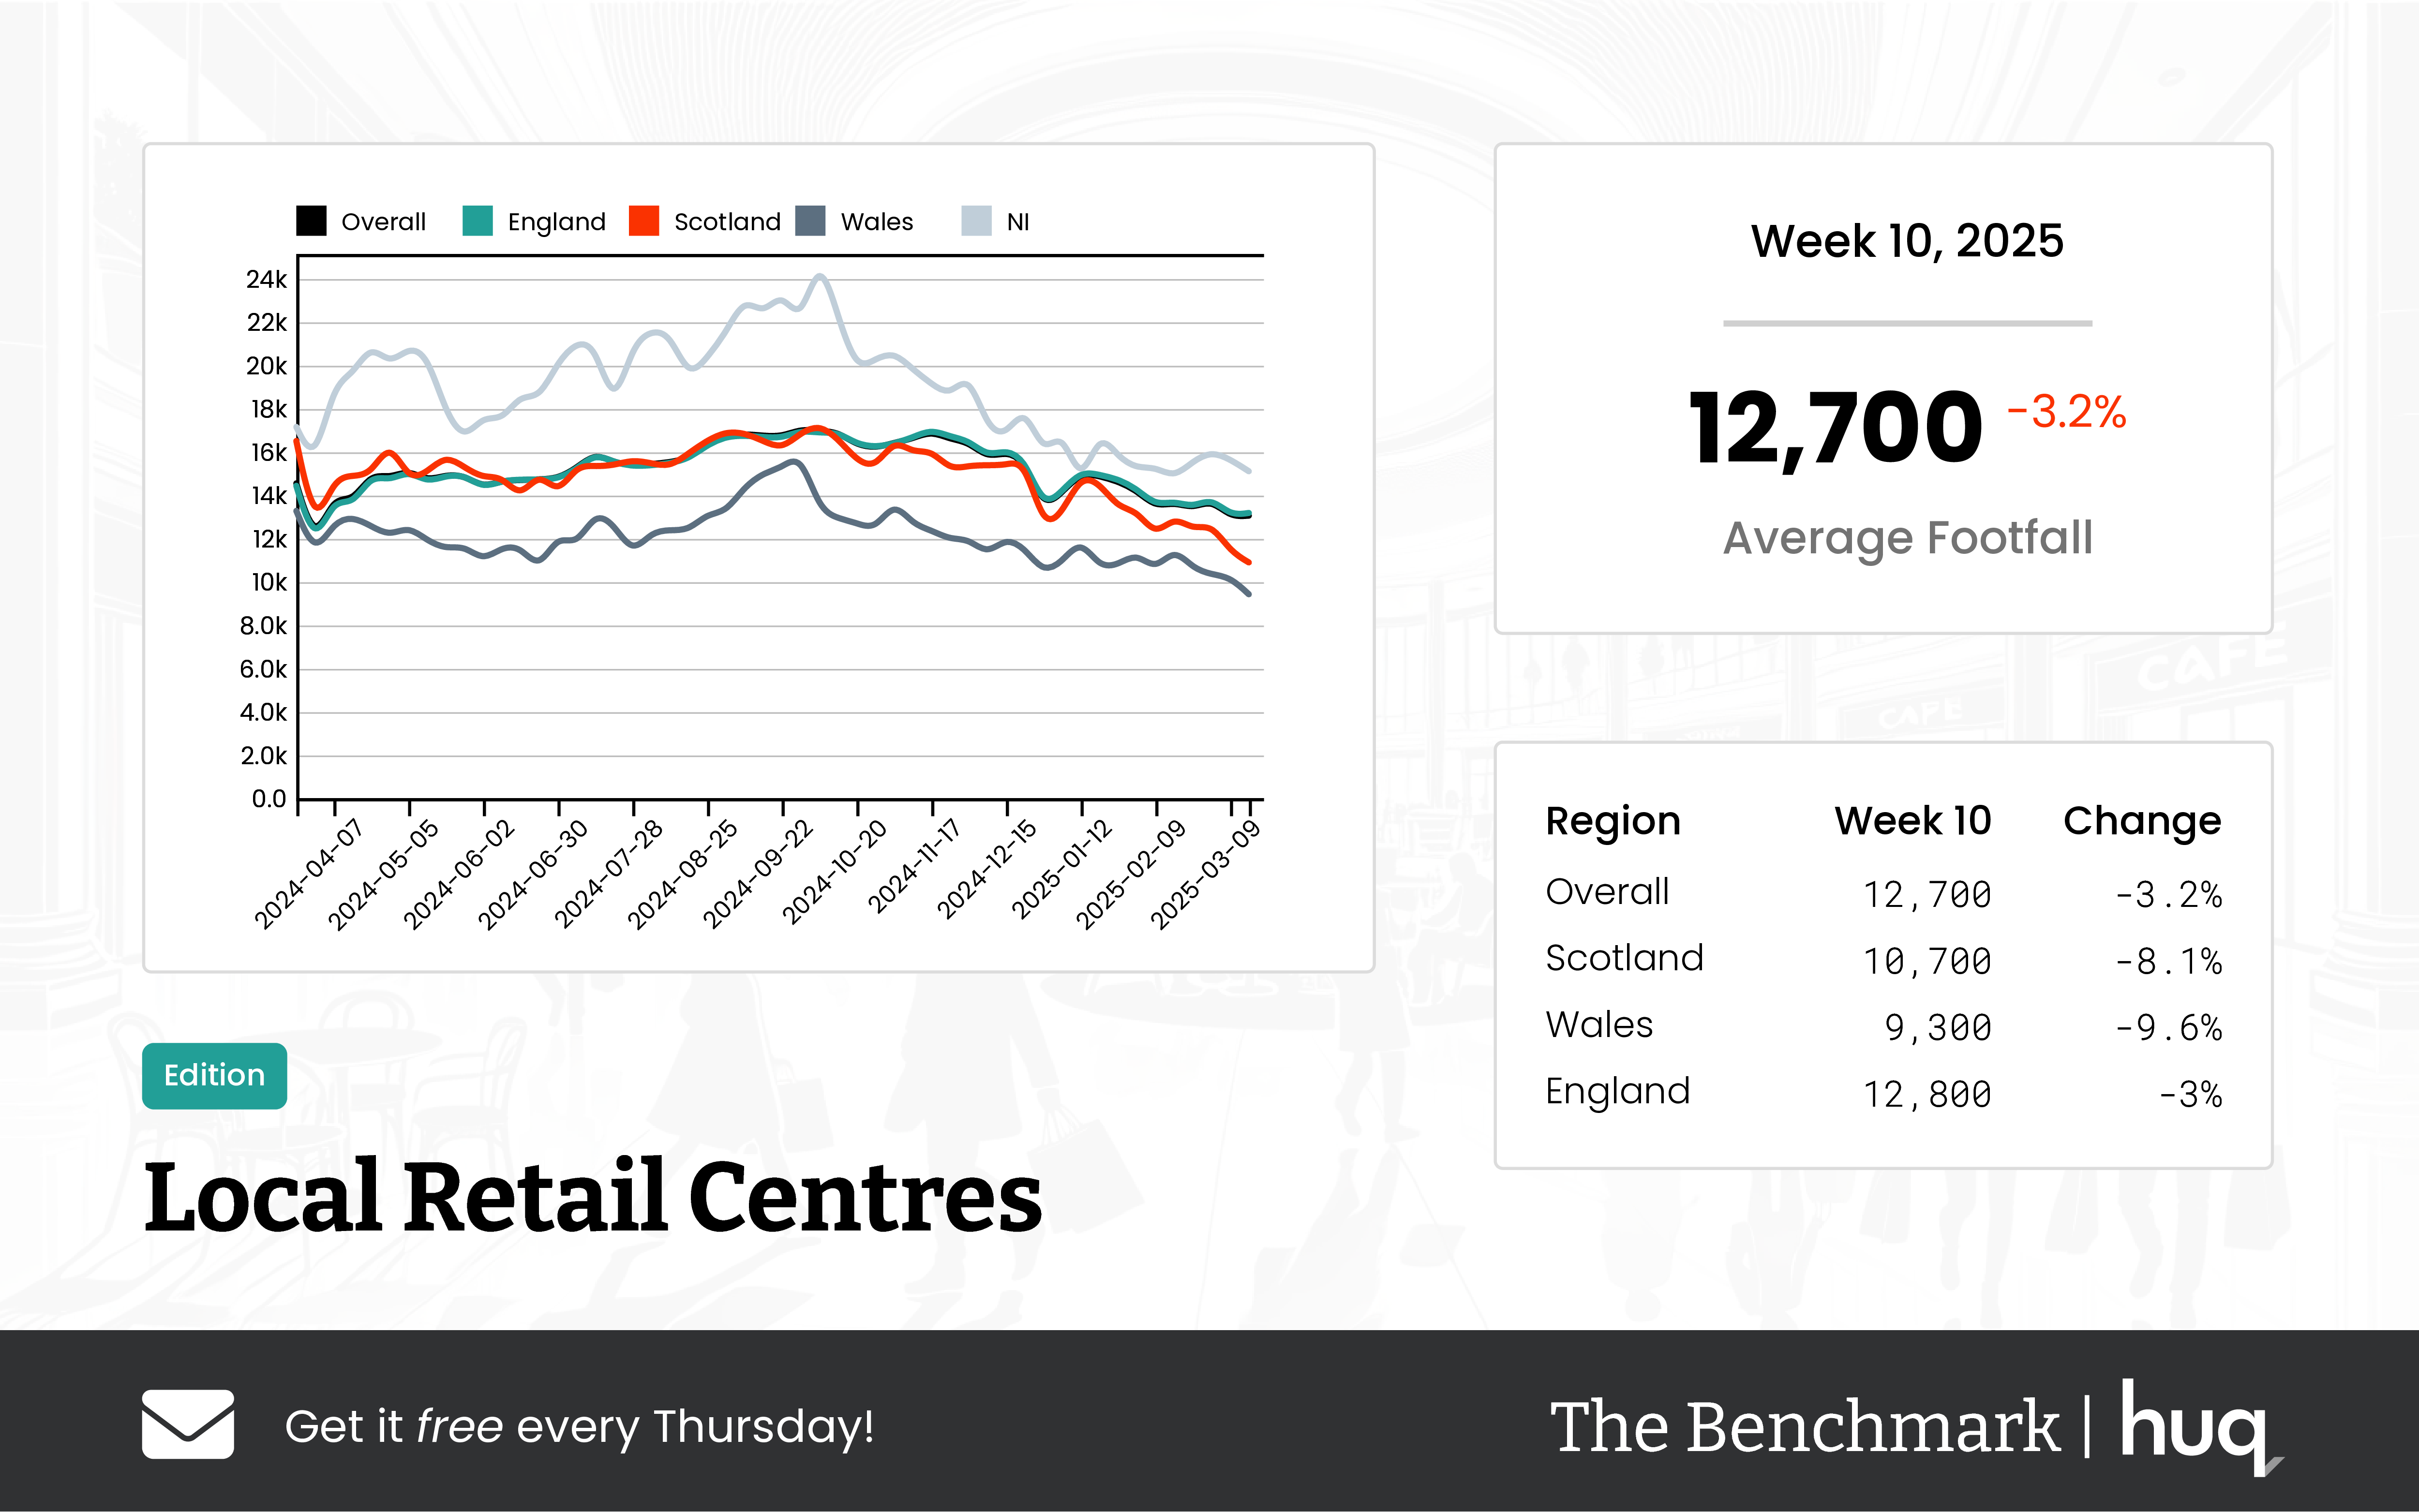
The latest figures from footfall data provided by The Benchmark show that UK Local Retail Centres experienced an average of 12,700 visits per day during Week 10, 2025. This represents a modest decline on a week-on-week basis as well as a lower overall performance compared to the same period last year. While fewer visitors are coming through the doors, those who do are spending more time on site, suggesting increased engagement as detailed by the footfall analytics.
Regional Performance
A deeper dive into the regional breakdown reveals significant differences. In England, retail centres recorded an average daily footfall of 12,800, marking only a slight dip over the week. However, Scotland’s centres took a more noticeable hit with an average of 10,700 visits per day—a decline nearly three times greater than that observed in England. Wales’s centres posted an average of 9,300 visits, mirroring Scotland’s challenges. Over longer-term comparisons, the decline in England has been relatively modest, whereas both Scotland and Wales have seen more pronounced long-term falls, underscoring region-specific challenges in footfall trends.
Dwell Time Trends
In tandem with the decline in visitor numbers, dwell time metrics provide additional insights into visitor engagement. Overall, the average visit duration increased modestly to 95 minutes in Week 10, 2025. Retail centres in England and Scotland enjoyed an uplift in dwell times, indicating that visitors are staying longer despite reduced footfall. In contrast, centres in Wales recorded a shorter average visit duration for the period. Compared to the previous year, the overall dwell time has witnessed a significant increase in England and Scotland, hinting at evolving visitor behavior and engagement patterns.
Industry Insights
Joe Capocci, a spokesperson for Huq Industries, commented on the situation: "While the marked footfall decline in Scotland and Wales is the most striking change, recent retail industry news adds weight to our observations." His statement suggests that broader industry trends could be influencing these regional discrepancies and reinforces the importance of adapting to new consumer behaviors.
Conclusion
As UK Local Retail Centres navigate these changing dynamics, the data underscores a shift in visitor behavior—fewer overall visitors, but an increase in the time they spend in-store. These trends may have significant implications for retail strategies and future planning as centres adapt to maintain engagement and drive business performance.
Media: For all media and press enquiries, please contact media@huq.io
About Huq Industries
Huq Industries is the leading provider of location intelligence across the UK, Europe, and the Middle East, specialising in delivering high-quality data insights on footfall, consumer behaviour, and retail performance. By leveraging advanced analytics, Huq Industries enables retailers and analysts to understand and respond to market trends effectively, ensuring they are well-equipped to navigate the changing landscape of high street and town centre commerce.
Get the latest intelligence Benchmark update each Thursday!
Sign Up NowFrequently Asked Questions
Clear answers to the most common questions about movement intelligence, retail expansion, and location analytics.
Related Blogs and Insights



.svg)
Empowering strategic teams with the world's most accurate and accessible location intelligence.
Contact

.svg)