.svg)
UK Shopping Centres – Week 10 Performance Update 2025: Location Analytics
UK shopping centres experienced a modest contraction with a 6.2% week decline and a 16.6% year reduction. Robust location analytics and footfall data indicate mixed trends.

March 20, 2025
2 min read
Table of contents
Overview
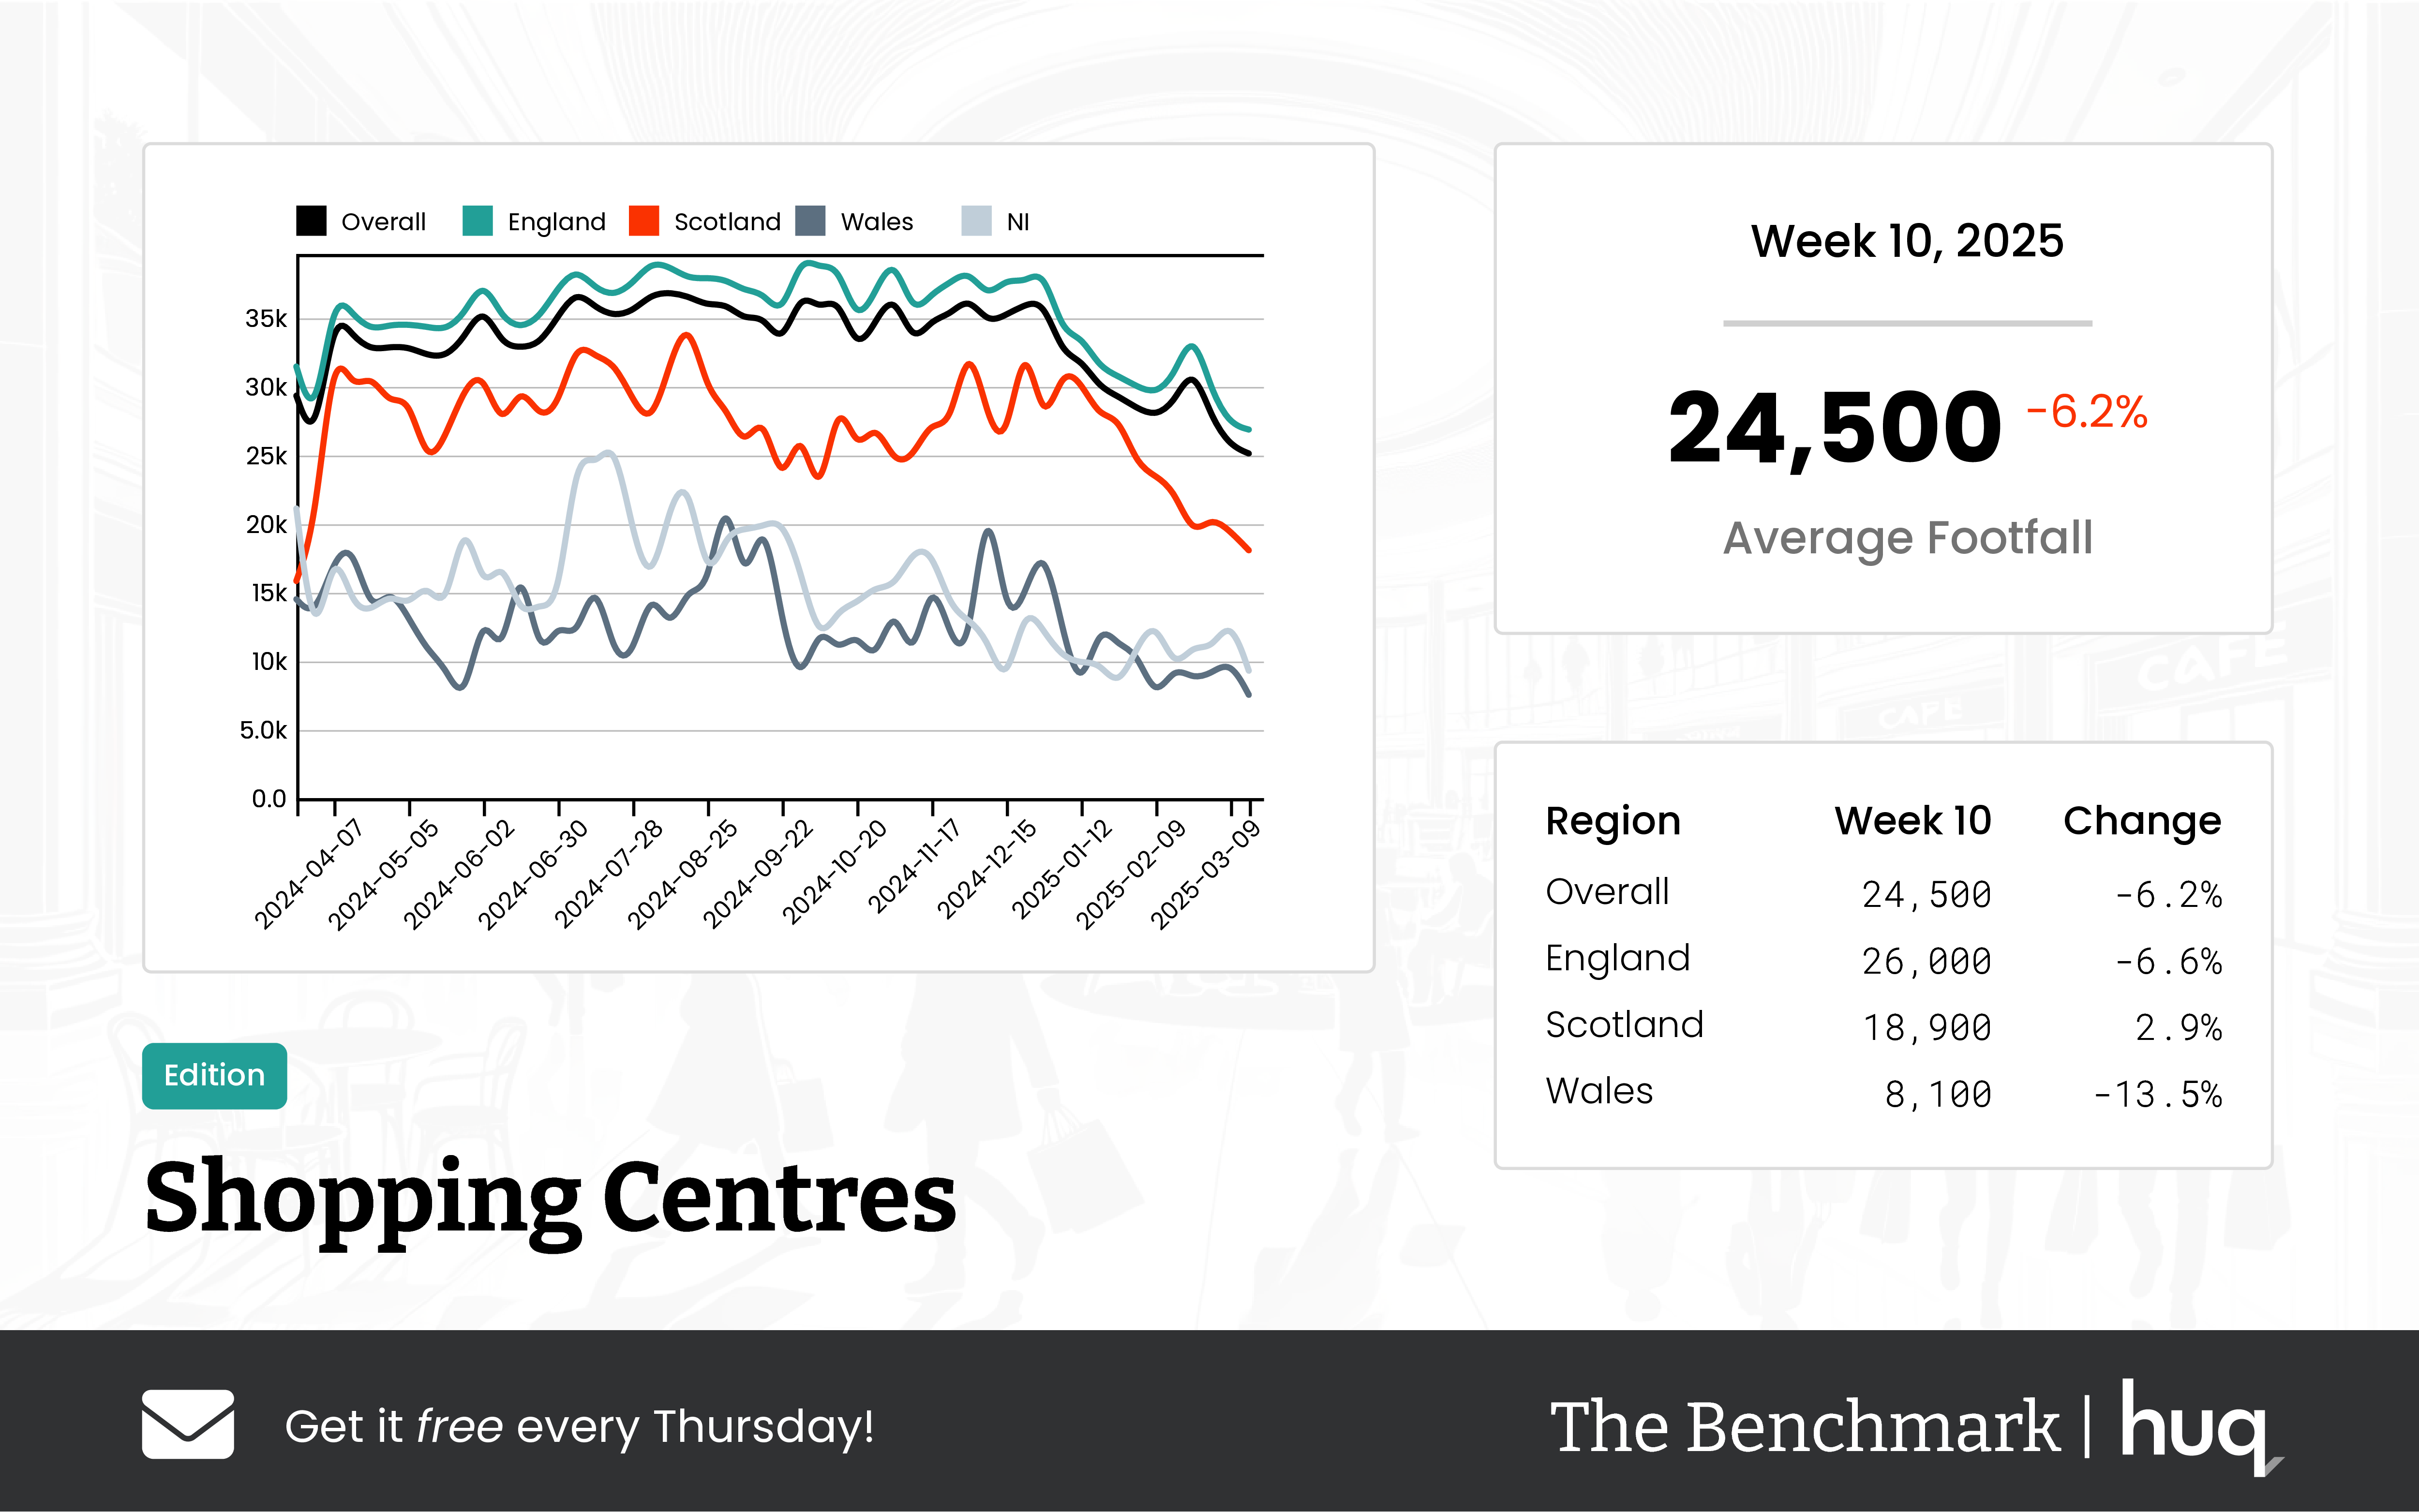
Recent data from The Benchmark, combined with detailed location analytics, provides a comprehensive briefing on the performance of UK shopping centres for week 10. The overall average daily footfall was reported at 24,500 visitors, reflecting a week on week decline of 6.2% and a year on year reduction of 16.6%. While these figures suggest a modest contraction compared to previous periods, a closer look at regional performance reveals a more varied picture.
Regional Performance
In England, shopping centres attracted an average of 26,000 visitors per day. This region experienced a week on week decline of 6.6% and a year on year reduction of 16.1%. In contrast, Scotland saw average daily footfall figures of 18,900, with a modest week on week increase of 2.9% and a nearly flat performance on a year on year basis, decreasing marginally by 0.7%. Welsh centres, however, faced tougher conditions with an average daily footfall of just 8,100. This region saw a significant week on week drop of 13.5% along with a notable decline in its year on year performance.
Visitor Dwell Time
Visitor engagement in terms of dwell time further underscores these mixed trends. Across all regions, the average visit duration was 109 minutes. This marked a 6.8% drop over the week, though there was a 13.5% improvement when compared to the previous year. In England specifically, shoppers spent an average of 112 minutes per visit—mirroring the overall trend while also indicating a sharp year on year increase in dwell time.
Scotland, on the other hand, showed lower engagement levels with an average visit duration of just 77 minutes, accompanied by a week on week drop of 14.4% and a significant annual decline. Conversely, Welsh shopping centres maintained high engagement levels, with visitors spending an average of 125 minutes per visit—a figure that saw impressive increases on both a weekly and yearly basis.
Comments from Industry
Joe Capocci highlighted these trends, noting, “Scotland’s modest uplift in footfall stands out amidst a broader decline, a trend supported by recent industry observations from retail centres facing challenges.” His statement underscores that while some regions remain resilient, others are still grappling with the effects of contracted visitor numbers.
As location analytics, footfall data, and dwell time metrics become more integral to understanding consumer behavior, stakeholders must keep a close eye on these varying trends to inform future strategies.
Media: For all media and press enquiries, please contact media@huq.io
About Huq Industries
Huq Industries is the leading provider of location intelligence across the UK, Europe, and the Middle East, specialising in delivering high-quality data insights on footfall, consumer behaviour, and retail performance. By leveraging advanced analytics, Huq Industries enables retailers and analysts to understand and respond to market trends effectively, ensuring they are well-equipped to navigate the changing landscape of high street and town centre commerce.
Get the latest intelligence Benchmark update each Thursday!
Sign Up NowFrequently Asked Questions
Clear answers to the most common questions about movement intelligence, retail expansion, and location analytics.
Related Blogs and Insights



.svg)
Empowering strategic teams with the world's most accurate and accessible location intelligence.
Contact

.svg)