Unlocking insights: where geo-spend meets footfall
Build certainty into every decision with real insight into geo-spend and footfall behaviour.
Book a demo
Make geo-spend and footfall your leading indicators for data-led decisions
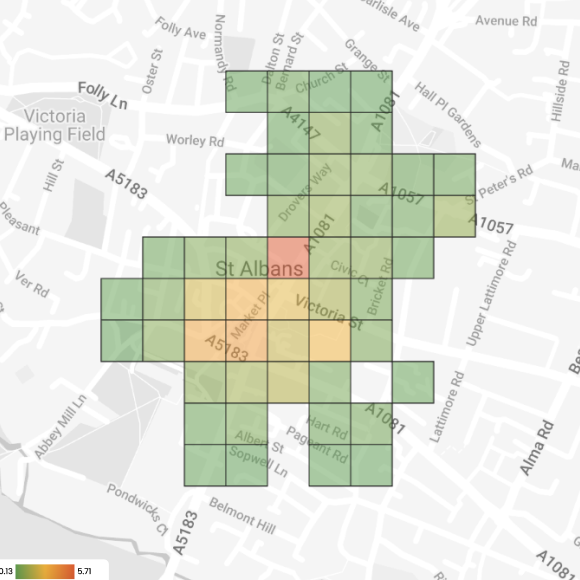
Integrating Mastercard’s aggregated and anonymised geo-based insights with Huq’s location insights lets you see exactly where consumers are going, how long they’re visiting and the geo-spend category dynamics of the location they’re in.
By understanding how your customers move and spend in an area, organisations can maximise revenue potential, optimise portfolios and identify development initiatives.
What data will you be able to see?
Indexed transaction data from 2019

Spend data across the UK including CDRC retail centres

Total spend index

Total transaction index

Total unique cards index
Spend by account index
Spend by transaction index
Transactions per account index
See how geo-spend data gives you the confidence to make data-led decisions effectively
Retail
Understand your retail performance against the wider market through footfall and geo-spend tracking
- Identify locations which have the right footfall and geo-spend characteristics to maximise revenue potential for your stores
- Truly understand your month-on-month performance by tracking total footfall and geo-spend across your store portfolio
- Optimise marketing and pricing strategies by knowing the customer and geo-spend profile and retail centre dynamics around your stores
Real Estate
Unlock the true potential of your real estate assets by using geo-spend and footfall trends to define space utilisation and tenant mix strategies
- Profile asset-linked footfall and geo-spend to identify brand repertoire in order to focus your tenant mix strategy
- Track total geo-spend and benchmark to other assets in order to understand relative asset performance
- Support rental valuations by understanding how footfall and geo-spend vary across and within your asset

Public Sector
Understand tourist and initiative-linked footfall and geo spend to develop prosperous communities
- Quantify the economic benefits of public sector actions and guide policymaking with footfall and geo-spend insights for local government and BIDs
- Prioritise infrastructure investments based on footfall dynamics and geo-spend levels

