
Footfall Data Shows London’s Resilience, Week 51
Weekly Wrap: UK Retail Footfall Insights: Week Ending January 4, 2025
Recent footfall data from Huq Industries reveals nuanced trends in footfall, dwell time, and weekday visitation across major retail centres in the UK. As of the week ending December 21, 2024, London shows a slight decrease in footfall week-on-week but maintains a robust year-on-year growth. The average visit dwell time in London has increased slightly from the previous week, indicating a higher engagement at retail venues. Conversely, the South West region experienced a slight decline in footfall and dwell time, reflecting regional variations in consumer behaviour. The data also highlights significant year-on-year increases in footfall in regions like Northern Ireland and Wales, suggesting a recovery or growth in retail activity in these areas. This comprehensive dataset underscores the dynamic nature of consumer mobility and its implications for retail strategies.
Major Retail Centres Daily Footfall

Footfall Data Analysis
The footfall report for London, as provided by Huq, indicates a nuanced picture of retail activity. Despite a slight week-on-week decrease, the year-on-year data shows a strong upward trend, affirming London’s resilience in the retail sector. In contrast, the South West’s footfall statistics reflect a more challenging environment, with both footfall and dwell time experiencing declines. This regional disparity underscores the importance of location intelligence in shaping retail strategies.
Location Intelligence Insights
Huq’s location intelligence analytics reveal that the average dwell time in London’s retail centres has increased, suggesting that visitors are spending more time per visit. This could be indicative of more engaging retail experiences or improved consumer confidence. Location intelligence data also points to significant improvements in footfall in Northern Ireland and Wales, highlighting these regions as potential growth areas in the coming months.
Market Outlook
Based on the current footfall statistics and historical data from this time last year, it is likely that London will continue to see stable footfall levels, with potential for slight increases. The South West may continue to face challenges unless new retail strategies are implemented. The positive trends in Northern Ireland and Wales suggest that these regions could experience continued growth in retail footfall, supported by effective location intelligence strategies.
Partner with Huq
Track consumer footfall and spend dynamics across your store network using Huq data and compare to your own sales data. Gain insights into crucial questions such as ‘are we out-performing the market’, ‘where our similar locations for new store growth’, and ‘how healthy is this retail centre’.
If you are interested in basing your location insights to actual consumer behaviour then please connect with our team.

Weekly Wrap: UK Retail Footfall Trends: Diverse Regional Dynamics, Week 51, 2024
Weekly Wrap: UK Retail Footfall Insights: Week Ending January 4, 2025
Recent footfall data from Huq Industries highlights nuanced trends across various retail centers in the UK, reflecting the dynamic nature of consumer mobility and its implications for retail strategies. As of the week ending December 21, 2024, London shows a slight decrease in footfall week-on-week but maintains robust year-on-year growth, while regions like Northern Ireland and Wales exhibit significant increases, suggesting recovery or growth in retail activity.
Daily Footfall by Retail Centre Type

Major Retail Centres in London
In London, despite a slight week-on-week decrease, the year-on-year data shows a strong upward trend, affirming the city’s resilience in the retail sector. The average visit dwell time in London has increased slightly from the previous week, indicating higher engagement at retail venues. This data underscores the importance of location intelligence in shaping effective retail strategies. For more details, see the full report on London’s footfall data.
Retail Parks Across the UK
Retail parks show a mixed bag of results with some regions experiencing slight declines in footfall while others see improvements in dwell times. For instance, Yorkshire and the Humber saw a slight week-on-week decrease in footfall by 0.7%, but the average visit dwell time increased by 5.2% from the previous week. Conversely, the South West experienced a 2.3% decrease in footfall week-on-week. These regional variations highlight the dynamic nature of retail park visitation in the UK, influenced by a range of factors from local economic conditions to seasonal changes. More insights can be found in the Retail Parks Footfall Report.
Local Retail Centres
Local retail centres also reflect subtle yet significant shifts in consumer behavior. Most regions have experienced a slight decrease compared to the previous week, with the South West showing the most significant drop. However, London stands out with a slight increase in footfall year on year, suggesting a resilient consumer base in the capital. Detailed analysis is available in the Local Retail Centres Footfall Report.
Shopping Centres Dynamics
Shopping centres across the UK show a mixed picture with some regions experiencing growth while others face declines. London has seen a significant increase in average daily footfall year on year, reflecting a robust recovery in consumer confidence and spending in the capital. More details on these trends can be found in the Shopping Centres Footfall Report.
High Streets and Town Centres
High Streets and Town Centres have shown varied trends across the UK. The West Midlands, for instance, saw a slight increase in average daily footfall, while Wales experienced a notable decrease in footfall, with a 28.2% drop year-on-year. These insights are crucial for understanding regional consumer trends and adapting strategies accordingly. For more information, see the High Streets and Town Centres Footfall Report.
Market Outlook
Based on the current footfall statistics and historical data from this time last year, it is likely that London will continue to see stable footfall levels, with potential for slight increases. The South West may continue to face challenges unless new retail strategies are implemented. The positive trends in Northern Ireland and Wales suggest that these regions could experience continued growth in retail footfall, supported by effective location intelligence strategies.
Partner with Huq
Track consumer footfall and spend dynamics across your store network using Huq data and compare to your own sales data. Gain insights into crucial questions such as ‘are we out-performing the market’, ‘where our similar locations for new store growth’, and ‘how healthy is this retail centre’. If you are interested in basing your location insights to actual consumer behaviour then please connect with our team.
Partner with Huq
Track consumer footfall and spend dynamics across your store network using Huq data and compare to your own sales data. Gain insights into crucial questions such as ‘are we out-performing the market’, ‘where our similar locations for new store growth’, and ‘how healthy is this retail centre’.
If you are interested in basing your location insights to actual consumer behaviour then please connect with our team.

Was Black Friday 2024 a Success? Insights and footfall trends from Huq
Black Friday 2024: Insights and footfall trends from Huq
Black Friday remains a key event in the UK retail calendar, but its impact has evolved significantly over the years. While some retailers saw footfall spikes during the week ending 30th November 2024, others struggled to attract shoppers, particularly in local retail centres and retail parks. Using Huq’s location footfall data, we explore how this year’s Black Friday performed and what it means for the retail sector.
Key takeaways
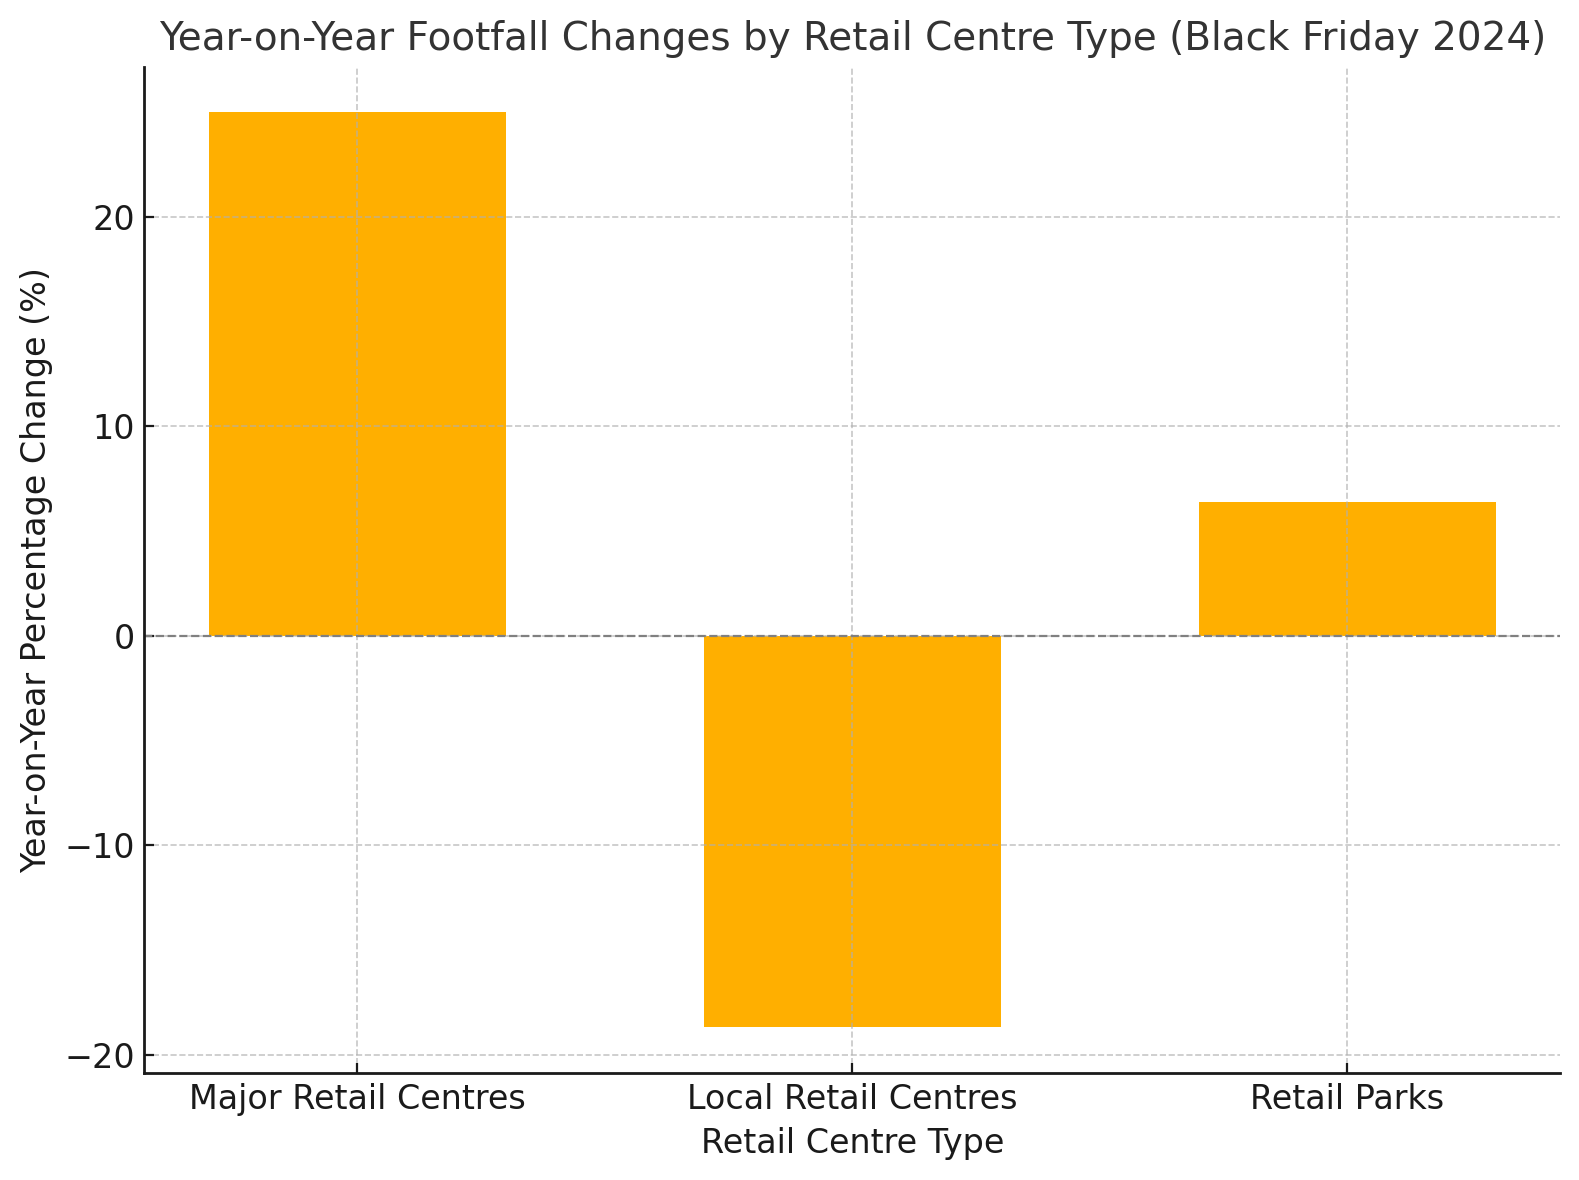
Major Retail Centres Dominate
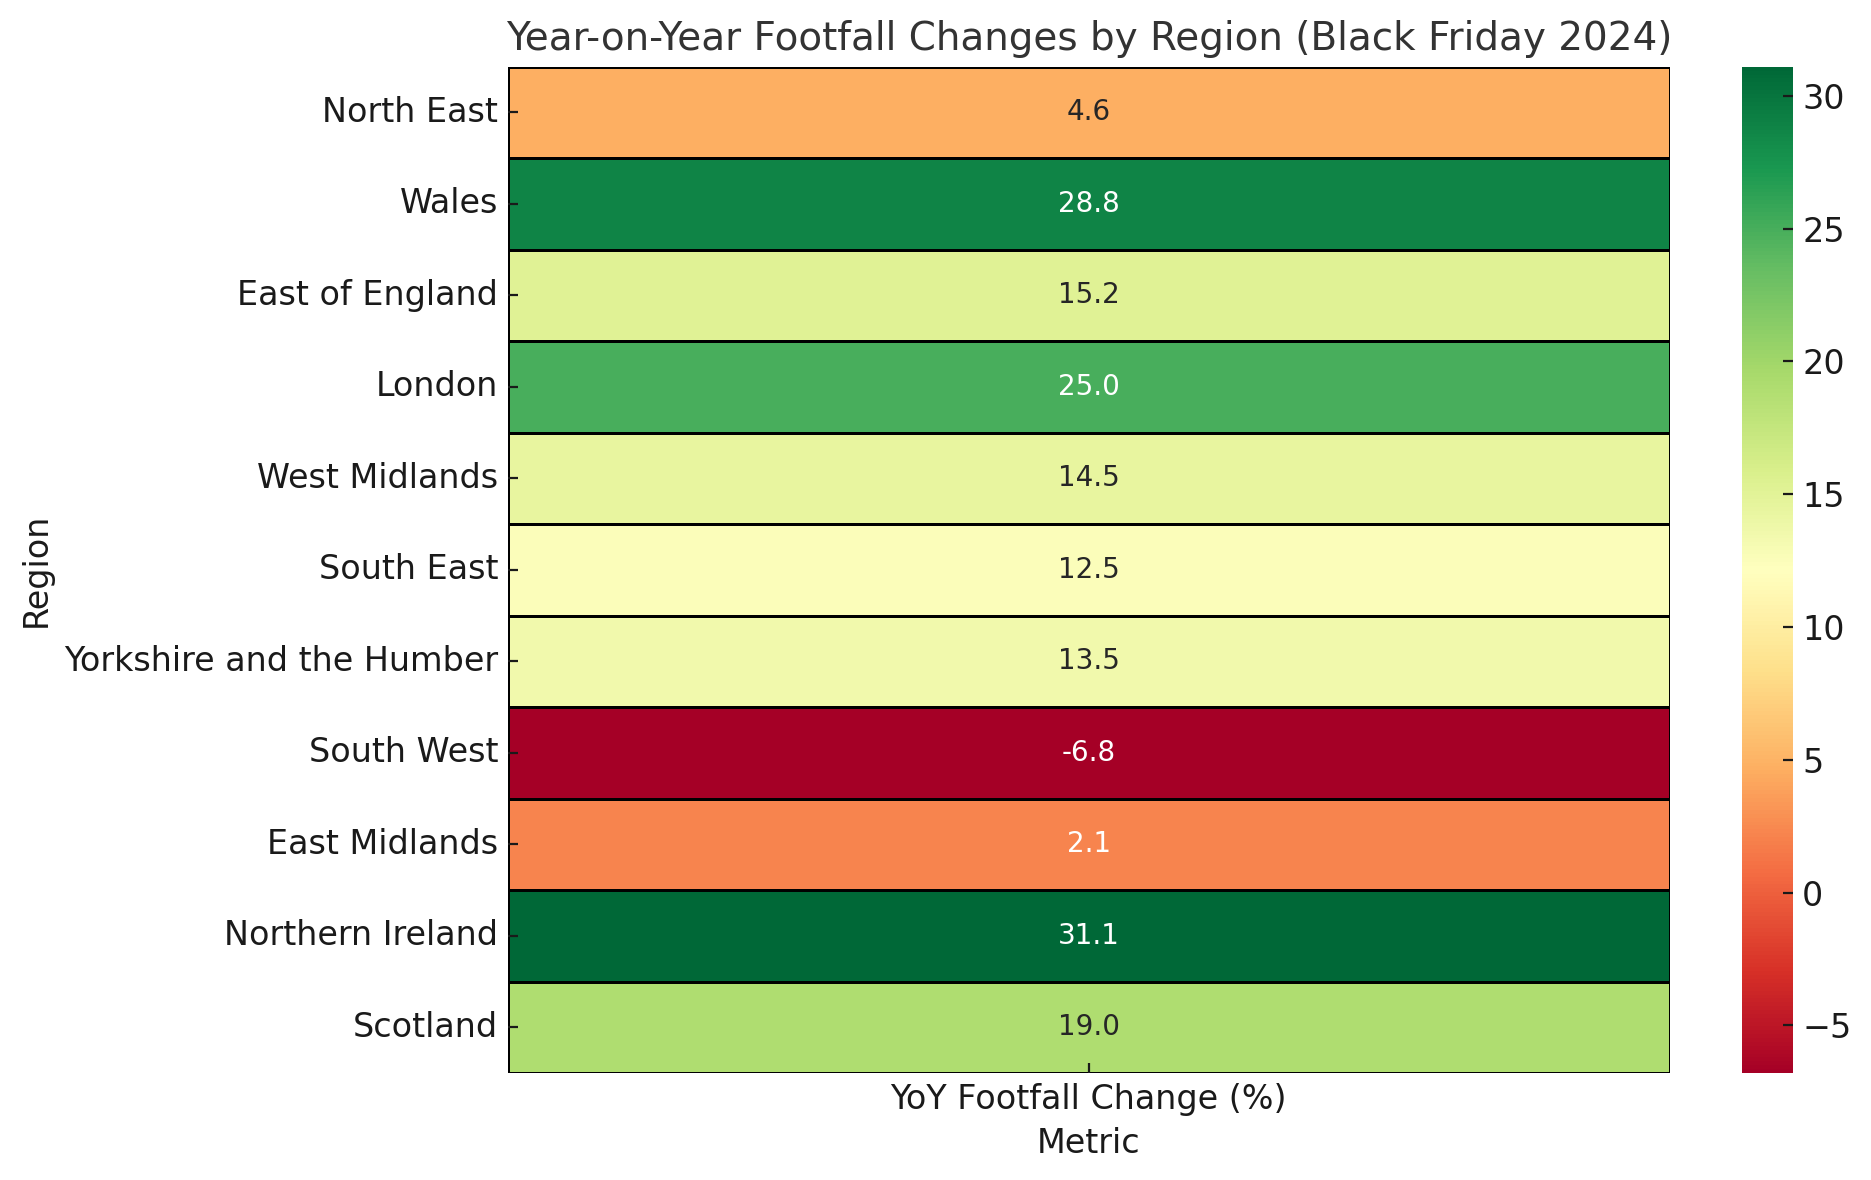
London, East of England and Wales all saw significant footfall growth (25%, 29% and 15%).
Retail Parks & Local Centres Lag
Local centres struggled to keep pace while retail parks showed mixed results. Wales experienced a footfall drop across both retail centres.
Changing Shopping Patterns
Despite overall gains in some regions, several retail centres saw limited growth or declines, hinting at a growing preference for online shopping or consolidating trips to larger hubs.
Analysis of the Data
Winners of Black Friday 2024
Major retail centres clearly outperformed, suggesting that shoppers are still drawn to flagship locations for Black Friday deals. In London, Kingston upon Thames recorded one of the highest week-on-week (WoW) increases at 2.2%.
Retail parks, although mixed overall, had standout performers like Mannington Retail Park in Swindon and Battery Retail Park in Birmingham, both reporting 14.3% WoW growth.
Shoppers hunt for the best deals during Black Friday 2024, a day that brought mixed fortunes for UK retailers.
Challenges in Smaller Locations
Local retail centres and some high streets faced challenges. Harlow and Basingstoke were among the worst hit, with WoW declines of 13.3% and 13.2%, respectively. Retail parks like Heathfield Retail Park (Scotland) also saw footfall drop by 16.6% WoW.
Shoppers in these areas may have shifted online or opted for larger destinations, highlighting a potential gap in Black Friday marketing and promotions for smaller locations.
The Role of Dwell Time and Visitation Trends
Interestingly, average dwell times in major retail centres remained steady or grew in regions like London (104 minutes, up 3% WoW) and the East of England (123 minutes, up 0.8% WoW). This suggests that while footfall trends varied, those who did visit spent more time shopping.
Recommendations for Retailers
Double Down on Flagship Locations
Retailers in major centres should continue to capitalise on Black Friday momentum by optimising staffing, inventory, and promotions.
Reimagine Strategies for Local Centres
Local retail centres must explore personalised marketing campaigns, events, or partnerships to attract shoppers during key retail events.
Leverage Footfall Data
Retailers can use location intelligence, such as Huq’s data, to better understand shopper trends and tailor their strategies for future events.
Conclusion
Black Friday 2024 showcased a polarised retail landscape. While major hubs like London excelled, smaller locations struggled to maintain relevance where Black Friday failed to generate the universal footfall surge retailers might have hoped for. The mixed results could reflect changing consumer behaviours, with many shoppers favouring online deals over in-person visits. Additionally, economic pressures such as inflation may have dampened discretionary spending, further diluting the impact of in-store promotions. While Black Friday delivered isolated successes, the broader picture indicates that it did not achieve a consistent boost to UK retail footfall. This suggests the need for retailers to rethink their strategies, blending online and offline offerings to fully capture consumer interest during major sales events.
“This year’s Black Friday highlights the continued draw of major retail centres and the shifting preferences of consumers. Our data reveals that while flagship locations thrive, smaller retail hubs must adapt to compete effectively in a changing landscape.”
Is your business facing similar challenges?
Our experienced team can demonstrate how to use location intelligence and analytics to augment a wide range of use cases, including:
- Identifying locations for new stores
- Optimising your existing store portfolio
- Informing your pricing strategy
- Improving the effectiveness of marketing
- Benchmarking performance across locations
- Understanding competitor landscape
- Optimising opening hours
Ready to get started? Speak to one of our location experts

Revitalising Marble Arch: The Implications of M&S’s Redevelopment for Oxford Street and Beyond
Revitalising Marble Arch: The Implications of M&S’s Redevelopment for Oxford Street and Beyond
The much-anticipated redevelopment of the Marks & Spencer flagship store at Marble Arch has been given the green light by the Secretary of State for Housing, Communities and Local Government. After a three-year wait, this decision marks a pivotal moment for Oxford Street – and by extension, London’s West End – to reclaim its stature as a global shopping destination.

A Bold Step Toward Revitalisation
M&S’s CEO, Stuart Machin, described the approval as a milestone, highlighting the project’s potential to rejuvenate Oxford Street through a flagship store and office space that will support 2,000 jobs. Machin’s statement underscores the urgency of revitalising Oxford Street, where footfall has been struggling to recover to pre-pandemic levels. Huq’s location data reveals that November 2024 brought 2.3 million visitors to the Marble Arch area, contributing to a year-to-date total of 21.6 million visitors. Despite this rebound, 2024’s figures remain below the 25.4 million total recorded in 2023.
With vacancy rates on Oxford Street still hovering around 15% – three times pre-pandemic levels – and footfall down 30% from 2019 levels in Marble Arch, the redevelopment could be a catalyst for the area’s recovery.


The redevelopment of M&S’s flagship Marble Arch store marks a significant shift in Oxford Street’s landscape. This transformation reflects a broader trend in urban redevelopment, balancing heritage preservation with the need for modernisation and sustainability.
The Retrofit vs. Redevelopment Debate
M&S’s Marble Arch redevelopment has sparked considerable debate, particularly around sustainability. Critics have questioned why a retrofit wasn’t chosen, citing concerns about embodied carbon and the environmental cost of demolition. However, M&S’s extensive studies – including a whole life carbon assessment by environmental consultants Arup – highlight that retrofitting the site would have been untenable. The complexity of the existing structure, comprising three disparate buildings, posed insurmountable challenges to achieving the functionality and sustainability standards of a modern flagship store.
The new design promises to use less than a quarter of the energy of the current structure, recover 95% of existing building materials, and achieve carbon payback within 11 years. These figures position the project among the top 1% of sustainable buildings in London, addressing concerns while setting a new benchmark for green development.
Retail and Real Estate Implications
Retailers and real estate stakeholders have much to gain from the redevelopment. Savills had previously warned that the closure of M&S at Marble Arch would be catastrophic for the local retail environment. By contrast, the new store – combined with investments from IKEA, HMV, and Uniqlo – could solidify Oxford Street’s resurgence. These developments, coupled with plans to pedestrianise the street, signal a brighter future for one of London’s most iconic shopping districts.
“While this redevelopment is a promising step forward for Oxford Street, it’s vital to remember that footfall recovery is a marathon, not a sprint. The addition of a sustainable and modern M&S flagship store could serve as a cornerstone for the area’s revitalisation. However, for the full benefits to materialise, continued investment and strategic planning from both the private and public sectors are essential. By fostering a mix of retail, leisure, and public space, Oxford Street can not only reclaim but redefine its position as a global retail destination.”
Conrad Poulson, CEO, Huq Industries
CEO
A Long-Term Vision for Oxford Street
The redevelopment of M&S at Marble Arch is emblematic of a broader shift toward sustainability and innovation in urban retail environments. While the retrofit vs. redevelopment debate continues to generate discussion, the project’s long-term environmental and economic benefits are undeniable. With its ambitious plans for sustainability and community integration, the M&S Marble Arch redevelopment could be the catalyst needed to transform Oxford Street from a struggling high street into a thriving, modern hub.
For retailers and real estate investors, this project offers a case study in balancing heritage preservation with the demands of modern commerce. It also highlights the critical role data plays in understanding and shaping urban environments. As footfall in Marble Arch continues its recovery, stakeholders must remain proactive to ensure that the momentum generated by this redevelopment is sustained for years to come.
Revitalising High Streets: How Location & Spend Data Support Economic Development
How Location & Spend Data Support Economic Development
In this webinar we explore how local authorities and BIDs can use footfall and spend data to understand visitor behaviour, footfall patterns and location dynamics to make informed, data-driven decisions about the high street and local town centre. Watch the full webinar to understand how footfall and spend data can drive economic growth and resilience.
Benchmark with Comparative Insights
Focus on initiatives that have proven successful in comparable locations to maximise impact without unnecessary trial and error.
Understand Visitor Origins and Behaviours
Tailor marketing campaigns and initiatives to attract high-value or repeat visitors, ensuring resources are used efficiently.
Optimise Seasonal Strategies
Use footfall data to understand whether extending opening times or diversifying offerings during traditionally quiet months could yield positive returns that align with consumer priorities.
Plan Future Initiatives with Local Insights
Review data outputs to determine future initiatives, rather than just analysing past performance, to make resource-constrained decisions more effective.
Revitalising High Streets: How Location & Spend Data Support Economic Development
Mark: Welcome to today’s webinar Revitalising the High Street: How location and spend Data Supports Economic Development.
My name is Mark Freeman, and I’ll be guiding you through today’s session, which is all about how data driven insights can transform decision making across the local government sector. As we face increasing challenges like the rising cost of living, tightening consumer spending and business uncertainty around investment, understanding where and how people are interacting with place and space is becoming increasingly influential for initiatives designed to support local businesses as well as help communities flourish.
Today, we’re all going to be exploring how combining footfall and spend data can provide a holistic view of local economic activity helping the audience, identify, monitor and validate those initiatives that drive growth and community engagement.
We’ve got a great lineup of speakers for you today. They’ll be sharing their expertise, and a few real world examples in there with a great one at the end from Joel. But first, a brief introduction from me on who those speakers are. We have Gary Beaumont, Transport and Data Manager at Hertfordshire County Council. We have Joel Doherty, Vice President of Product Management at Mastercard and finally, Conrad Poulson, CEO of Huq. I’ll now pass over to Gary, who will do a fuller intro, followed by Joel and Conrad.
Gary: Hi, good morning, everybody. I’m Gary Beaumont, I’m the Transport Planning and Data Manager at Hertfordshire County Council and I sit within the growth and infrastructure unit here. I’ve got about 16 years of experience at Hertfordshire, where I’ve been instrumental in establishing a foundation for data driven and evidence led decision making.
My work is focused on embedding a culture of monitoring and evaluation, which allows us to measure success and just as importantly, data to learn valuable lessons about what works and what doesn’t.
Joel: Joel Doherty with Mastercard. As Mark has indicated, I lead the product management side of the business around all of our transaction data. So think of Mastercard not as much as a credit card company for the sake of today’s conversation, but also a data company where we look at all of the types of insights and analytics that we can glean from consumer credit card transactions and the stories that we can uncover. My team globally builds up different solutions, different products, different insights, certainly for the public sector as well as other sectors including financial institutions, merchants and other industries alike.
Conrad: Good morning, everybody. Conrad Poulson, CEO of Huq. Huq measures footfall by harnessing location data from mobile phones to provide detailed understanding of how populations use the built environment.
Currently, we provide insight data to over 90 local authorities and BIDs in the UK and our data helps these organisations to unlock funding and accurately measure the impact of their initiatives, practises and policies.
So, as a company, we’re fanatical about sourcing the very highest data quality and we’re going to explore today how and why we work with Mastercard in that regard.
In terms of our own data, that powers our products and as a result, our products enable customers to understand far more than just footfall, which we’re going to get into more detail throughout the course of the webinar.
Mark: Great stuff. So a full agenda today, we’ll be moving through. I just want to highlight, this will be a recorded session. So naturally, we’ll be sharing that to the attendees today.
There’ll be a Q&A session at the end. So please do submit any questions that you have as we go along, we’ll try and coordinate a good list of questions at the end and tackle those, by theme. This is your chance to ask the experts in the room on how they can potentially give you insights into a particular initiative or project that you’re thinking of, or general themes and problems. So do pose those questions where you can. Right, so we are going to move into the start of the conversation now. The way to kick this off is to just explore and expand on what we mean by spend and footfall data, and as well as draw upon the value that they bring when combined.
As well as the overview that they bring to the audience that we have today, thinking about local government and BIDs, where’s that value in this data in your world?
As we covered in the intro to this webinar now, more than ever, it’s crucial to really understand where footfall is higher, lower, where people are spending, and how this is changing over time. It can be indicators of health vitality, it can be indicators of project impact, or the need for investment or change. These insights they’re becoming increasingly vital for everybody on this call today, with the mission of driving community engagement, supporting the local economy and attracting visitors into their areas, these data points are increasingly essential. As effectively truth data points that you can leverage to support your initiatives.
Given this context, can you tell us more about transaction data and why understanding consumer spending behaviour is becoming more important for local governments and BIDs? (11:13)
Joel: The value and importance of transaction data is often underlooked and underscored.
It is an incredibly rich data set that helps us understand exactly how consumers do spend, but more importantly, how they go about those spending decisions.
When we think of the transaction data that’s derived from all of our Mastercard credit card transactions, it helps us truly understand not just how much a consumer might spend, but where they spend? How far did they come to make that purchase? Were they close to home, or was it more of a transient purchase they did on their travels? What types of merchants do they seem to have affinities for? Where do they spend more of their discretionary spend than not?
It can paint a complete customer journey and tell us an incredible amount of information about not just where people spend, not just how much they spend, but all of the other context around those decisions that help shed a lot of light on the types of questions and hypotheses that we know that the councils and the public sector stakeholders are looking for.
Why is combining footfall and spend data such a valuable tool and why did you bring Mastercard into the Huq partner network? (12:52)
Conrad: Following on from Joel’s point, a single data set often only tells part of the story. So rich though we know our mobility data is and all of the insights that we can offer about how many people are visiting an environment and where they come from and how long they stay, that’s really just one lens and to really understand how a space is being used, what the real potential for that space is, you really need to combine it with other data sets.
Data quality is absolutely essential. We’re acutely aware that there are policies and initiatives being based on the products and services that we offer to our customers in the public sector and those have societal and economic impact. So it’s incredibly important that you can rely on the underlying data that’s providing those insights. So clearly, Mastercard is a fantastic partner for that. They have the quality of the data and the breadth of the data that we know is so essential to provide that. That consistency is what was critical when we decided to work together.
Joel: Just to add that, that combination of footfall and purchase data, it does help tell the whole story. You can imagine that if you just had one view versus the other that you might understand that people are visiting different locations, but they’re not making those spend decisions, or conversely, they’re making spend decisions but you don’t know what other types of journeys and visits that they’re making.
If you don’t combine those two things, you could put yourself on a path to making some very misguided decisions and really relying on work, as opposed to the veracity and strength of that data set.
Why should local government be leveraging that spend and footfall data when it comes to some of those key decisions that they're looking to make? (15:20)
Gary: Data is absolutely crucial because it drives evidence-based decisions which leads to the best possible outcomes. It allows us to document and learn from our actions, helping to minimise mistakes in the public sector, particularly where transparency and accountability are paramount. Data enables us to justify our decisions to the public that ultimately we serve.
It’s really key that we get that right.
Mark: Hopefully that’s demystified a little bit what footfall data is. The key bits that really stand out as being impactful and how that can start to help you in your sector and work towards a solution with you and your initiatives.
What we’ll quickly do is we’ll move on to start to think about the applications of it and where the value is. This section will cover how this data can be used to help secure funding, to justify investment and initiatives. Local councils and BIDs, often require clear, actionable insights that support those applications and good insight into the why, the problem, the issue.
It has to demonstrate the potential tangible impact of any public spending on local economies and urban development.
If the objective or the task at hand is about driving visitation and driving change in spend, then it naturally follows that the data that showcases this is clearly vital and that does feel to be a core component of much of the development initiatives that are happening out there.
However, what a lot of our attendees will feel today is understanding how residents and visitors interact with public spaces and retail centres is a challenge. It’s got a cost to it. It’s problematic; accuracy, timing, all of those things combined as well as constrained budgets. It’s a tough data point to acquire, but a really impactful one if we can.
Today we want to give you that intro into how it can be used and that footfall and consumer spend data when you can access it and you can apply it, it will give the most accurate picture of your communities and showcase real world behaviour. It’s those near real-time insights that give you the targeted validation that you’ll need for your change led initiatives.
Many of our clients say it's great to have spend data and see where consumers are actively spending and increasingly not spending. How can councils and BIDs get the most out of spend data to ensure that it drives impactful and measurable outcomes? (13:15)
Joel: It always comes down to the quality and simplicity of the use cases that you’ve defined. I’ll give you a couple of real world examples. One is around Wembley Stadium in the United Kingdom, where the hypothesis was that the traffic going to some of the events at Wembley were not putting as much of a burden on the public transit system as was expected.
We used Mastercard data to actually look at all of the activity that event goers who are off to Wembley to watch the football game were partaking in. Were they coming in the night before and staying in a hotel? Were they spending in restaurants before the match or were they spending in the pubs after the match? Were they in fact coming in public transit or were they perhaps travelling and taking private parking?
When we looked at all of those elements of the way people were moving, the way people were spending, it did highlight a few gaps on the public transport, infrastructure, where larger pockets of consumers were coming from for that particular event and provided for some additional investment of planning longer term to support that. On an economic development front a similar situation has arisen where Mastercard and footfall data plays a role.
This happens to be not specific to the UK, but through the World Economic Forum we’re looking at a project today we’re working on, where a football club has actually picked up and left town and they’ve gone. They’ve left a real hole, basically in the city centre.
The study is to very quickly leverage the data to identify what other merchant opportunities should we bring to that core that will bring back that same segment of customers, help stimulate similar amounts of spend and effectively create a bit of a new economy where the football economy has picked up and left. The data is telling us very clearly who those consumers are, what they’re looking to spend on, the times of days, the days of week and putting all that together is helping create a revitalisation plan for that downtown core.
Mark: There are some great examples there, thank you, Joel. It certainly touched on some of those bigger projects and experience that Mastercard have already, having dealt with and partnered with across the world. There’ll be some more examples as we go through this webinar.
Can you elaborate on the visibility piece and how it helps local governments and organisations evaluate and enhance their initiatives to gain better understanding of local areas and communities? (21:21)
Joel: That visibility word in the context of data provides for two related topics. One, the visibility of data should be a constant. You’ve pointed that out, as did Conrad. That’s a critical point because sometimes we don’t know what’s going to happen when it does happen.
We’ve done some studies with some of the councils in the United Kingdom, anticipating heat waves and understanding what impact the heat wave had on merchants and in different parts of the community.
The ability to visualise or have visibility down to more granular segments of the council’s more granular geographies, does become more critical. It also becomes much, much more difficult.
The ways in which we think about how to treat the data and how to provide the data at a very granular level, are carefully designed. They provide incredible power where I can now start at the state or region level, understand some of the dynamics that are going on from a spend, a footfall, a growth opportunity perspective. Then I can drill down to the council and I can drill down to the high street and look at what’s going on within a few blocks of the high street. When you start to analyse what’s possible at that level and truly understand it, the impact on your decision making, your council planning, all of those things are dramatically impacted in a positive way.
The only other comment I’d make around visibility, is really tied to the concept of visualising the data as well. We all have far too much data to consume today. That is a fact.
The only ways in which we can as human beings properly interpret the data, is if two things exist. Number one, some context around what it is I’m trying to extract from that data. That’s why I lean on the comment around use cases being well defined. The second is the opportunity to visualise that data so that I can interpret it effectively and typically in real-time.
That doesn’t necessarily mean a whole bunch of charts and graphs and dashboards all the time.
It can mean different ways in which that data can be visualised based on the best ways in which you can interpret that data. The whole visibility question is one about granularity, but it’s also one about how do you interpret the data at whatever level of granularity you may be at and the visual cues become absolutely a must.
Mark: That was a great point around data complexity and data volume as well. Lots of departments are juggling lots of data sets and the goal is to find that commonality and that buy in and that belief; something that is really linking into what is actually happening on the ground. As soon as you start to leverage that in the initiatives and strategies that you’re undertaking and implementing, that traction just builds and builds.
What are the practical steps that the BID managers can take to integrate data into their funding proposals? (16:26)
Conrad: The opportunities and building on Joel’s point, is to use the data to look at a much longer term view. Often the challenges that we see is that people come to us and say “Right, okay, I need this data to validate an idea that I’ve already formed or an initiative that we’ve already undertaken”. That’s completely valid, of course. But what tends to happen through the course of that exploration of the data, is that the data itself reveals where the opportunities are. The data itself reveals, these are the changes you could make, this is what can happen. In terms of that practical application of the data, we advocate that you start much earlier in the process because it plays a part in informing what you could or should do.
Secondly, it’s also the long term changes. The types of behaviours that we’re talking about measuring, sometimes there’s an impact and sometimes there’s an immediate impact of putting on an event or those kinds of things, but often the customers that we’re working with are trying to use those events to generate long-term change. So “I’m making a new audience aware of my space. I’m making them aware of the facilities in my town and all those things.”
Now, there might be a short term sugar hit of okay, I’ve drawn a few people in to do that. But really what you’re trying to understand in the long term is, are those people now returning, now that they know what’s here or now that they’re aware of what’s possible? The data types that we’re talking about today are absolutely ideal for measuring that.
It’s not just about the volume of the footfall, so when we talk about footfall data and mobility data, it’s also revealing where those journeys originated from. For instance, so you can identify these are postcode sectors which are now using our town but weren’t using it before we put these initiatives in place. In terms of using it to unlock funding, we’ve got some great examples.
The one I’ll pick on is a team in Manchester that had been trying for about six years to get a facility built in one of their parks and unsuccessfully for that period. By applying data to build the business case as to ‘we have the evidence to show that there is the right audience, the type of audience that generates the demand for this type of facility’, that enabled them to unlock a million pound plus funding for that facility. So a very modest investment in data enabled them to unlock that funding.
Great. Thanks for that, Conrad.
What I really liked in that is the hint towards this type of data being something to think about with those embryonic stages. It’s definitely a foundational component for a lot of these initiatives and projects that we’re seeing, especially talking to Gary in and around this, he talks that way, too.
If we think about where we’ve come so far in this webinar we’ve talked about an introduction to footfall and spend data, and we’ve talked about how it could be that almost semi-truth point to unlock funding.
We’re now moving into another benefit of having access to this data and using it to its fullest capacity, is that it almost becomes the thread, the common thread throughout an entire project, throughout an entire initiative from beginning to end. It can continue to be used to monitor, track any impacts of any actions, non action, as well as used to validate the success of those initiatives that are being implemented and put into place. Of course, that’s spend and footfall data, which are typically the key metrics of any initiative that is happening. Having this data provides total visibility throughout your project and ensures that your initiative is backed by real world evidence.
Can you elaborate on the visibility piece and how it helps local governments and organisations evaluate and enhance their initiatives to gain better understanding of local areas and communities? (21:21)
Joel: That visibility word in the context of data provides for two related topics. One, the visibility of data should be a constant. You’ve pointed that out, as did Conrad. That’s a critical point because sometimes we don’t know what’s going to happen when it does happen.
We’ve done some studies with some of the councils in the United Kingdom, anticipating heat waves and understanding what impact the heat wave had on merchants and in different parts of the community.
The ability to visualise or have visibility down to more granular segments of the council’s more granular geographies, does become more critical. It also becomes much, much more difficult.
The ways in which we think about how to treat the data and how to provide the data at a very granular level, are carefully designed. They provide incredible power where I can now start at the state or region level, understand some of the dynamics that are going on from a spend, a footfall, a growth opportunity perspective. Then I can drill down to the council and I can drill down to the high street and look at what’s going on within a few blocks of the high street. When you start to analyse what’s possible at that level and truly understand it, the impact on your decision making, your council planning, all of those things are dramatically impacted in a positive way.
The only other comment I’d make around visibility, is really tied to the concept of visualising the data as well. We all have far too much data to consume today. That is a fact.
The only ways in which we can as human beings properly interpret the data, is if two things exist. Number one, some context around what it is I’m trying to extract from that data. That’s why I lean on the comment around use cases being well defined. The second is the opportunity to visualise that data so that I can interpret it effectively and typically in real-time.
That doesn’t necessarily mean a whole bunch of charts and graphs and dashboards all the time.
It can mean different ways in which that data can be visualised based on the best ways in which you can interpret that data. The whole visibility question is one about granularity, but it’s also one about how do you interpret the data at whatever level of granularity you may be at and the visual cues become absolutely a must.
Mark: That was a great point around data complexity and data volume as well. Lots of departments are juggling lots of data sets and the goal is to find that commonality and that buy in and that belief; something that is really linking into what is actually happening on the ground. As soon as you start to leverage that in the initiatives and strategies that you’re undertaking and implementing, that traction just builds and builds.
We've talked about tracking performance - what are the key mobility metrics that local government and BID managers should really focus on? (30:18)
Conrad: There’s two parts to that question. There are the individual metrics that you can measure with mobility. For us amongst the core ones of those are footfall itself, so the actual volume of people visiting an area. We talk about catchment areas, so that’s an analysis about where those journeys are originating from and what’s the home location of those visitors?
There was a question that came up in the chat actually about tourism and I’d like to point out that the power and the value of this data is that you can look beyond your own geography and understand what portion is domestic or coming from overseas. So if you’re in an area which is high in tourism, there’s a really fascinating lens about the behaviour of the tourist population that you can narrow down to. As well as catchment, you can also look at dwell times. So, how long are people spending in those spaces and how frequently are they returning? The power and the beauty of mobility data is it enables you to link to the demographic and socio-economic descriptions. Not only are you looking at the volume of visitors in the area, but are they the type of visitor and the type of user that you’re seeking to attract that area?
You can think about each of those metrics individually and certainly they each have tremendously powerful insight. As Joel was talking about, the combination of spend and mobility data provides you one lens, but indeed, the combination of multiple types of mobility metrics also reveal less than obvious insight. Some of the questions we often get is ‘I ran this event and it looked really busy and there were loads of people in that space’. Maybe that particular area had very high footfall, but did they stick around? Did they visit the rest of the town while they were there? Did they ever come back again? We often caution against just looking at footfall and most of our customers are seeing beyond this now and they’re seeing that footfall is the starting point. It’s a useful metric, an indicator to know where to start the conversation or start the analysis, but it certainly doesn’t stop there, it goes way beyond that.
And mobility data provides you the power to do that.
Joel: It’s not just understanding how that spend behaviour occurs within the council. It’s also making sure you’ve got some visibility and even the opportunity to benchmark data to some extent, as to how that spend is occurring, perhaps in other councils.
So if you use that tourism example, I may be delighted that we’re seeing 30% of our tourism dollar coming from Canada, where I happen to sit and that’s a wonderful thing that the council is celebrating.
But the council may also really need to know that the Canadian tourism dollar is actually being spent at a rate of three X over in Manchester, and I’m still leaving some of that Canadian tourism money on the table. This is an opportunity for me to rethink, ‘how do we continue to build that tourist presence, that tourist stay?’ The frequency, the length; all those good things. I may think I’m doing great but I’m actually leaving some money on the table as those tourism dollars go next door at a perhaps a greater rate.
Conrad: I’d just like to build on that point. That international angle to that but there’s also a very local lens that you can apply to that.
Understanding not only your own area, but also looking at your peers, your competitors, the region that you sit within. This benchmarking opportunity that is offered here is tremendous, because it’s about the context. You might think things are going badly or you might think things are going really well.
It’s very difficult to understand that in isolation. It may be relative to the past – good or bad, but what these data types are offering you the ability to do, is to see how that performance measures up in the context of what’s going on in the broader picture. So perhaps you’re doing better than you think, or perhaps you’re not maximising the opportunity that your neighbours are and you can look to those neighbouring areas to find clues about the strategies or the policies that they’ve put in place, which are enabling them to make the most of that. Benchmarking is a really, really important one.
Joel: We usually summarise it with a single question, which is the pursuit of ‘is it me or is it the market?’ As we see fluctuations up or down, it’s critical to know ‘how much of that is because of what’s going on in my own council, in my own backyard, as opposed to some more macro activity that might be further out of my control. It’s critical to know that.
Gary: It’s important that we look at control areas where we’re not having an intervention to compare and that might be within a local authority in itself. You’re comparing one area where you may not be implementing a measure against somewhere where you are and that’s absolutely key to benchmark and assess against control areas. You can use this data to do all of those things.
Mark: That’s a really good build just bringing in benchmarking at that point. The other bit I’d draw out in this conversation, it started with catchment, and then we moved to international, but the key thing there is connections; from the micro, to the local, to the regional, to the national, to the international. Having a bit of a data insight into all of those levels can prove really key because while some things rise, some things fall. But if you’re just looking at your particular zone, you may not have that full, eco system available to you. The bit I really relate to was match day around the Olympic Park. Obviously very busy with football coming in but as a resident that was not going to be a location I wanted to go towards at that particular time. So you can really see how understanding that wider catchment piece and historical trend can really start to pinpoint the true impacts and benefits of events, initiative and everything else that’s out there.
We’ll keep moving forward.
We've talked about using footfall and spend data to validate initiatives. Gary you have a particularly great example referencing pedestrianisation and a road closure trial. It would be great if you could just give an overview of that. (37:40)
Gary: In Hertfordshire, we have a historic market town. It’s a traditional high street that faces the usual challenges that a lot of high streets face, with issues like congestion, pollution and ultimately it’s dominated by the car, which does affect active travel. In Hertfordshire we’ve got key policy objectives where we want to try and promote active travel, for obvious reasons such as, healthiness and well being and getting people out and about.
In addition to that and as part of our response to the covid pandemic and social distancing, it was an opportunity to apply this scheme in this town in Hertfordshire, that would also promote walking and cycling.
We closed a key high street to traffic on weekends and whilst this was mostly supported by residents, there were naturally some concerns about the economic impact of the scheme, particularly by certain groups. Data on footfall, dwell time and spend was absolutely crucial. Also talking about the importance of having lots of information, it was really beneficial to have data around journey time, traffic flows and public opinions as well. So, it all worked together to help us and it was crucial in understanding the impact of the intervention and also facilitating transparent discussions with those key stakeholders, including residents.
Although external factors like the economy and weather and various other things can influence results and that’s an important point, we were able to show that the high street and businesses were not adversely impacted directly by this particular scheme. That was a real key lesson that we learned from this exercise through the data and how we applied and understood that.
The evidence, especially when combining multiple data sets, helped reassure stakeholders that the scheme’s impact wasn’t as negative as initially feared. That was also very good and so we could actually apply that back to the residents and those stakeholders.
It’s also reassuring to see that this analysis that we did this exercise, corresponds with other pieces of evidence out there that support our findings.
The pedestrianisation does generally tend to improve spend in the local economy. That’s not to say that’s always going to be the case in every situation, but this data can help us understand and unpick that.
Mark: That’s been great to understand how you’ve seen success using this data. Now is probably a good time to probably draw on this a little bit more and elevate above that.
Now you’ve unlocked and begun to work with this data and what are the most common challenges you've faced with planning community events and how can this data help overcome these? (40:44)
Gary: One of the biggest challenges for me and it may be similar to those in Hertfordshire, is understanding public opinion and perception, which can be really insightful. It’s really useful to tap into that knowledge, but it can also have certain biases and influences. Data helps by providing an objective view especially when multiple data sets align and start to tell that story. It’s important for analysts to remain impartial because we too can have inherent biases, particularly from local authorities, where we’re trying to achieve an objective and we also need to be objective ourselves.
Additionally, data shouldn’t be used against parties, but it should be used to gain buy in and help others. For example, businesses can use trend data to adjust their strategies and benefit from these insights because ultimately, we’re all here to try and achieve the same thing. So it’s about working together, sharing the knowledge, sharing this information and trying to achieve that common goal.
Mark: I love the phrase buy in and shared goals. That’s absolutely something that you’ve been able to gain a lot of traction and success with. If you can create that partnership approach by proving application and capabilities, it creates a really powerful team and gets you that momentum that you need to keep going. Great example there, thank you.
We’re going to move into our final section now and we’re going to make this more event focused. Whilst we’ve talked about long or mid to longer term initiatives, if there are large scale events, then clearly there’s an opportunity to be assessing the impact and the benefits that spend and footfall data bring. So, what we’ll do is we’ll jump over to Joel, he’s got a great case study here of a Taylor Swift concert and the impact of the Swift lift in boosting local spending.
Joel, could you run us through this case study and share with our listeners those insights? (43:08)
Joel: It’s a fun example of the application of some of this data. Obviously there was a lot of speculation and consternation about how much financial impact a Taylor Swift concert might actually have on a given town or council and there was some debate as to whether it was really that big of a deal. We did do all of the data crunching and analysis around all of the venues the Taylor Swift that delivered worldwide and the data and the trends were unequivocal that she is moving economies.
Some of the interesting highlights to note, on average, the spend over the course of the two days before, the two days after, any given Taylor Swift concert at restaurants on average went up 68%. The highest was 172% in one particular market. Hotels saw a jump of between 42% if they were within three miles of the venue and a little bit less if they were further out at 32%.
Some real impact there. What we also looked at, though, was some of the indirect, economic impact, not just what’s going on in the obvious industry sectors that we could easily measure and identify the positive lift. For example, what was the actual economic impact relative to the various jobs that were created to host that venue or the impact and opportunity that was driven through the local shops that were able to sell tour memorabilia.
There were a lot of data points.Then what we had to do of course was to take away, what is the story? What is the point other than she has an incredibly huge impact on any given economy when she comes to town. There were a couple of interesting ones. One was making sure that we all understand the overall purchasing power of experiences, the demand consumers have and the amount that they will invest in an experience over perhaps large ticket durable goods, to the extent that in 2023 for the duration of the Taylor Swift concert, in all the markets she visited, the spend on large ticket durable goods, actually notably dropped.
We think that was due partly to inflation, but also partly due to the savings and upcoming opportunity to spend on that experience.
There were a lot of really interesting learnings that came out of the study. It did come across initially as a fun, interesting tidbit, but there’s some real lessons and learnings to uncover that can drive additional planning and thought around building experiences and creating those economic impacts around different experiences.
Mark: I thought that was a great example. Some of those numbers are eye watering on the Taylor Swift use case and again that just amplifies the power of this data. Looking at it outside of the core initiative event strategy, there’s this wider thread, this longer thread that runs through it. This data is that common theme that brings everything together.
What we’re going to do is bring Conrad in for just one last question on that point about benchmarking. Is there anything else you’d like to build on the benchmarking case, or if we want to take that into tracking consumer engagement before, during and after implementing initiatives.
Conrad: Certainly. Definitely to build on Joel’s point. Sometimes there is an obvious effect which is in your headline metric and sometimes there isn’t right. That’s also a fascinating area to explore. So, often we get customers that come to us and say, ‘well, I did this thing and I expected this, so can I have some data to demonstrate that?’ And sometimes the effect that has been felt is not in that metric right, but there’s nearly always another metric which has been affected. For instance, maybe it didn’t get the bump in volume of people, but maybe the people who did come spent a lot longer there than we expected, and maybe therefore spent more.
Again I come back to this point about combining these data sets in order to find that insight or finding this long term trend question.
‘I didn’t have the effect on that particular weekend or day or festival week that we expected. But I can see that it was actually the beginning of a change. It was the beginning of a change in opening it up to a new audience or a new type of behaviour. Benchmarking can be about ‘how do I compare to my peers?’, but it’s also ‘how does this compare to the past and what’s changed?’ You often need to be thinking about the data and how you explore what the data tells you over a much longer time period than you might initially think.
How can footfall and spend inform rural areas that rely on tourism? (50:12)
Mark: Maybe these are seasonal so they’re closing down outside of those summer months. Is there any way that football, spend data, benchmarks, catchment trends and flows could give them some confidence about staying open in winter months or extending that summer holiday period?
Conrad: The thing I come back to is two points there. One is the benchmarking, so maybe you’re closing down at the moment, but maybe there’s an area that you’ve observed that doesn’t close down that has a similar profile to you.
Maybe they’ve put some facility in there, or they have some attraction which is open all year round. So is that successful or not? Is that attraction having a positive or a negative impact? You can look to the data in other areas and it can give you clues as to if you were to do something similar, would it be worthwhile?
The second point, particularly for tourism, is that mobility data offers you the ability to see what the origin of those visitors are. For instance, say there is a large US contingent who visit a set of tourism sites in your area and you’re reliant on this US traffic, but your thought is, does that die down in the winter?
You can use the data to see if the surrounding regions are still seeing a meaningful proportion of that type of visitor that drives your traffic. This will give you clues as to whether, if you were to stay open, what your expected visitor rates might look like. You can use the mobility data to answer and understand those questions.
Joel: Benchmarking is great to see what else is working in other councils in other rural areas that’s addressing seasonality.
You could also look to see what other activities those consumers are doing during the off-peak seasons. For example, there may be rural areas that are popular for mountain biking, and by reviewing the footfall and spend data, you can see that those consumers also enjoy skiing or sledding.
We see each individual credit card holder and we track each and every one of their purchases and obviously their footfall activity, so we know that those same people have a higher propensity to come back if some of the activities they enjoy are introduced in that particular community.
You can see what else they do, in addition to what else might be going on in neighbouring councils.
Gary: From a local authority perspective, rural areas are absolutely key and they’re also very sensitive to uncertainty and to change. So it’s important that we really understand the impact of various different things that are affecting those rural areas. The beauty of this data, the footfall, the spend data, is that it’s easily transferable. It’s fair to say that generally you don’t have as much data in the smaller rural areas as a local authority that we do in some of the bigger towns and cities, so we’re more reliant on other sorts of data, to really understand and unpick exactly what the impact of those events are.
This data can really go into a granular level in a rural capacity and really help us understand those same trends that we can look at on those big events. It is very transferable to unpick those trends in rural areas as well.
Joel: You can also very quickly provide some segmentation insights and draw people based on further segmentation as well.
I was just thinking my wife and I often visit the Cotswolds, and our favourite spot is Bourton-on-the-Water. But why aren’t some of the other areas within the Cotswolds marketing to us to come in and stay with them? We consistently go back to the same place. That’s known data that’s available to councils and would help drive marketing and tourism initiatives that could introduce us to some of the other beautiful spots throughout the Cotswolds.
Mark: This data can help bring your audience to the table into your team. You may have a very successful approach to summer, but if you think about a strategy for those other months, you can use the data to see who you can pitch to and start investing your marketing spend in different locations and that can be domestic or international. Knowing who has the willingness and the propensity to visit those areas, those rural areas, is a great start. It derisks everything.
What are your biggest learnings to securing and leveraging this data to bring out its fullest value and what advice would you give for anyone starting out and looking into using footfall data? (57:00)
Gary: I suppose that’s the challenge in itself. You can never predict the future and what events are going to happen. We could never have understood or imagined that we would have had a pandemic a few years ago and what data we would require at that point. It’s answering the question in reverse. It is very difficult to position yourself to get the ideal bit of data, but it’s about getting prepared as early as possible. That’s absolutely key.
Having a plan and a strategy, to try as best as possible to understand what information you need in order to measure success. For me, that’s the absolute key, and that’s where I’ve been a big advocate around monitoring and evaluation. It’s really about planning, understanding and measuring what success looks like and having that agreed approach. In terms of biggest learnings, it’s that no single data set is perfect. Every single bit of data has its limitations and knowing that is the case and working with that is absolutely key.
In terms of footfall data, that means using it in the right context alongside other data sets, to get a comprehensive view. For example, you’d want to complement it with dwell time and spend data because it just gives you a much more rounded story in terms of understanding the overall impact.
It’s also very important to look at data in equal periods. The use case that I referred to earlier, I found the sweet spot being generally three months of data. So if you’re reviewing an initiative you look at that three months before, and then you compare it to the three months after, so you can remove that bias of external influences like seasonality. Ideally, you’d want to measure that against the same period in the future so you can really unpick it.
In terms of the future it is really difficult. So I don’t actually know what we’re going to need data for in what way in the future, because we’ll encounter that as and when those situations arise.
Mark: You could add to that, through your networks, colleagues and experience, you’d probably be happy to help people unpick anything, or where they see an opportunity. Certainly here at Huq, we’ve got a great team, and lots of collateral that explore potential use cases and how it would help. So you wouldn’t necessarily be operating in a very unknown space. A lot of the advice here is about having that conversation, isn’t it and unpick what the opportunity is.
Gary: It’s also about having a strategy. Going back to the monitoring and evaluation approach, really understanding from the onset, as early as possible, ‘what are the challenges?’ What is the key exam question that you’re trying to answer here and then you can move forward in terms of looking at key aims.
What is the ultimate vision and what does success look like? Then you can split it down into aims and objectives and then measurements of success KPIs. By doing that, it will help to determine what data you need to answer those questions. Having a structured strategy from the onset, is the best advice that I would give. That can then be translated into any situation or scenario.
How do you envision spend data analytics evolving further in the next few years and what’s the next iteration? (01:01:45)
Joel: This is a really simple one. We have only scratched the surface with the introduction of AI machine learning and it’s going to absolutely explode. So where does it go from here? We leverage AI machine learning to do two things really, really well. Number one, instead of understanding what did happen, how do we predict what’s going to happen? To do that with a level of accuracy has never been comprehended before.
The second is, if you can predict what is going to happen, then you should also have extremely tailored and specific recommendations on what to do around that particular prediction.
That is going to completely change the game.
I’m sure there’s many other things we can point to in terms of aggregation of data, and the ability to exchange data more freely. But from where I sit, the power of AI and what that means for prediction, prescription and really intelligent recommendations that are driven through those technologies, I don’t think anything comes close.
Conrad: I totally agree. The idea of looking into the future and the power of this data to look forward, that’s ultimately what all of our customers want to know. They can’t change what’s happened; they want to know what they should do next. That’s a big focus of ours certainly in terms of what mobility data can offer, as a lens looking forward. Picking up on Joel’s point on what AI brings to the world of data analytics, our customers shouldn’t have to be experts in the minutiae of how mobility or transaction data works. What they really want to get to is the ‘so what’. What should I do with my space and what does this mean for me?
We’re in a really exciting period of data companies beginning to apply those AI layers to help join the dots. We talk about the fact that no data set sits alone but what these AI layers are offering us the ability to do, is to see the unseen connection and the unseen implications of the relationship between one data set and another; the cause and effect. I’m really optimistic that we’re rapidly moving to a phase where we’re going to make life easier. As data providers we should be making life easier to local authorities, to BIDs and all of our customers, that we can do all of the heavy lifting and they can focus on making it happen.
Mark: That’s great, thank you so much, Conrad. Thank you to all the speakers. We’re going to call time here on the Q&A. We can clearly see that through the Huq and Mastercard partnership, we bring a lot of experience with local governments and BIDs across the UK. It’s great to see the power of the spend and footfall data and the difference that it’s making in the everyday world.
Is your team facing similar challenges?
Our experienced team can demonstrate how to use location intelligence and analytics to augment a wide range of use cases, including:
- Identifying areas for community-focused investments
- Optimising the use of public spaces and facilities
- Informing local economic development strategies
- Enhancing the effectiveness of community engagement initiatives
- Benchmarking performance across districts and town centres
- Understanding the local business landscape and visitor demographics
- Optimising event timing and public service hours
Ready to get started? Speak to one of our location experts
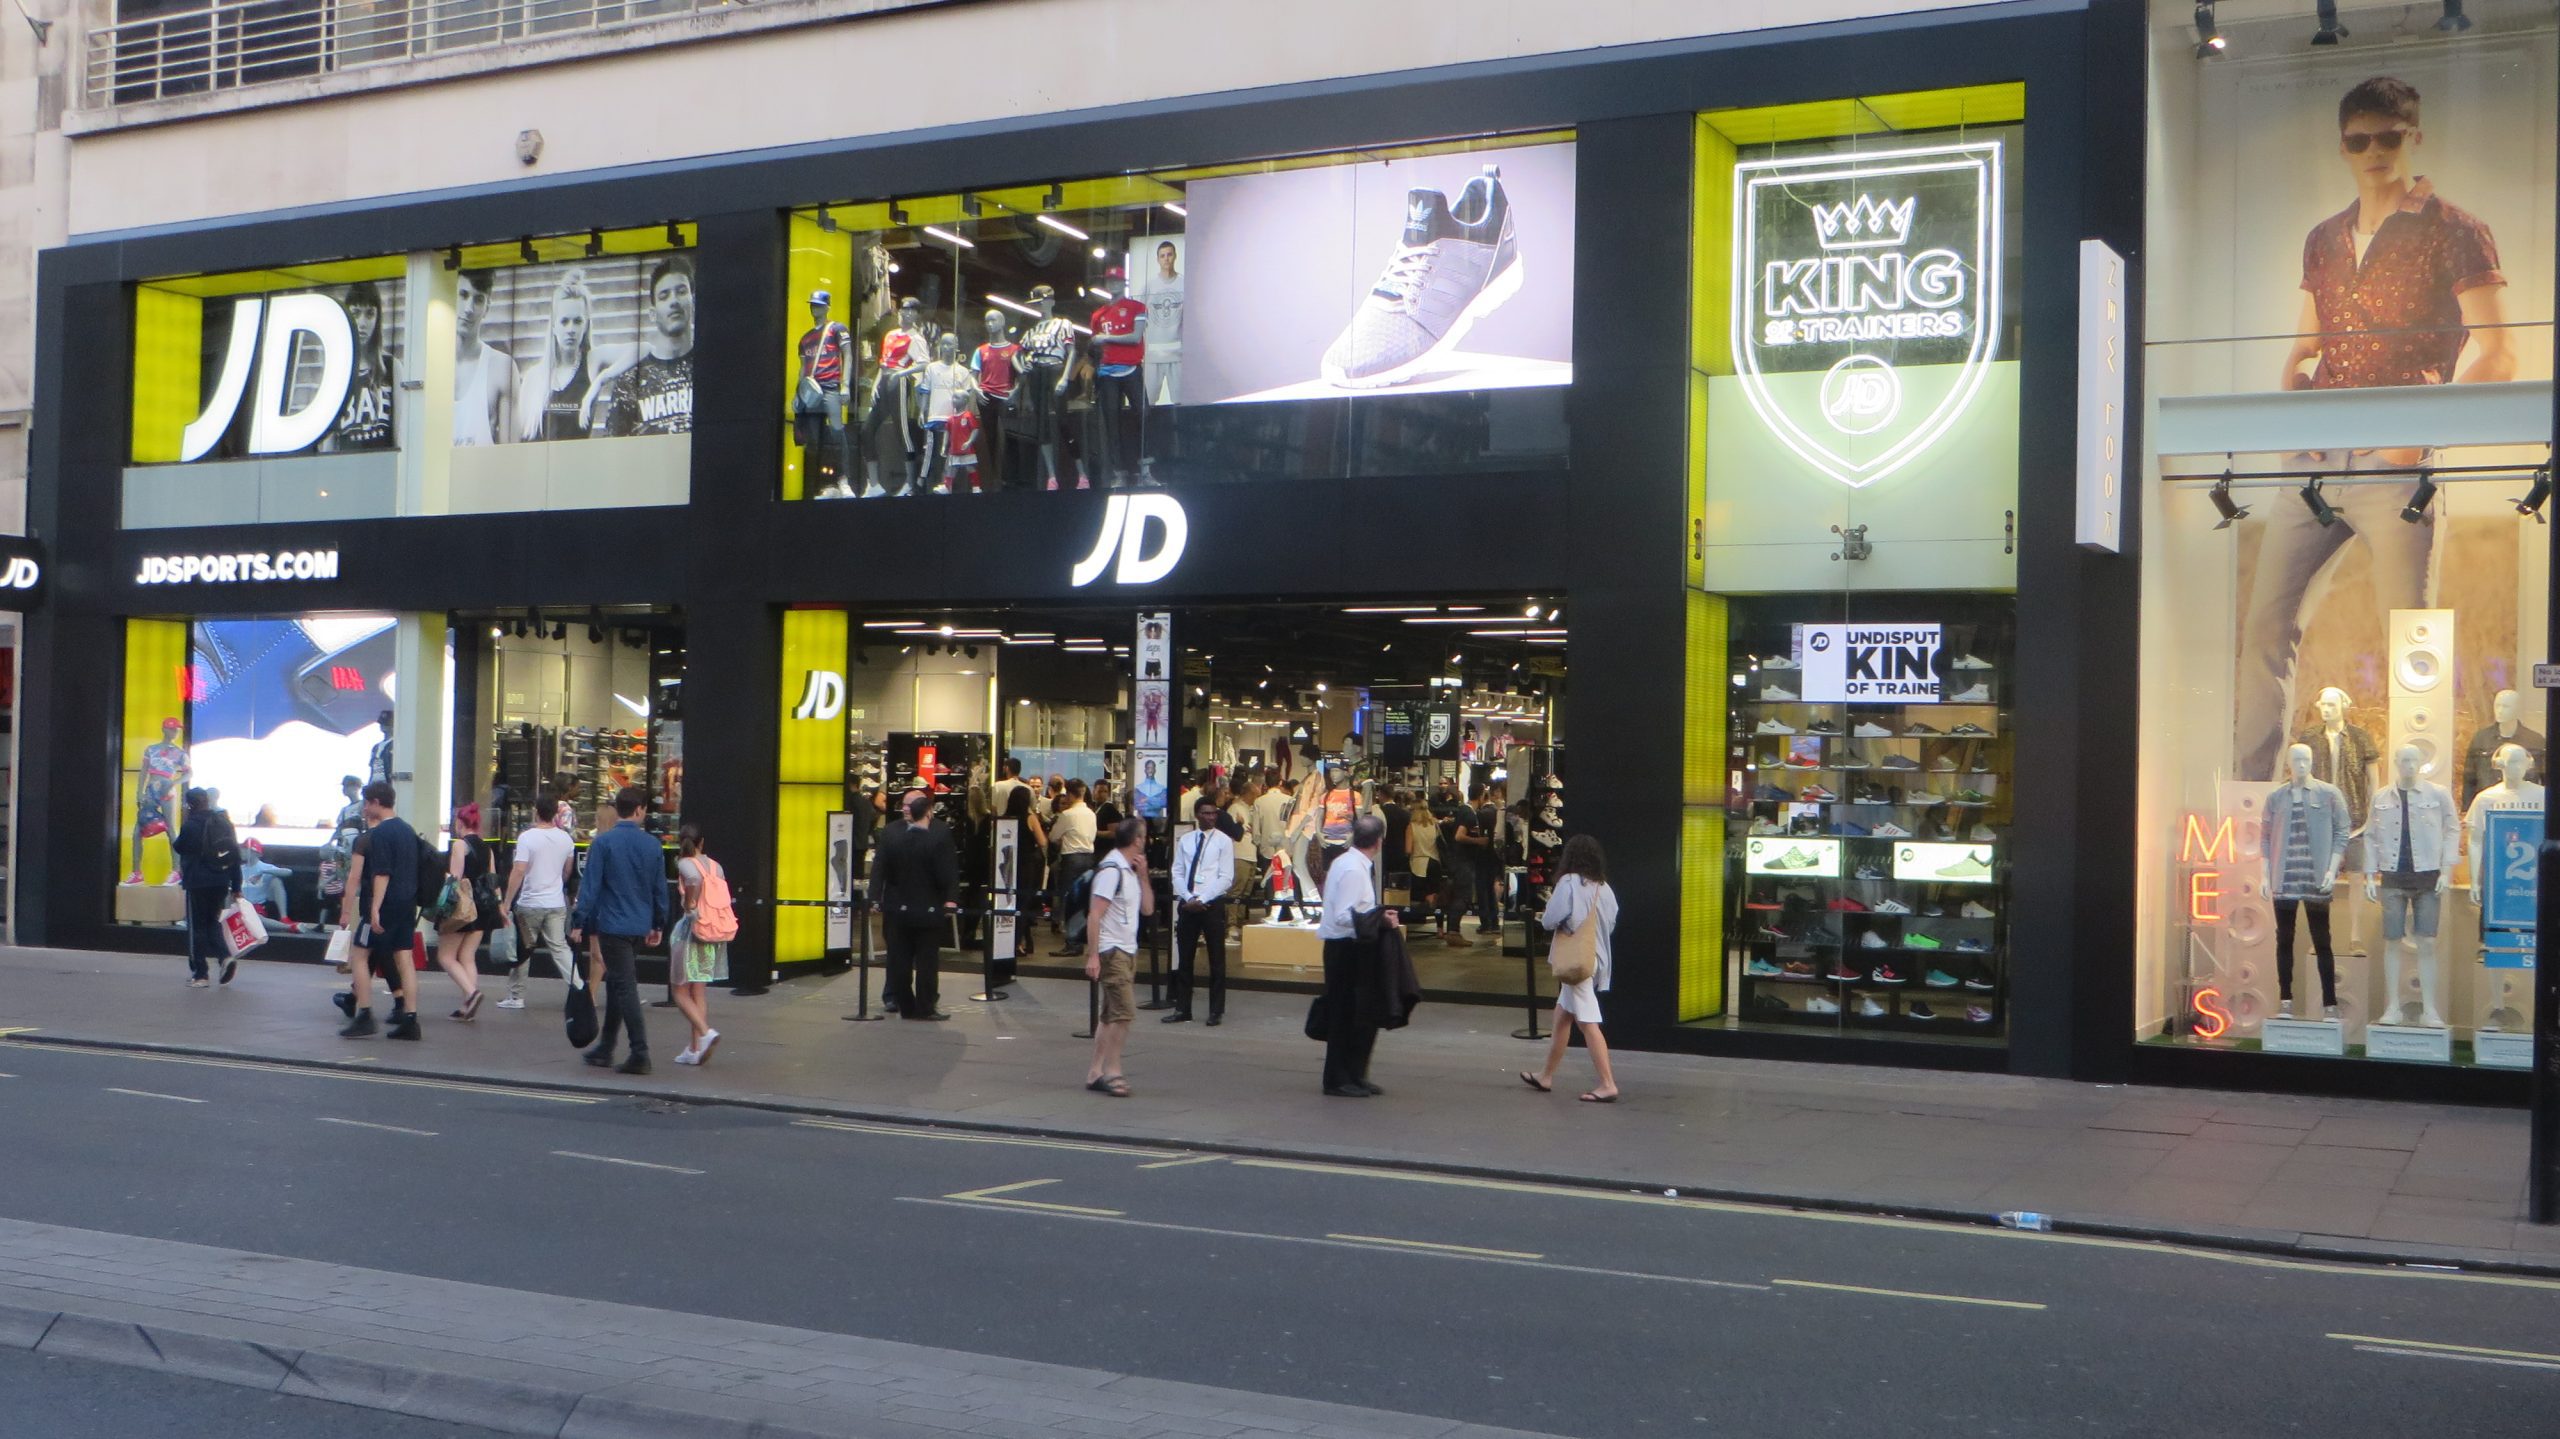
JD Sports Case Study
How JD Sports used footfall data to optimise its expansion strategy, reduce risks and grow the busines
How JD Sports Used Customer Catchments to inform Outlet Expansion Strategies
Huq’s mobility data transformed JD Sports’ understanding of customer catchments, improving precision by 25% and enabling more informed, data-driven expansion decisions that reduced location risk by 18%. Insights into footfall origins and cross-visitation patterns helped optimise store performance, minimise cannibalisation, and drive sustainable growth with greater confidence and strategic clarity.
Key takeaways from this case study
“JD Sports needed clear insights on where their customers were coming from to inform expansion decisions. Working together with Adept insights, we delivered precise catchment data that has strengthened their site appraisal process.”
Data-Driven Expansion Decisions
With insights into footfall origins and cross-visitation patterns, JD Sports was able to make data-led decisions about new store locations, minimise cannibalisation between stores and reduce expansion risks.
Optimised Store Network Performance
Combining sales and footfall data, JD Sports identified high-performing stores and areas needing optimisation, supporting strategic investment and relocation decisions to enhance profitability.
Improved Consumer Insights
Cross-visitation data revealed customer behaviour across retail centres, giving JD Sports actionable insights to refine site appraisals and create a competitive retail strategy.
Client Overview & Challenge
JD Sports, a leading retailer in the UK, faced a critical challenge in understanding the true catchment areas of their customers. With expansion plans targeting new store and gym outlets, the company needed detailed insights into where their current customers were coming from and the optimal areas for future growth. Traditional methods of catchment analysis based on distance were proving inadequate for their highly dynamic customer base. Additionally, JD Sports wanted to better understand customer behaviour and cross-visitation patterns to fine-tune their site appraisal and optimisation strategy.

Huq’s granular location data provided unparalleled insights into customers journeys, helping JD Sports to expand confidently and strategically with clear visibility into each location’s potential.
JD Sports needed insights on:
Visitation
To identify other retail areas that customers visit.
Catchment
To see where visitors travel from beyond assumptions.
Footfall
Visibility to minimise risk of cannibalisation.
Huq's Solution
“Huq helped JD Sports refine its expansion plans by understanding where customers come from and how to better position its stores.”
Huq delivered detailed mobility and catchment data, providing JD Sports with a comprehensive understanding of their customer base at a granular level. Huq traced retail centre-specific footfall data back to origin Postcode Sectors, offering invaluable insights into customer journeys and where their footfall originated. This data was integrated into JD Sports’ existing store network model and enhanced through collaboration with Adept Insights to align with their specific business needs.
Target Market Definition
Huq’s mobility and catchment data enabled JD Sports to define more precise catchment areas for their store network. Huq’s data reduced reliance on distance-based assumptions, providing a more detailed view of their target market.
Catchment Insights
Huq's data allowed JD Sports to identify the geographic reach of their stores. Using cross-visitation data, JD Sports was able to see how its customers interacted with other retail centres and which competitors they visited.
Evaluating new locations
With deeper insight into customer origins, the team was able to mitigate risks associated with new openings, identify the right locations for expansion, optimise their existing portfolio and drive sustainable growth with greater confidence.
How Huq's Solution Helped
JD Sports leveraged Huq’s mobility data to refine their site appraisal process and better understand the customer dynamics of each store. The learnings were multifaceted:
Making Informed Expansion Decisions
With Huq’s footfall and catchment insights, JD Sports successfully optimised its site appraisal process, reducing new store location risk by 18%, with a data-backed understanding of market saturation and potential overlap.
Catchment Accuracy Improvement
JD Sports saw a 25% increase in the precision of their customer catchment area analysis, allowing for better targeted marketing efforts and more confident site selection.
Stronger Strategic Decision-Making
The collaboration between JD Sports and Huq led to more data-driven decisions around store expansion and performance optimisation, fostering a more aligned and strategic approach to growth.
Final comments
JD Sports faced the challenge of understanding where their customers were coming from and how to optimise future store locations in an increasingly competitive landscape. With Huq’s detailed footfall and catchment data, they gained vital insights into consumer behaviour, helping them make data-backed decisions to drive both store performance and strategic growth. The solution empowered JD Sports to confidently assess store positioning, reduce expansion risk, and create a more streamlined optimisation strategy. If your business faces similar challenges, Huq’s location intelligence solutions can help you unlock actionable insights to drive better decision-making and success in a competitive market.
“Huq’s catchment insights allows JD to more accurately assess the impact of the wider retail catchment on the sales potential of new store opportunities.”
Alastair Browne, JD Sports
Group Head of Site Research & Strategic Insight
Is your business facing similar challenges?
Our experienced team can demonstrate how to use location intelligence and analytics to augment a wide range of use cases, including:
- Identifying locations for new stores
- Optimising your existing store portfolio
- Informing your pricing strategy
- Improving the effectiveness of marketing
- Benchmarking performance across locations
- Understanding competitor landscape
- Optimising opening hours
Ready to get started? Speak to one of our location experts

UK Budget Impact on Retail: What Rising Costs Mean for Consumer Footfall in 2025
UK Budget Hikes May Slow Consumer Spending
UK Budget Impact on Retail: What Rising Costs Mean for Consumer Footfall in 2025
The recent UK budget raises costs for businesses, potentially pushing up prices for consumers in a move to restore profitability. While seasonal spending may boost retail footfall temporarily, additional economic pressures and lingering utility costs could culminate in reduced consumer confidence in H1 2025, impacting footfall and spend. Major Retail Centres are expected to be able to weather the storm, however traditional High Streets and Town Centres may be hit, though this is expected to vary by region.
Key takeaways
Increased Business Costs
New budget measures, including a rise in minimum wage, reduced relief for business rates and taxes on pension contributions, will raise operational costs for UK businesses, particularly in retail and hospitality.
Christmas Footfall Boost
Consumer footfall is expected to stay high through the Christmas season as shoppers prioritise festive spending, but this resilience may fade come January.
Reduced Spending Power
Rising business costs and utility expenses could drive inflation back up, squeezing household budgets and limiting consumer spending.
Value-Driven Retail Strategies
Retailers that focus on competitive pricing and value will be better positioned to attract customers tightening their budgets amidst a lack of consumer confidence.
The recent UK budget announcement from the Chancellor introduced several impactful measures, primarily focused on employers.
Minimum wage increases and new tax obligations on company pension contributions are set to push up operational costs for many businesses, especially those in labour-intensive industries. While this may benefit employees with higher wages, the broader economic ripple effects could be felt by consumers in various ways as retailers and service providers seek to offset these increased costs.
Compounding these factors, the macroeconomic climate in the UK is showing positive signs, with GDP growth outpacing projections. However, rising utility costs and the potential for businesses to pass on new costs to consumers could drive inflation back up, which may curb consumer spending power over the next several months.
Shoppers navigate rising prices as new budget measures impact UK retail costs.
Christmas Spending Resilience: A Short-Lived Boost for Retail?
As we head into the Christmas season, retail footfall is expected to remain robust. The festive period traditionally sees an uptick in consumer spending, with high streets, shopping centres and retail parks busier than usual. This seasonal resilience may hold out through December as Christmas shopping takes precedence. However, the new year may bring a swift change, as consumers, facing increased prices from businesses looking to protect their profit margins, might limit discretionary spending. This shift could particularly impact non-essential retail sectors and hospitality businesses that typically see higher January footfall due to post-Christmas sales and seasonal activities.
Economic Pressures Signal a Spending Squeeze in early 2025

Certain consumer groups and regions are likely to be more affected than others by the evolving landscape. Households with lower disposable incomes, for instance, may feel the squeeze sooner, given that they have less financial flexibility to absorb price increases on essentials like food and energy. This could result in a more pronounced dip in footfall in local high streets and town centres, where these consumers are more likely to shop for essentials.
Meanwhile, more affluent areas and retail zones that cater to higher-income brackets, such as major city centres and luxury retail destinations, may see a softer impact. Higher-income consumers are generally more resilient to economic fluctuations, so their spending patterns might not change as drastically.
In the coming months, retailers will likely experience heightened sensitivity to price increases, as consumer behaviours adjust to reflect tighter budgets. By mid-2025, if inflationary pressures stabilise and economic growth remains strong, consumer confidence and footfall levels could gradually recover. Until then, larger retailers that can offer value-driven experiences and competitive pricing are likely to fare best as consumers seek to stretch their purchasing power amidst an uncertain economic landscape. Tracking store performance will be imperative for retailers in order to survive the coming months.
Looking to track location and consumer dynamics?
Our experienced team can demonstrate how to use location intelligence and analytics to augment a wide range of use cases, including:
- Weekly Footfall and Spend reporting across your network
- Benchmarking performance across locations
- Optimise your existing store portfolio
- Improve the effectiveness of marketing
- Understand competitor landscape
- Monitor complimentary-brand market entry and exits
- Identify thriving locations for new stores
Ready to get started? Speak to one of our location experts

How Footfall Insights Drive Economic Growth and Revitalise Communities
The Role of Footfall Data in Economic Development and Urban Regeneration
Footfall data has become an essential tool for local authorities working to support economic growth and revitalise towns and cities across the UK. In this post, we’ll explore how footfall monitoring can be leveraged to shape vibrant, thriving centres, measure the effectiveness of interventions, and guide future urban planning initiatives.
Community-Level Analysis
Gain a clearer understanding of how residents and visitors interact with local centres.
Allocating Investment
Guide public investment decisions by identifying areas that would benefit most.
Benchmarking
Combine footfall data with local business and service usage metrics to understand the impact of local initiatives.
Urban Planning
Footfall data provides an evidence-based foundation for long-term planning.
Why Track Footfall?
Footfall data enables local authorities to monitor the flow of visitors in specific areas, providing critical insights into community engagement. By tracking footfall over time, councils can establish a baseline for the “usual” activity in a location, which is valuable when assessing the impact of any new public project or policy. This data is particularly relevant for projects aimed at improving public spaces, as it helps demonstrate whether these efforts are increasing engagement and enhancing the area’s vitality.
Insights into Visitor Trends and Patterns
A valuable aspect of footfall data is its ability to capture long-term trends and seasonal fluctuations. Monitoring data over several months or years provides a clearer picture of how people interact with local spaces, highlighting patterns that may not be immediately visible. This historical context is especially useful when local authorities look to compare current levels of activity with pre-pandemic trends, allowing them to assess the area’s recovery and identify lingering impacts.
Huq’s platform, for instance, offers a “smoothened output” feature, which averages weekly data for a more readable trend line. This makes it easier to observe and analyse broad patterns over time, removing some of the noise from short-term spikes or dips that may be tied to one-off events.
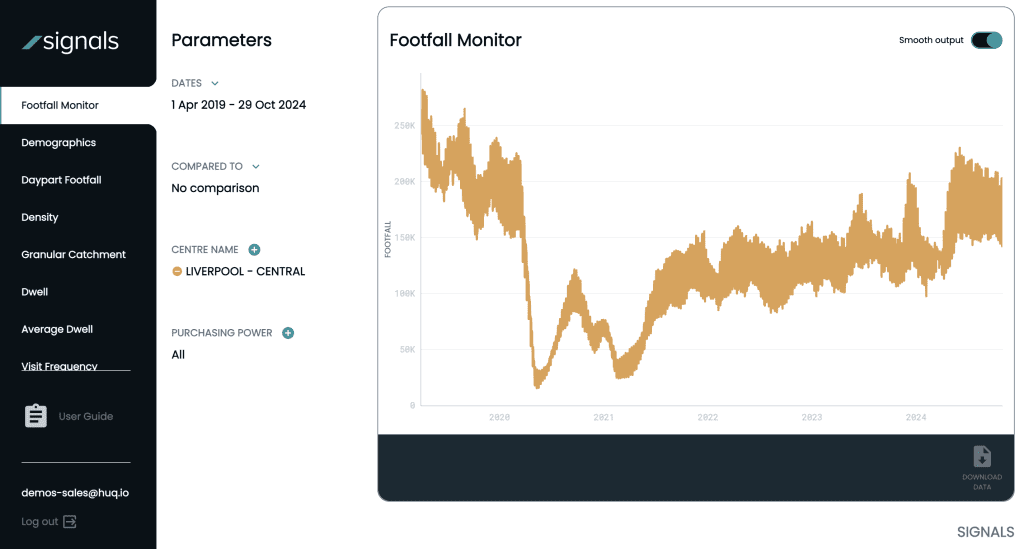
Measuring the Impact of Regeneration Projects
For councils engaged in regeneration and pedestrianisation projects, footfall data offers an objective means to evaluate progress. By comparing visitor numbers before and after a project, local authorities can measure changes in engagement, providing a data-driven understanding of whether a project’s goals have been met. This data can help validate further investment in similar initiatives and provide evidence to stakeholders that interventions are yielding results.
For example, pedestrianisation or public realm improvements often aim to increase foot traffic and create a welcoming environment. With footfall data, councils can monitor whether these projects are meeting their goals, thereby justifying public spending and optimising future plans.
Analysing Footfall by Demographic and Economic Segments
Beyond overall footfall trends, understanding the makeup of visitors is crucial for making tailored urban planning decisions. Some platforms offer segmentation tools that allow local authorities to filter data by factors such as purchasing power, enabling them to see which groups are most represented in specific areas. Analysing this information can help councils design spaces that meet the needs of their communities, from high street enhancements that cater to everyday shoppers to areas that attract higher-value visitors.
This demographic insight is particularly beneficial when planning commercial zones or deciding where to allocate resources to drive local economic growth. By understanding who is engaging with an area and in what ways, councils can make more nuanced decisions that better reflect the community’s demographic profile.
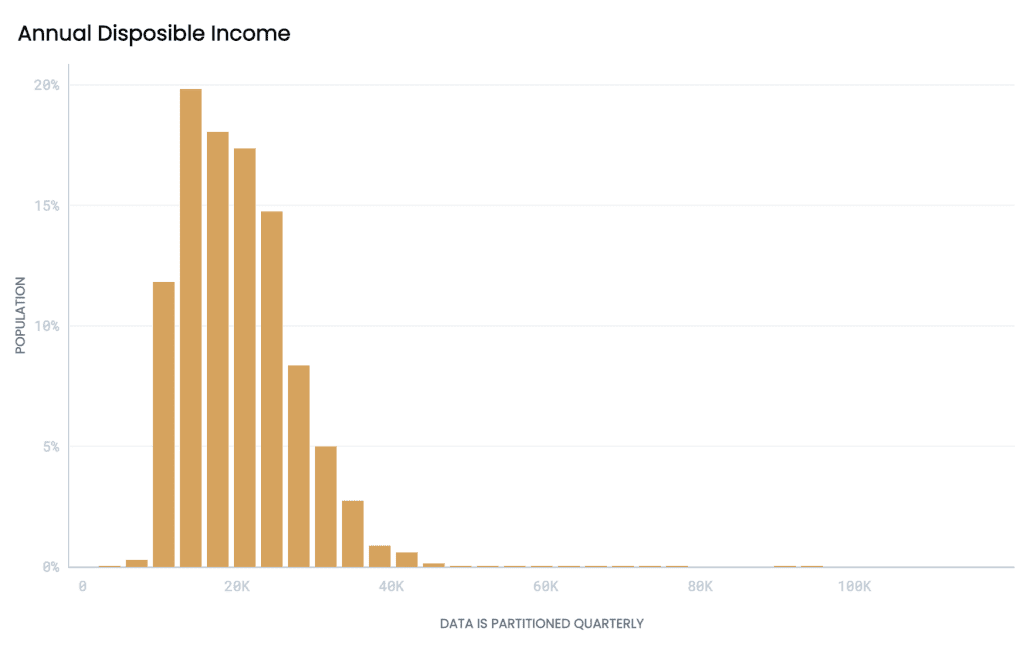
Why Footfall Data Matters for Community Wellbeing and Growth
Footfall data is more than just a tool for understanding numbers; it’s a vital asset for creating liveable, sustainable, and thriving urban spaces. By providing insights into the ebb and flow of activity, footfall monitoring helps councils design interventions that align with residents’ needs and ambitions. It also offers a transparent means to evaluate the impact of public spending, ensuring that urban planning remains responsive and accountable.
In summary, footfall data equips local authorities with a clearer picture of how people interact with local spaces, helping them create environments that are vibrant, resilient, and community-focused. Whether you’re assessing past projects or shaping future initiatives, footfall insights are a key ingredient for building places that foster wellbeing and prosperity for all.
Footfall
Provides a baseline ahead of interventions to then monitor impact, as well as understand the health and vitality of a retail centre.
Secure Funding
Then prove the quality of your work with the changes in data to secure funding for future development.
Is your team facing similar challenges?
Our experienced team can demonstrate how to use location intelligence and analytics to augment a wide range of use cases, including:
- Identifying areas for community-focused investments
- Optimising the use of public spaces and facilities
- Informing local economic development strategies
- Enhancing the effectiveness of community engagement initiatives
- Benchmarking performance across districts and town centres
- Understanding the local business landscape and visitor demographics
- Optimising event timing and public service hours
Ready to get started? Speak to one of our location experts

Pizza Express Case Study
How PizzaExpress optimised its Store Location Strategy with Footfall Insights and Location Data
PizzaExpress Optimises Store Performance with Huq's Footfall Data
PizzaExpress partnered with Huq to optimise store performance across its UK estate. By comparing footfall trends with sales data, PizzaExpress was able to identify whether underperformance was due to operational issues or external market factors. This data-driven approach helped validate investment decisions and optimise the store location strategy.

Key takeaways from this case study
“The collaboration with PizzaExpress has been a great example of how Huq’s data can help solve complex business challenges. Together, we’ve transformed how they assess store performance, giving them a more accurate read on their market opportunities.”
Market Level Analysis
Using footfall data to understand whether store performance is down to internal or external factors.
Allocating Investment
Guiding investment decisions including refurbishments and relocations.
Benchmarking for Better Insights
Combining footfall with sales data for better understanding of sales performance against local.
Long-term Strategic Value
Visitor data is now more informative and actionable.
Client Overview & Challenge
PizzaExpress operates over 370 stores across the UK, each subject to its own localised market conditions. The challenge was to track performance not just through internal sales figures, but also relative to footfall and market vitality in each location. This insight would help assess whether a store’s performance was influenced by external market conditions or internal operational factors – is it PizzaExpress or the market?
PizzaExpress needed an objective way to measure footfall at each of their high street locations. By partnering with Huq, the high street restaurant chain was able to benchmark sales performance with footfall data and location insights from the surrounding areas for a more holistic overview of each store’s performance. This helped provide a clearer view of how PizzaExpress was performing in certain locations, helping them refine their overall store strategy going forward.

PizzaExpress leverages local footfall data to optimise store performance, aligning sales with market dynamics to enhance customer experience and operational efficiency.
PizzaExpress needed insights on:
Footfall
Measure footfall for each high street store to understand store performance for each location.
Benchmarking
Compare location insights with sales data for a more accurate picture of store performance over time and relative to other locations.
Huq's Solution
“PizzaExpress came to us with a clear challenge — understanding whether their footfall aligned with their sales performance. By working together, we provided footfall insights that allowed them to pinpoint the true drivers of store success.”
Huq delivers monthly footfall metrics for each PizzaExpress store across the UK. This data covered footfall trends in and around the stores, offering a comprehensive understanding of how many potential customers were passing by, spending time in the vicinity, and entering the stores’ trading zones. By integrating Huq’s footfall data with their internal sales data, PizzaExpress could benchmark each store’s performance against the customer heartbeat of an area.
Robust footfall data from Huq became a critical resource for PizzaExpress’s financial and operational teams. Footfall trends were monitored and compared with store performance metrics to create a more informed analysis of each store’s success. Stores with strong footfall but underperforming sales flagged potential operational issues, whereas those with lower footfall could point to external market conditions as the reason for lower performance.
Market influence
A positive correlation was found between stores with high footfall and those with stronger sales performance, helping to confirm that in-store performance is often influenced by market dynamics such as footfall volume and suitability.
Improved Efficiency
The integration of Huq’s data into monthly reporting created efficiency gains for senior teams, allowing for quicker decision-making at the executive level.
Data Driven Decisions
The ability to contextualise store performance against local consumer behaviour built trust between PizzaExpress and Huq, fostering a long-term relationship for ongoing collaboration.
How Huq's Solution Helped
PizzaExpress was able to identify which stores were outperforming or underperforming based on both sales and market footfall quality and vitality. This allowed senior management to adjust strategies, including:
Resource Allocation
By identifying stores with solid market demand but underwhelming sales, PizzaExpress could allocate more attention, staff training or marketing budget.
Investment Decisions
Validating decisions around investment, including refurbishment and disposal or relocation of existing stores and identifying new store locations.
Benchmarking
By using footfall as a baseline, PizzaExpress could create a monthly benchmark report that identified correlations between sales, footfall and store performance.
Final comments
Huq’s localised footfall data has become an indispensable tool for PizzaExpress, giving them greater visibility into their market conditions, store performance and location vitality. The collaboration with Huq has improved decision-making efficiency, investment validation, and strategic planning for optimising their store portfolio across the UK. With Huq’s continued support, PizzaExpress is well-positioned to optimise resources and maximise store performance across their diverse portfolio of locations.
“Huq’s localised footfall data empowered PizzaExpress to make smarter, data-backed decisions across their store portfolio. By integrating footfall insights with internal sales data, they could better understand each store’s market context, leading to more precise resource allocation and investment decisions. This collaboration truly highlights how external data can unlock operational potential.”
Is your business facing similar challenges?
Our experienced team can demonstrate how to use location intelligence and analytics to augment a wide range of use cases, including:
- Identifying locations for new stores
- Optimising your existing store portfolio
- Informing your pricing strategy
- Improving the effectiveness of marketing
- Benchmarking performance across locations
- Understanding competitor landscape
- Optimising opening hours
Ready to get started? Speak to one of our location experts

Queen Elizabeth Olympic Park Case Study
Transforming the QEOP: Validating Investment and Shaping Future Planning with Footfall Data
Securing investment to create vibrant community hubs
Partnering with Huq became crucial in helping the London Legacy Development Corporation better measure and validate the success of initiatives and events at Queen Elizabeth Olympic Park.

Key takeaways from this case study
28%
increase in footfall during major events.
60%
year-on-year growth in visitor numbers.
Easier impact assessment
Huq’s footfall data allows the LLDC to more accurately measure the impact of events and investments.
Yearly growth validation
Huq has transformed the LLDC’s approach to capturing and reporting visitor data.
Better strategic planning
Huq’s data helps to foster more confidence in existing strategies.
Clearer visitor trends & insights
Visitor data is now more informative and actionable.
Client Overview
The London Legacy Development Corporation (LLDC) is responsible for overseeing the development and regeneration of the Queen Elizabeth Olympic Park (QEOP), transforming it into a vibrant destination that offers a blend of residential, educational, cultural and recreational spaces.
Following major recent investments like the East Bank Development and the opening of the University of London campus, the QEOP has become an increasingly popular destination. As a result the LLDC’s objective has shifted towards leveraging this new infrastructure to drive even more visitors to the park to ensuring its long-term success as a key London destination.

The London Stadium hosted the The Foo Fighters, New York Mets and Philadelphia Philliesy baseball teams in June 2024 attracting 34,2017 visitors.

Recent investments, such as the East Bank Development, are drawing more visitors, as confirmed by Huq’s footfall data.
The Challenge
The LLDC faced challenges in quantifying the impact of improvements and developments on footfall. The team’s traditional approach to measuring visitor numbers relied on manual aggregation of stadium attendee figures and data from cameras and sensors scattered throughout the park. This method was neither accurate nor comprehensive enough to give the LLDC confidence in their reporting to stakeholders, including the Mayor of London. Moreover, with large-scale events taking place at the park – such as the 2024 MLB (Major League Baseball) weekend – the team needed a scalable solution to measure the overall impact of these initiatives and to justify future investments.
The LLDC required insights into:
1
Footfall before and after key events help validate investments.
2
Visitor profiles including the proportion of local vs. distant visitors.
3
Dwell time patterns to help shape planning and marketing efforts.
Huq's Solution
To address these challenges, Huq provided the LLDC with its advanced location-based footfall data which included key metrics for assessing park usage. The Huq Signals data platform allowed the team to track near real-time visitor movement through the park, offering insights into footfall trends, dwell time and visitor catchment areas.
By integrating Huq’s footfall data with other geospatial datasets, the LLDC gained an unprecedented understanding of the park’s evolving role as a destination.
Footfall Analysis
Capturing footfall data for different times of day, week and year, including during large events like the MLB weekend, to help identify visitor peaks and improve event planning.
Catchment Analysis
Identifying the proportion of visitors travelling from outside the local area versus those within proximity of the park, offering valuable insights for marketing and future infrastructure development.
Dwell Time Analysis
Measuring how long visitors stay in the park and dwell time correlate with footfall trends, providing an understanding of commercial success and visitor satisfaction.
How Huq's Solution Helped
The data provided by Huq was instrumental in validating the park’s increasing role as a destination and the success of recent investments. By tracking visitor data with precision, the LLDC was able to:
Measure Event Impact
During the MLB weekend in June 2024, the park saw a significant 28% uplift in footfall compared to the usual weekend average for June. This data was key in reporting the event’s success and securing similar future investments.
Validate Yearly Growth
Between April 2023 and March 2024, 20+ million visits were recorded at QEOP - a 60% increase year-on-year. This massive growth validated previous investments and shaped future decision-making around further park developments.
Improve Reporting Accuracy
The data insights provided the LLDC with concrete evidence to present to stakeholders, including the Mayor of London, ensuring future investments are grounded in reliable, real-time data.
Final Comments
The partnership between Huq and the LLDC has transformed the way visitor data is captured and reported at the QEOP. By replacing the “finger in the air” approach with objective, data-driven insights, the LLDC can now strategically plan and prioritise future investments to ensure the long-term vitality of QEOP as one of London’s key public spaces.
With Huq’s footfall data, the LLDC can now easily demonstrate to stakeholders the positive impact of infrastructure investments on park usage. This case demonstrates the effectiveness of Huq data in supporting local government initiatives, validating investments and creating vibrant community hubs.
“Footfall data doesn’t just track visitors; it validates the success of public investments and provides a roadmap for future development.”
This case demonstrates the effectiveness of Huq’s footfall data in supporting local government initiatives, validating investments and creating vibrant community hubs.
Is your business facing similar challenges?
Our experienced team can demonstrate how to use location intelligence and analytics to augment a wide range of use cases, including:
- Mapping travel patterns
- Driving informed decision
- Pinpointing your audience
- Identifying trends and unique insights
- Benchmarking performance across locations
- Uncovering the true performance of your space

