Revolutionise retail forecasting
Drive superior store performance, customer-focused strategies, increased revenue and mitigate risk with data-driven decisions. Harness the power of retail planning data and analytics for better planning and optimisation.
Location intelligence that is trusted by 300+ industry leaders


Unlock the secrets of profitable customer behaviours with Huq


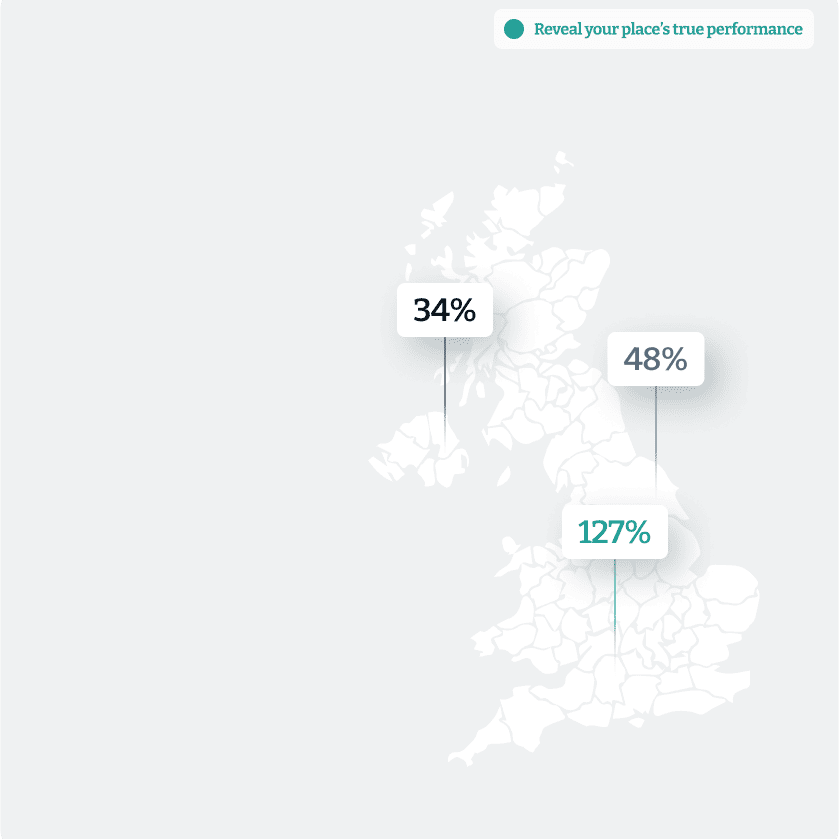
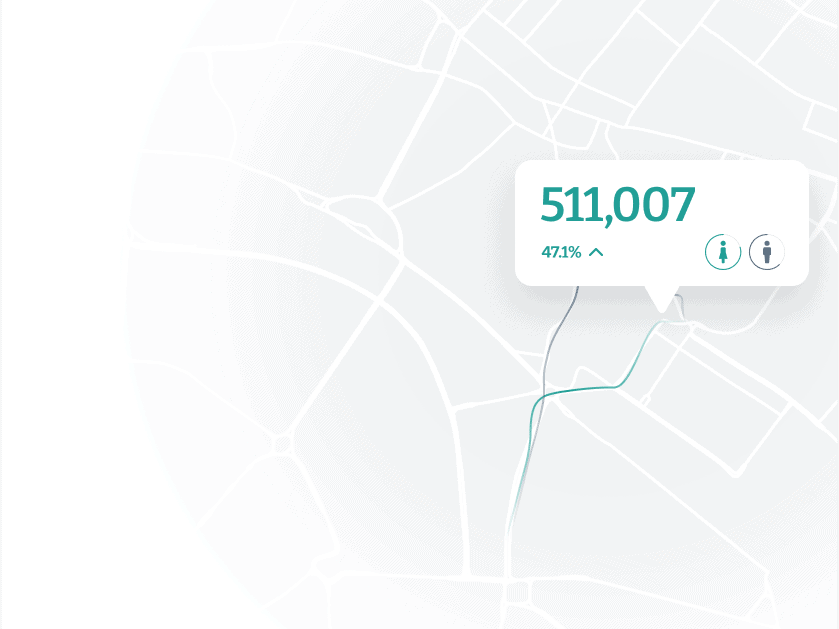
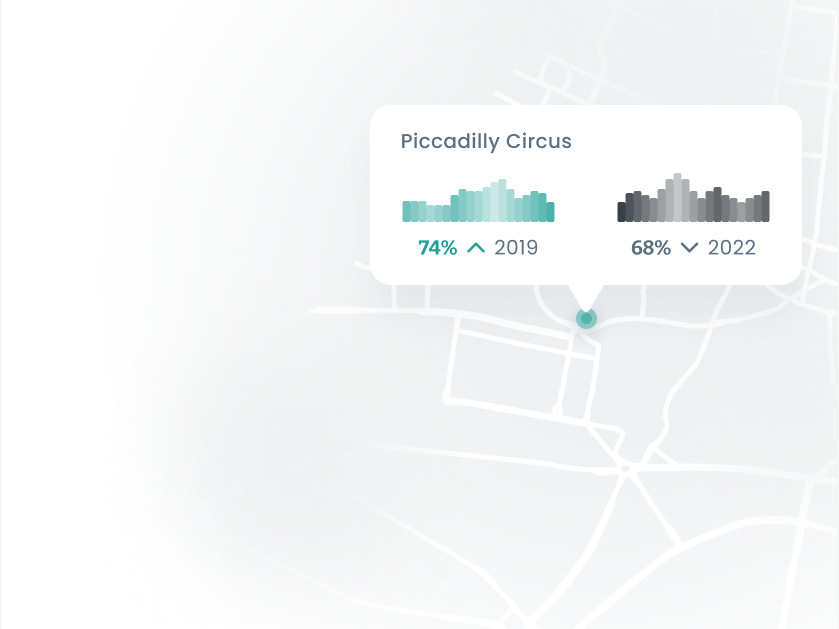
Reveal the true performance of your space
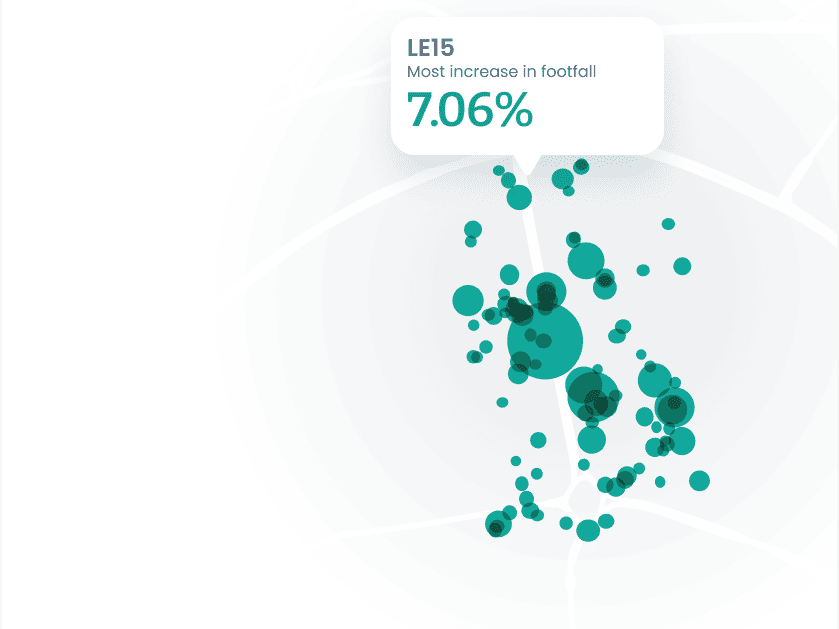
Uncover peaks and troughs in annual, monthly, weekly, daily, and hourly footfall across any global site.
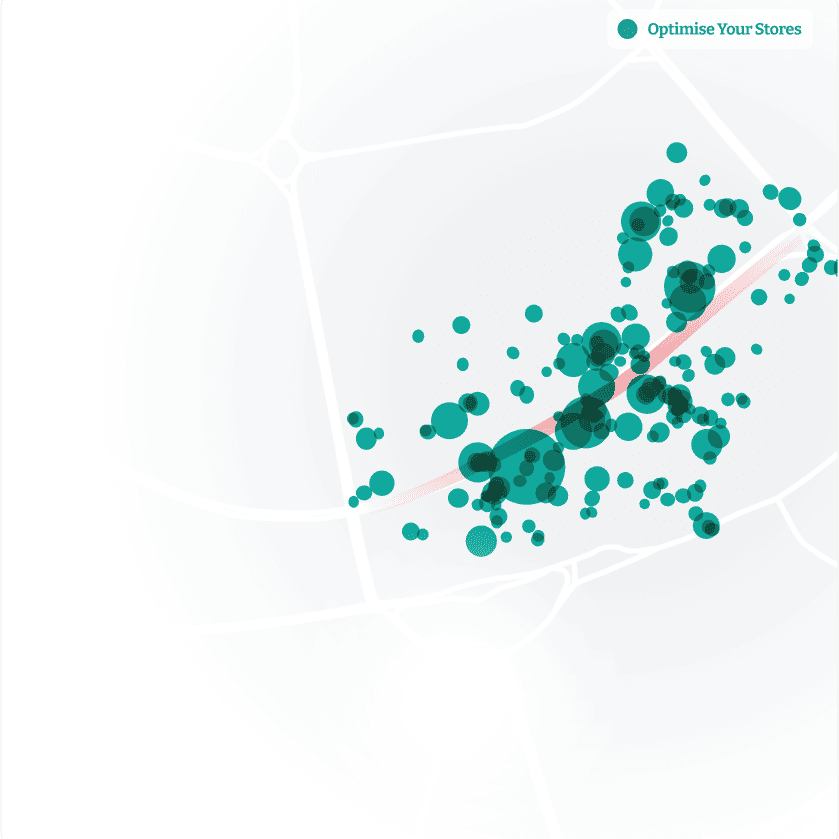
Optimise your stores
See trends across footfall, geographic origin, audience, and cross-visitation to identify gaps, avoid cannibalisation, and maximise the performance of your stores.
Identify market potential
Harness foot traffic patterns, demographic data, and customer behaviour insights to pinpoint high-potential areas for expansion and tailor offerings to local preferences.
Stay ahead of the competition
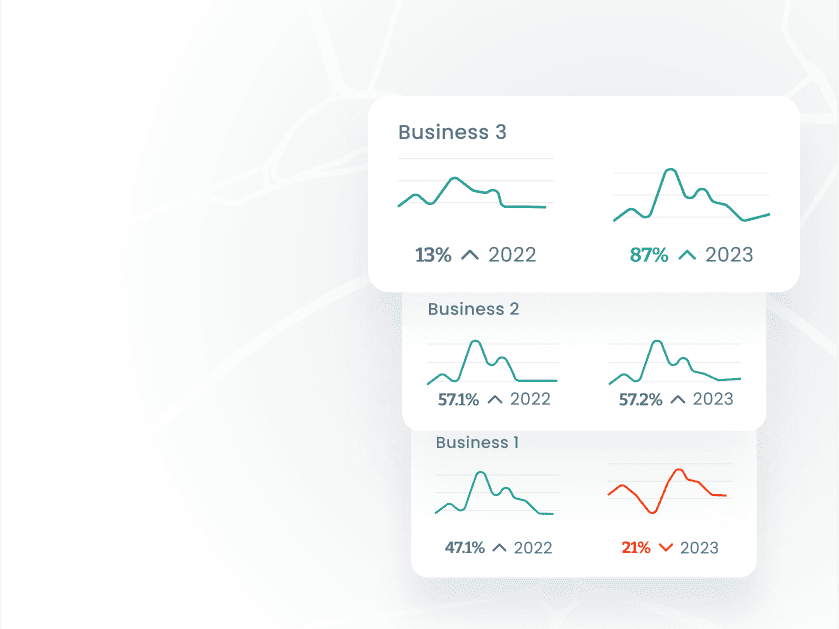
Measure market share across several performance indicators over time compare your performance against competitor and understand how the landscape is changing.
Expert benchmarks
Ensure that your projects are making an impact with expert prepared insights and benchmarks that are catered towards your goals.
Uncover peaks and troughs in annual, monthly, weekly, daily, and hourly footfall across any global site.
See trends across footfall, geographic origin, audience, and cross-visitation to identify gaps, avoid cannibalisation, and maximise the performance of your stores.

Harness foot traffic patterns, demographic data, and customer behaviour insights to pinpoint high-potential areas for expansion and tailor offerings to local preferences.

Dive into audience insights and crucial metrics for heightened sales. Explore how your stores align with this journey, then monitor and fine-tune for peak performance and superior marketing campaigns.
Measure market share across several performance indicators over time compare your performance against competitor and understand how the landscape is changing.

Ensure that your projects are making an impact with expert prepared insights and benchmarks that are catered towards your goals.
Stay ahead of market trends with location insights
Councils & BIDs
Enhance community well-being and local economy by leveraging actionable mobility insights to strategically plan and improve public spaces and local businesses.
Economic Development
Drive sustainable growth and attract investments by harnessing mobility data to make informed decisions, optimise infrastructure, and create vibrant economic hubs.
Parks & Green Spaces
Elevate urban experiences and conservation efforts using mobility insights to design, manage, and activate parks and green spaces that cater to diverse visitor needs.
Transport Management
Optimise urban mobility and reduce congestion through data-driven transport solutions that leverage mobility insights to enhance transit experiences and improve city-wide traffic flow.
Projects & Programs
Ensure project success by utilising mobility data to inform planning, monitor progress, and adapt strategies, enabling efficient execution of government initiatives.
Tourism Management
Optimise tourism initiatives with precise mobility insights. Enhance planning, monitor progress, and adapt strategies for project success.
Data Analysis
Empower evidence-based policy-making with comprehensive mobility insights, providing valuable data-driven perspectives for better decision-making and impactful governance.
Property Development
Transform visions into reality with mobility insights that guide strategic location selection, tenant profiling, and placemaking, ensuring successful and thriving developments.
Property Management
Leverage mobility data to streamline operations, enhance tenant experiences, and create spaces that cater to diverse needs.
Urban Planning
Shape urban landscapes intelligently by leveraging mobility data to inform land use, infrastructure planning, and community development, resulting in vibrant and efficient urban environments.
Brokerage
Provide clients with an edge in the market by offering mobility-driven insights for informed property choices, empowering successful transactions and satisfying investor goals.
Commercial Development
Deliver high-value properties that align with customer preferences and adapt to changing demands by leveraging mobility insights for impactful developments.
Residential Development
Deliver high-value properties that align with customer preferences and adapt to changing demands by leveraging mobility insights for impactful developments.
Store Management
Elevate store performance and customer experiences using mobility insights to optimise layout, staffing, and promotions, enhancing customer satisfaction and revenue.
Optimisation Management
Drive efficiency and revenue growth through data-driven decisions, utilising mobility insights to fine-tune operations, inventory management, and supply chain strategies.
Data Teams
Empower data-driven innovation with comprehensive mobility insights, enabling advanced analytics and actionable intelligence for strategic retail solutions.
Strategy Teams
Shape winning retail strategies with the power of mobility insights, unlocking trends, customer behaviour, and market dynamics to make informed decisions that drive success.
Marketing Management
Craft impactful campaigns that resonate with customers by harnessing mobility data to understand foot traffic trends, enabling targeted promotions and increased engagement.
Store Planning
Unlocking mobility data empowers store planners to strategically design layouts, optimise merchandising, and enhance customer experiences for impactful retail environments.
Consulting
Offer tailored financial insights and strategies to clients by leveraging mobility data, enhancing consultancy services and providing actionable recommendations.
Portfolio Management
Optimise investment portfolios with precision using mobility insights to identify trends, risks, and opportunities, ensuring strong performance and informed decision-making.
Investing
Enhance investment decisions by harnessing mobility data to gauge market sentiment, predict trends, and mitigate risks, driving profitable outcomes for informed investors.