.svg)
Weekly Wrap, Week 45: Retail Footfall In Wales Struggles
Recent footfall data from Huq Industries reveals significant regional disparities in retail activity across the UK for week 45, 2024.

January 9, 2025
2 min read
Table of contents

Recent footfall data from Huq Industries reveals significant regional disparities in retail activity across the UK for week 45, 2024. This comprehensive analysis covers local retail centres, major retail centres, shopping centres, retail parks, and high streets, providing a holistic view of the current retail landscape.
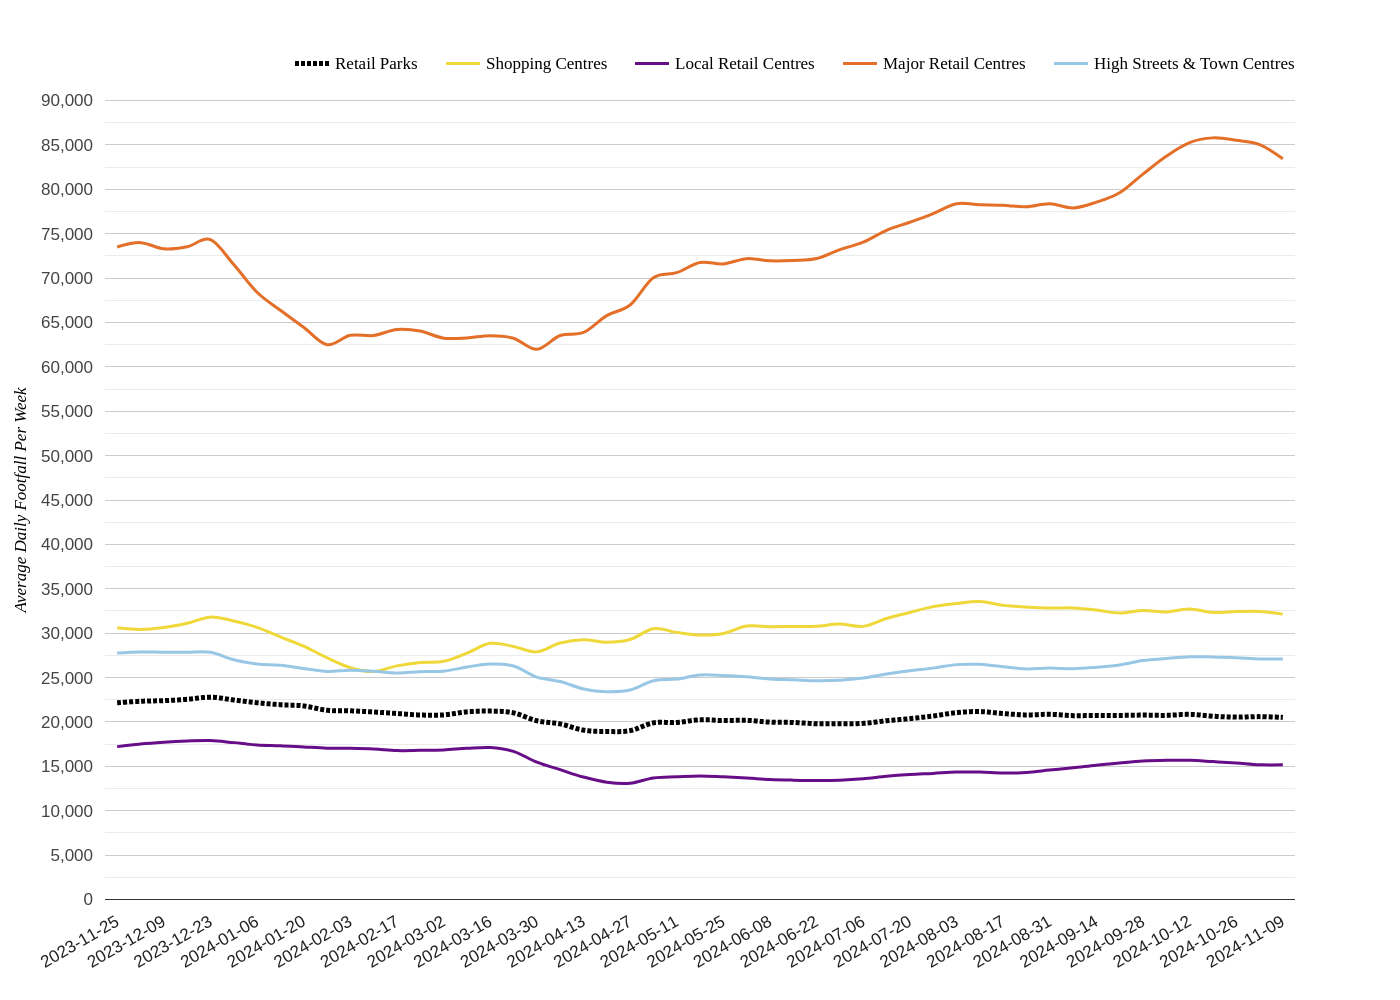
Daily Footfall by Retail Centre Type
Local Retail Centres
In the latest report on Local Retail Centres, Northern Ireland shows a promising year-on-year increase in footfall despite a slight week-on-week decrease. Conversely, the East of England experienced a significant year-on-year drop in footfall, although dwell times in the region have seen substantial growth. London stands out with a robust increase in both footfall and dwell time year-on-year, suggesting a continued recovery in retail activity.
Major Retail Centres
The Major Retail Centres report highlights a year-on-year rise in footfall in London. However, the North East saw a slight decline in footfall year-on-year. Dwell time in Northern Ireland increased substantially, indicating a more engaging retail environment, while the North East experienced a significant decrease in dwell time.
Shopping Centres
According to the Shopping Centres report, London shopping centres have seen an increase in average daily footfall year-on-year, while Wales experienced a sharp decline. Dwell time trends are mixed, with the West Midlands reporting a substantial year-on-year increase, suggesting enhanced retail experiences.
Retail Parks
The Retail Parks report shows mixed trends across the UK. The East of England saw a slight week-on-week increase in footfall, while Scotland reported a significant increase in dwell time year-on-year. Wales and the South West experienced notable changes in their footfall patterns, reflecting shifts in consumer preferences.
High Streets and Town Centres
The High Streets and Town Centres report indicates that London experienced a notable increase in average daily footfall year-on-year while Wales saw a significant decrease. Dwell time in the West Midlands increased substantially, suggesting longer visits.
Market Outlook
Looking ahead, the direction of the latest footfall data and historical trends suggest continued variability in footfall across the UK. Retail centres in London are likely to maintain their upward trajectory, while regions like Wales may face further challenges. This forward-looking analysis, based on location intelligence analytics, provides retailers with a framework to anticipate market movements and plan accordingly.
Partner with huq
Track consumer footfall and spend dynamics across your store network using huq data and compare to your own sales data. Gain insights into crucial questions such as ‘are we out-performing the market’, ‘where are our similar locations for new store growth’, and ‘how healthy is this retail centre’.
If you are interested in basing your location insights to actual consumer behaviour then please connect with our team.
Frequently Asked Questions
Clear answers to the most common questions about movement intelligence, retail expansion, and location analytics.
Related Blogs and Insights



.svg)
Empowering strategic teams with the world's most accurate and accessible location intelligence.
Contact

.svg)