.svg)
Weekly Wrap: UK Retail Footfall Trends, Week 42
In the latest comprehensive analysis of retail footfall across the UK, Huq Industries reveals significant regional variations and trends.

January 9, 2025
2 min read
Table of contents
In the latest comprehensive analysis of retail footfall across the UK, Huq Industries reveals significant regional variations and trends. This article delves into the performance of major retail centres, retail parks, shopping centres, local retail centres, and high streets & town centres, providing a holistic view of the current retail landscape in week 42, 2024.
Daily Footfall by Retail Centre Type
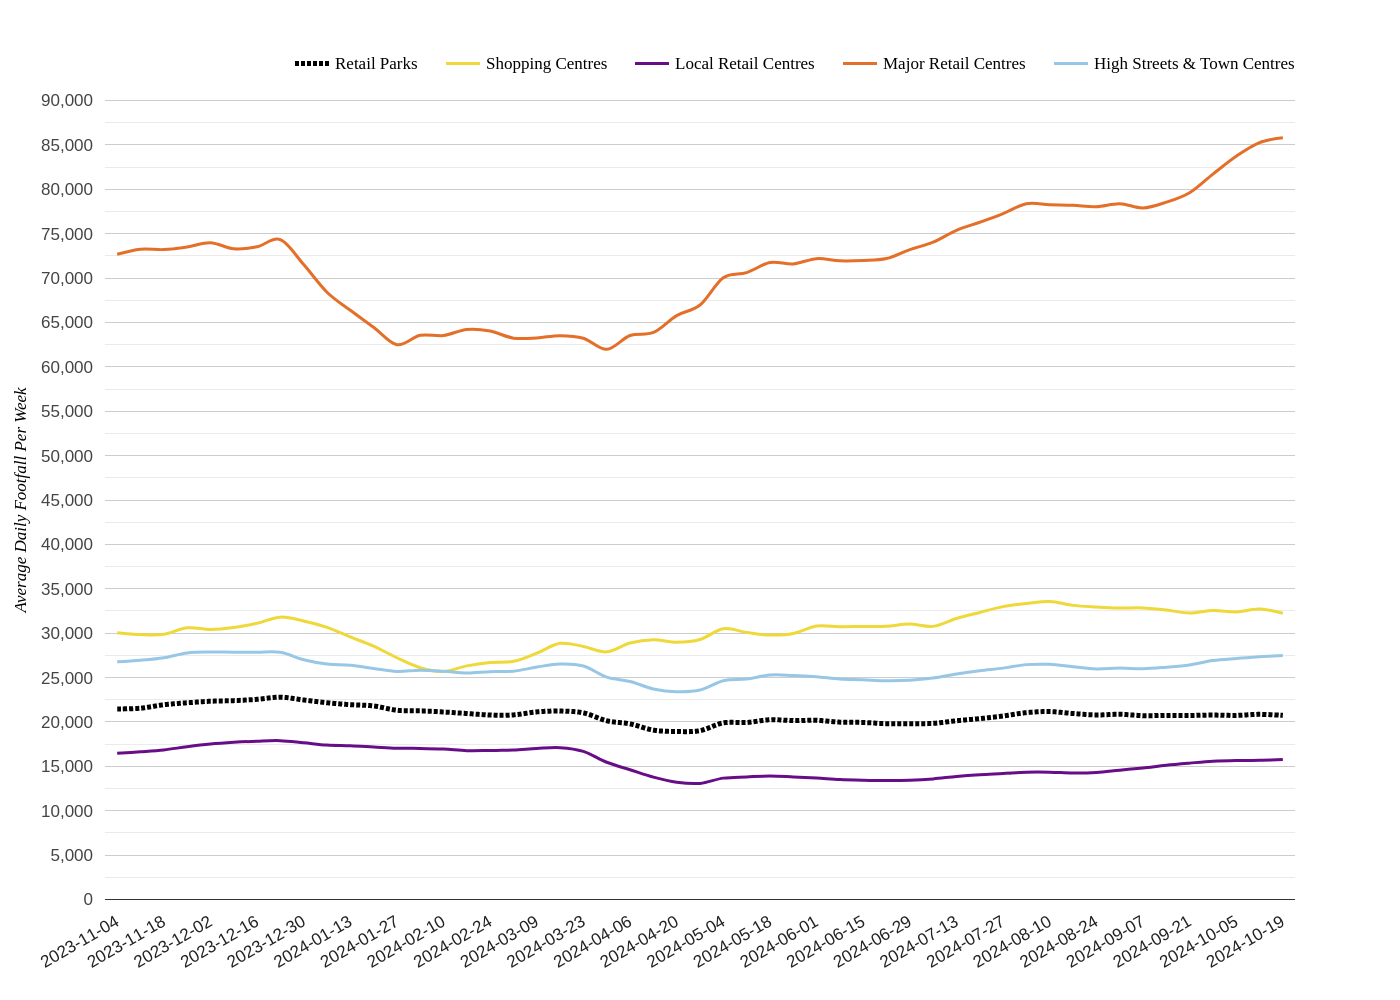
Major Retail Centres
According to the Major Retail Centres Footfall Report, Northern Ireland showcased the most dramatic year-on-year increase in both footfall and dwell time among all regions, indicating a robust retail rebound. In contrast, the East Midlands experienced a slight week-on-week decrease in footfall but showed a strong year-on-year recovery in consumer visits. London, a major retail hub, also saw an increase in footfall year-on-year, though the average visit dwell time slightly decreased week-on-week, suggesting a faster shopping experience.
Retail Parks
The Retail Parks Footfall Report highlights varied regional performances. The West Midlands saw stable footfall week-on-week with a modest year-on-year increase. London reported a slight increase in footfall week-on-week and a notable rise year-on-year. Scotland and the North West experienced substantial increases in dwell time, with Scotland also seeing a notable rise in weekday visitation shares.
Shopping Centres
The Shopping Centres Footfall Report points out that the East Midlands led with a significant increase in footfall week-on-week, marking it as one of the top performers. In contrast, Wales saw a noticeable decline in average daily footfall and dwell time compared to the previous year.
Local Retail Centres
According to the Local Retail Centres Report, Northern Ireland again stands out with a notable year-on-year increase in average daily footfall. However, regions like the South West experienced significant decreases in footfall year-on-year.
High Streets & Town Centres
The High Streets & Town Centres Footfall Report reveals that London led with a strong rise in footfall year-on-year, accompanied by an equally strong increase in dwell time. Conversely, the East Midlands and South East faced challenges, with noticeable drops in footfall year-on-year.
Market Outlook
The diverse trends observed across different types of retail centres and regions suggest that the next four weeks could see continued variations in footfall and dwell time. Areas with a year-on-year increase in dwell time may continue to see enhanced consumer engagement, while regions with declining footfall might face challenges unless strategic changes are implemented.
Partner with huq
Track consumer footfall and spend dynamics across your store network using huq data and compare to your own sales data. Gain insights into crucial questions such as ‘are we out-performing the market’, ‘where are our similar locations for new store growth’, and ‘how healthy is this retail centre’.
If you are interested in basing your location insights to actual consumer behaviour then please connect with our team.
Frequently Asked Questions
Clear answers to the most common questions about movement intelligence, retail expansion, and location analytics.
Related Blogs and Insights



.svg)
Empowering strategic teams with the world's most accurate and accessible location intelligence.
Contact

.svg)