
Find out where you can get the same coverage for less investment
Opening more retail stores in one area doesn’t guarantee greater market coverage, and assumptions can lead to wasted investment.
Our cross-visitation tool offers shared audience insights that can save you millions of pounds on stores you don't need while revealing unique market opportunities.
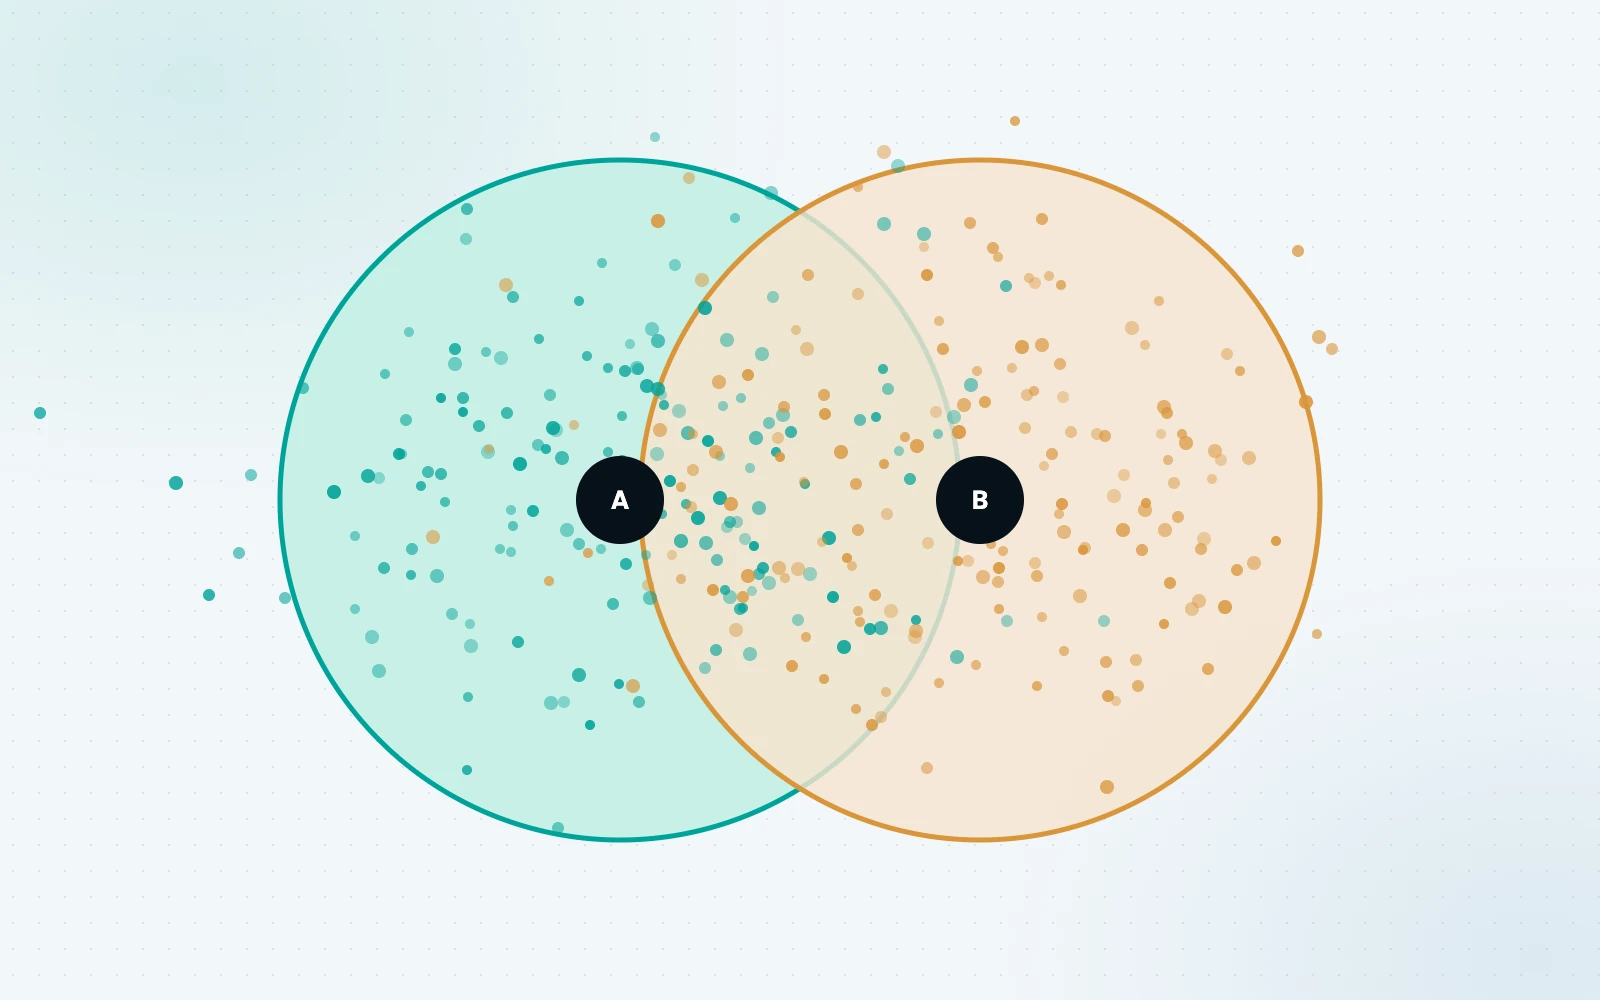
Under pressure from your CFO to justify spending on new stores? Retail network planners need accurate, comparative data to show the value of prospective sites or rule out locations that won’t deliver the desired market reach.
Cross-visitation insights eliminate guesswork, providing real-world analysis of visitor overlap between retail store locations.
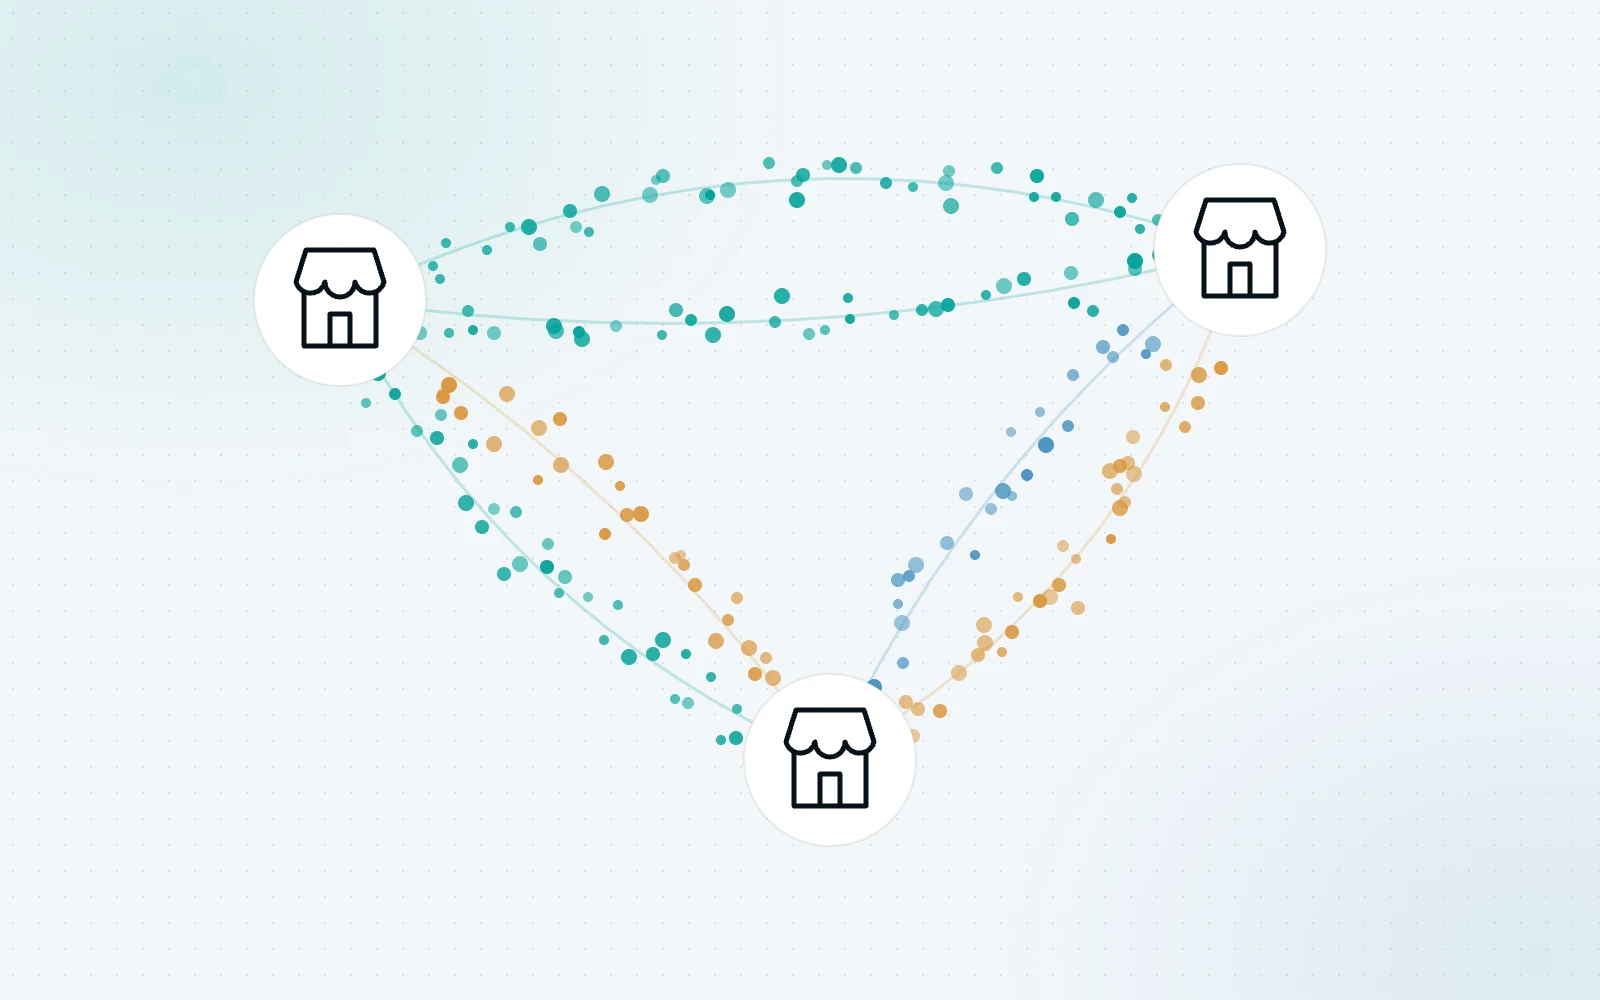
The solution combines and analyses footfall data from multiple trusted sources to show the degree of crossover between your chosen locations. This helps validate decisions and ensure that your expansion budget goes on new market coverage, not duplication.
Cross-visitation is quick and easy to use, generating results in seconds to show the percentage of visitors to one location who also visit another, revealing how distinct the audiences are.
Get comparative insights about malls, high streets and key retail areas that can save you weeks of planning and potentially millions from your retail expansion budget.
How to use huq’s cross-visitation tool in 3 simple steps…
You can select up to 10 location pairs in your chosen catchment area using an interactive map with built-in mall and shopping centre boundaries.
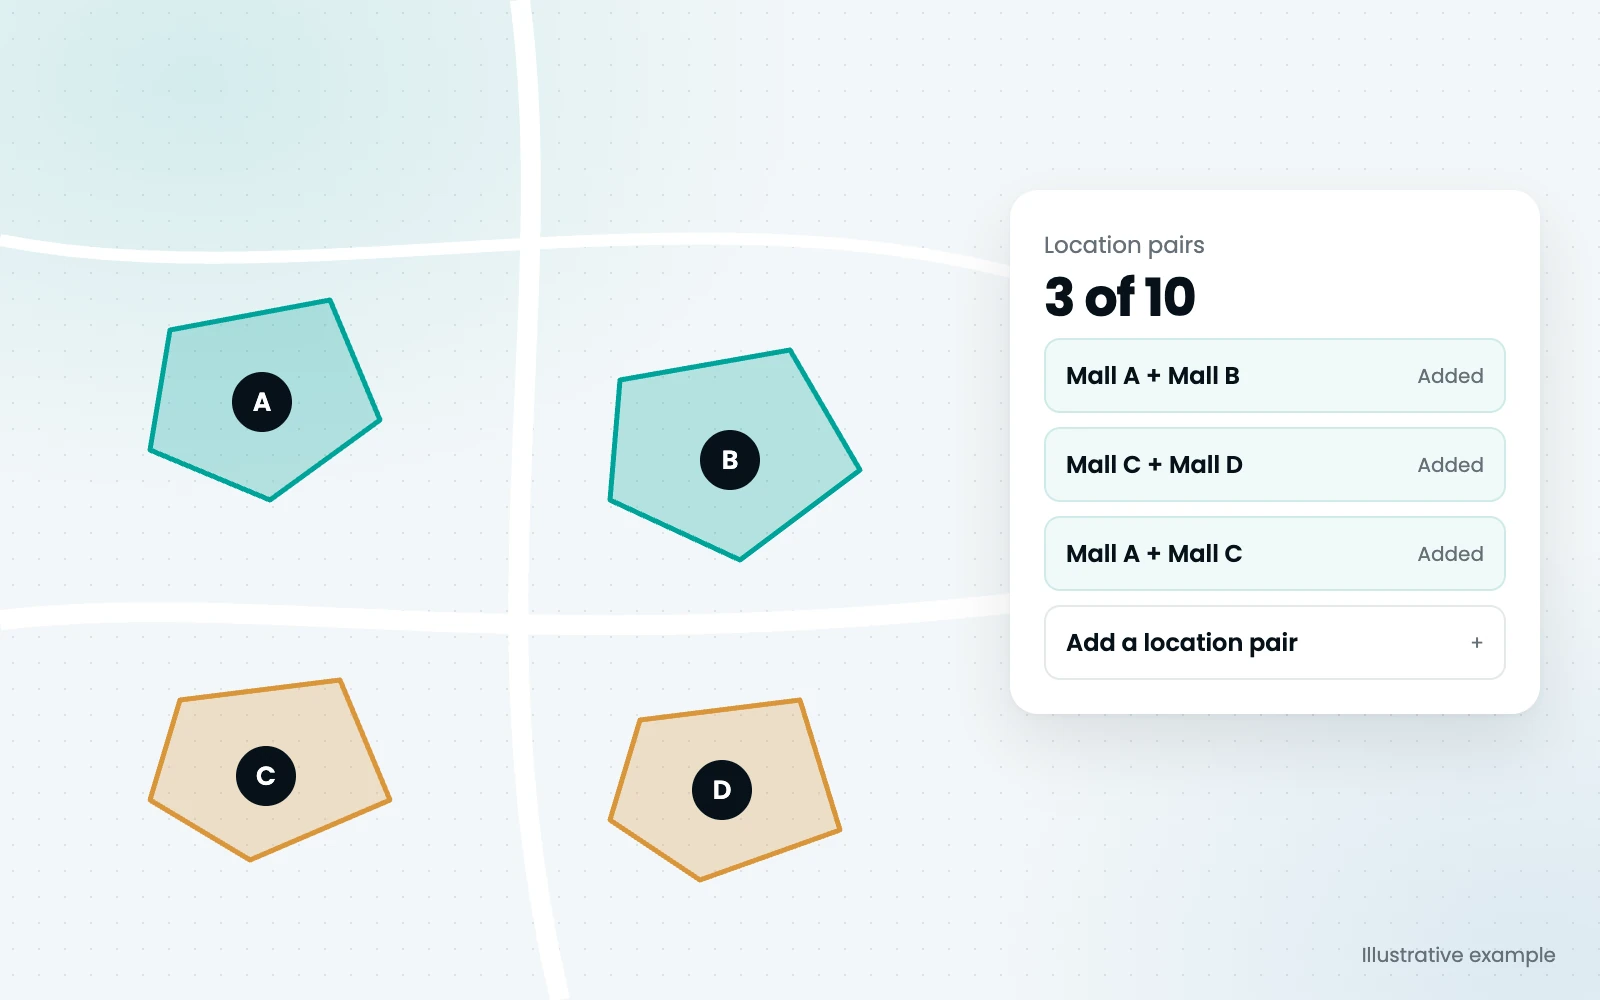
Our platform quickly measures visitor overlap, comparing real-world movement data in seconds. You'll see the percentage of visitors to one site that also visit the other and vice versa, plus an overall crossover figure.
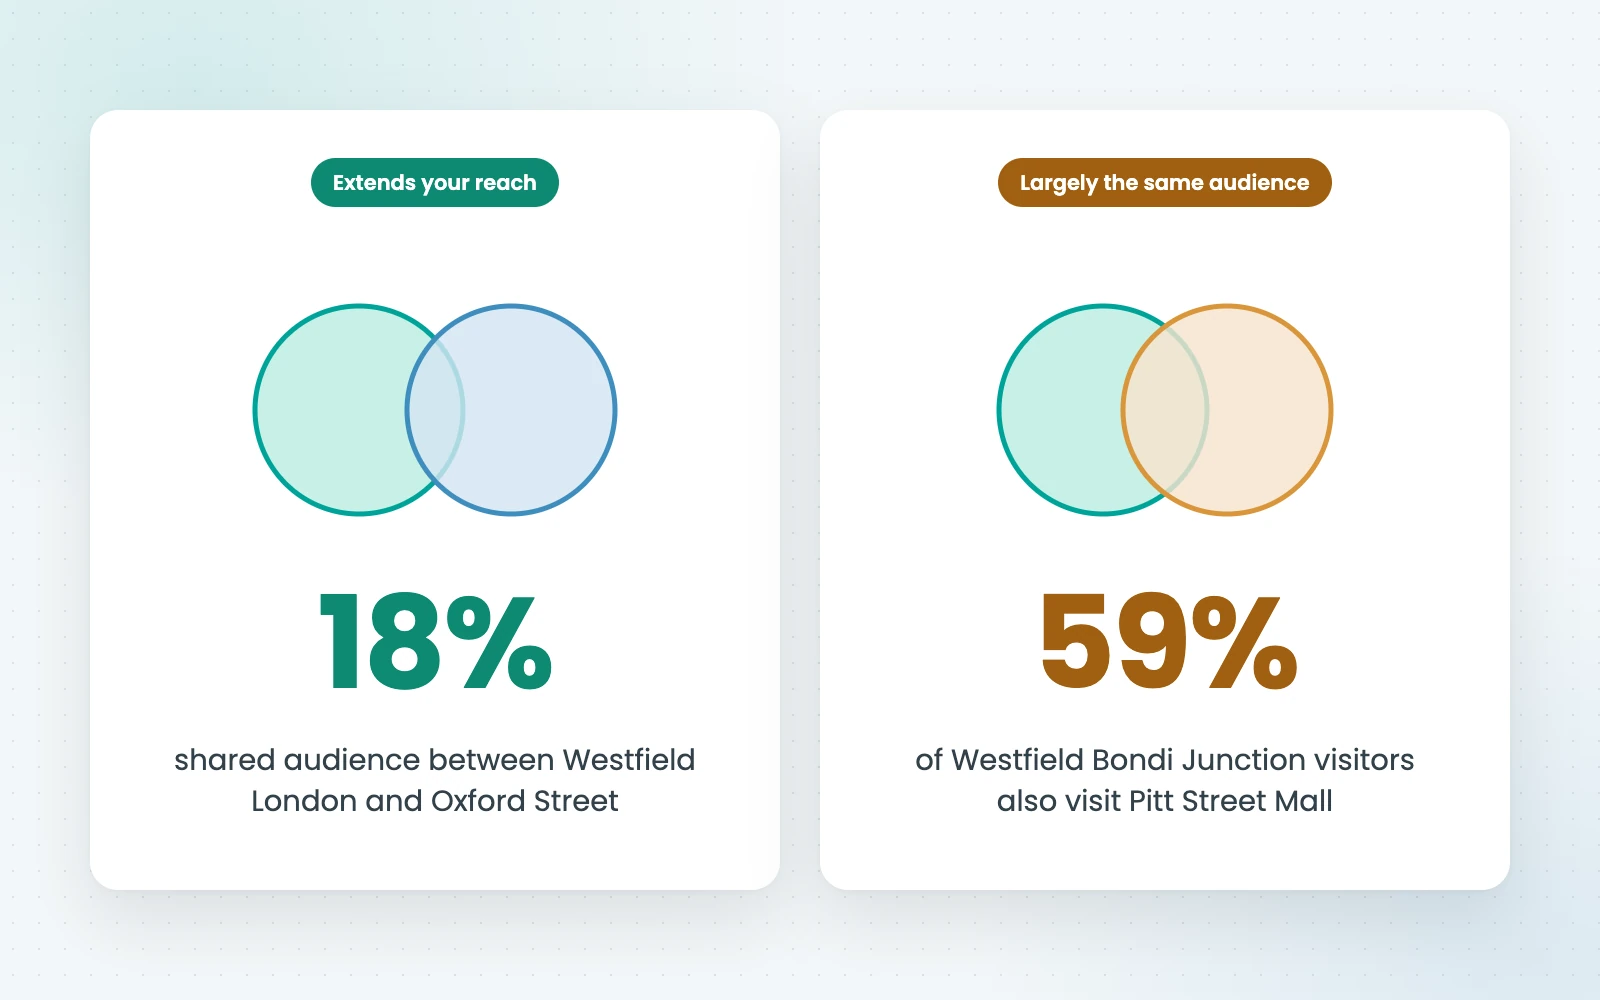
The analysis not only compares one store location with another, but also provides a results matrix that shows the correlation between numerous stores. This makes it easy to see which locations share largely the same audience, and which will actually increase reach.
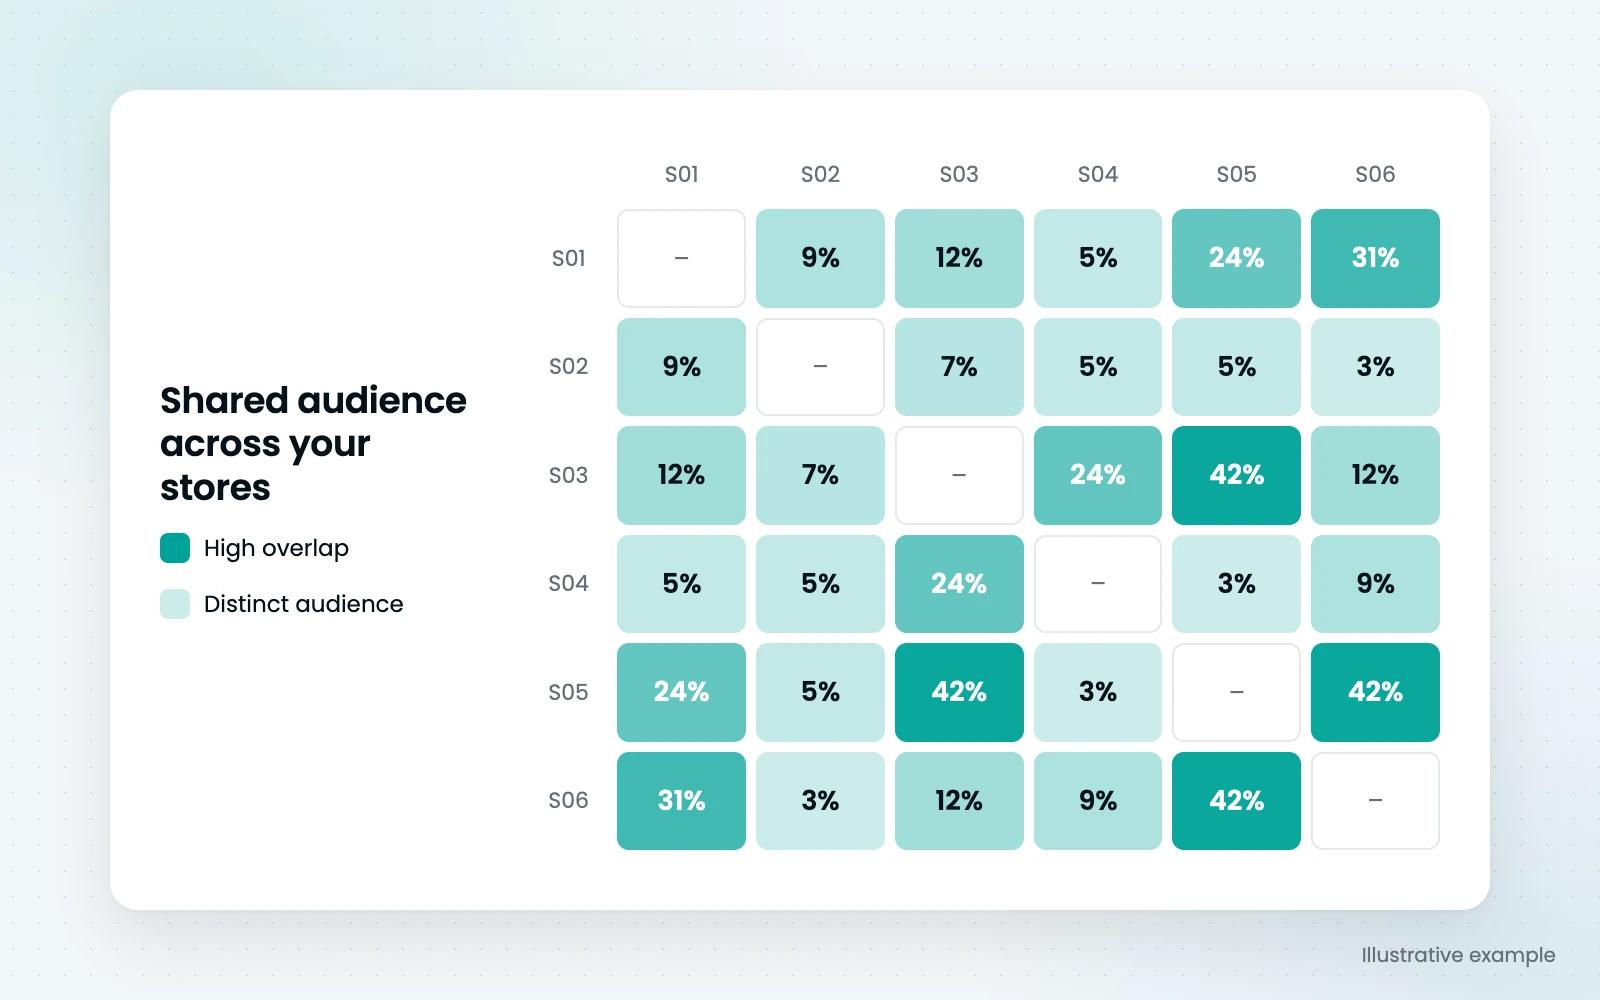
Cross-visitation insights offer fuel for smarter retail location planning. They help you identify stores with distinct audiences that equate to net-new customers, rather than duplication that can dilute footfall across your sites.
There’s growing demand for more sophisticated location planning and market intelligence. We help retailers validate prospective store locations before committing capital, replacing assumptions with interconnected data that tells a story about your audience’s movements.

Locations stress-tested

Trend data per result

MAPE vs CAA origin-destination data

Global markets cross-visitation is available in
We’re trusted by over 300 organisations, including some of the biggest global brands, offering data analysis that helps retailers get more customers through the doors for less.









huq's data has been a game-changer for us. The insights into footfall and visitor behaviour have given us the clarity we needed to optimise our retail strategy and make informed decisions.
Tom Haydney, UK Marketing & Product Manager, Kawai
huq’s platform gave us valuable data to support a key decision on potential new sites.
Dan Brogden, National Sales Manager, Puccinos
huq’s mobility data helps us to make better investment decisions and allows us to appropriately manage risk on behalf of our investor clients.
Jonathan Bayfield, Head of UK Real Estate Research, Aviva Investors
Are you paying for coverage you already have? Start a free trial or book a demo. We'll show you the visitor overlap between locations you're considering and where there’s untapped reach.
Still got questions? Here’s what you need to know about our cross-visitation insights, huq’s data and how we ensure its accuracy:
+
Thanks to our numerous retail technology and data partnerships, including Sensormatic, and ongoing stress-testing and refinements, we deliver market-leading accuracy. The solution has a 2% MAPE (Mean Absolute Percentage Error) against CAA (the UK Civil Aviation Authority) travel data. MAPE measures how far our estimates typically sit from the real, observed figure, so 2% MAPE means our results are, on average, within 2% of ground truth.
+
Our cross-visitation data combines multiple anonymised and aggregated visitor data sources, and huq validates its datasets using rigorous statistical methodologies and continuous benchmarking against real-world observations.
+
You can compare up to 10 location pairs at any one time. This reveals the correlation of visitor overlap across this portfolio of locations as a results matrix, which you can then drill into.
+
No. The huq platform is designed for business users rather than just analysts. It offers interactive maps and dashboards, intuitive visualisations and ready-to-use insights that let teams explore locations and compare shared audiences without specialist data expertise. However, if you book a demo, our team will provide step-by-step guidance on using the cross-visitation tool and answer any questions you have.
+
You can start with a guided demo or sign up right away. Most organisations can begin exploring the platform shortly after onboarding. Our team works closely with every customer to configure the right datasets, demonstrate key workflows and show you how cross-visitation and our other tools work.
+
Cross-visitation insights are currently available in 35 global markets, including the UK and across Europe, with more countries to be added in the near future. Coverage varies by region, and we can advise you on the datasets and geographic availability that are relevant to your requirements.

Empowering strategic teams with the world's most accurate and accessible location intelligence.
Contact

