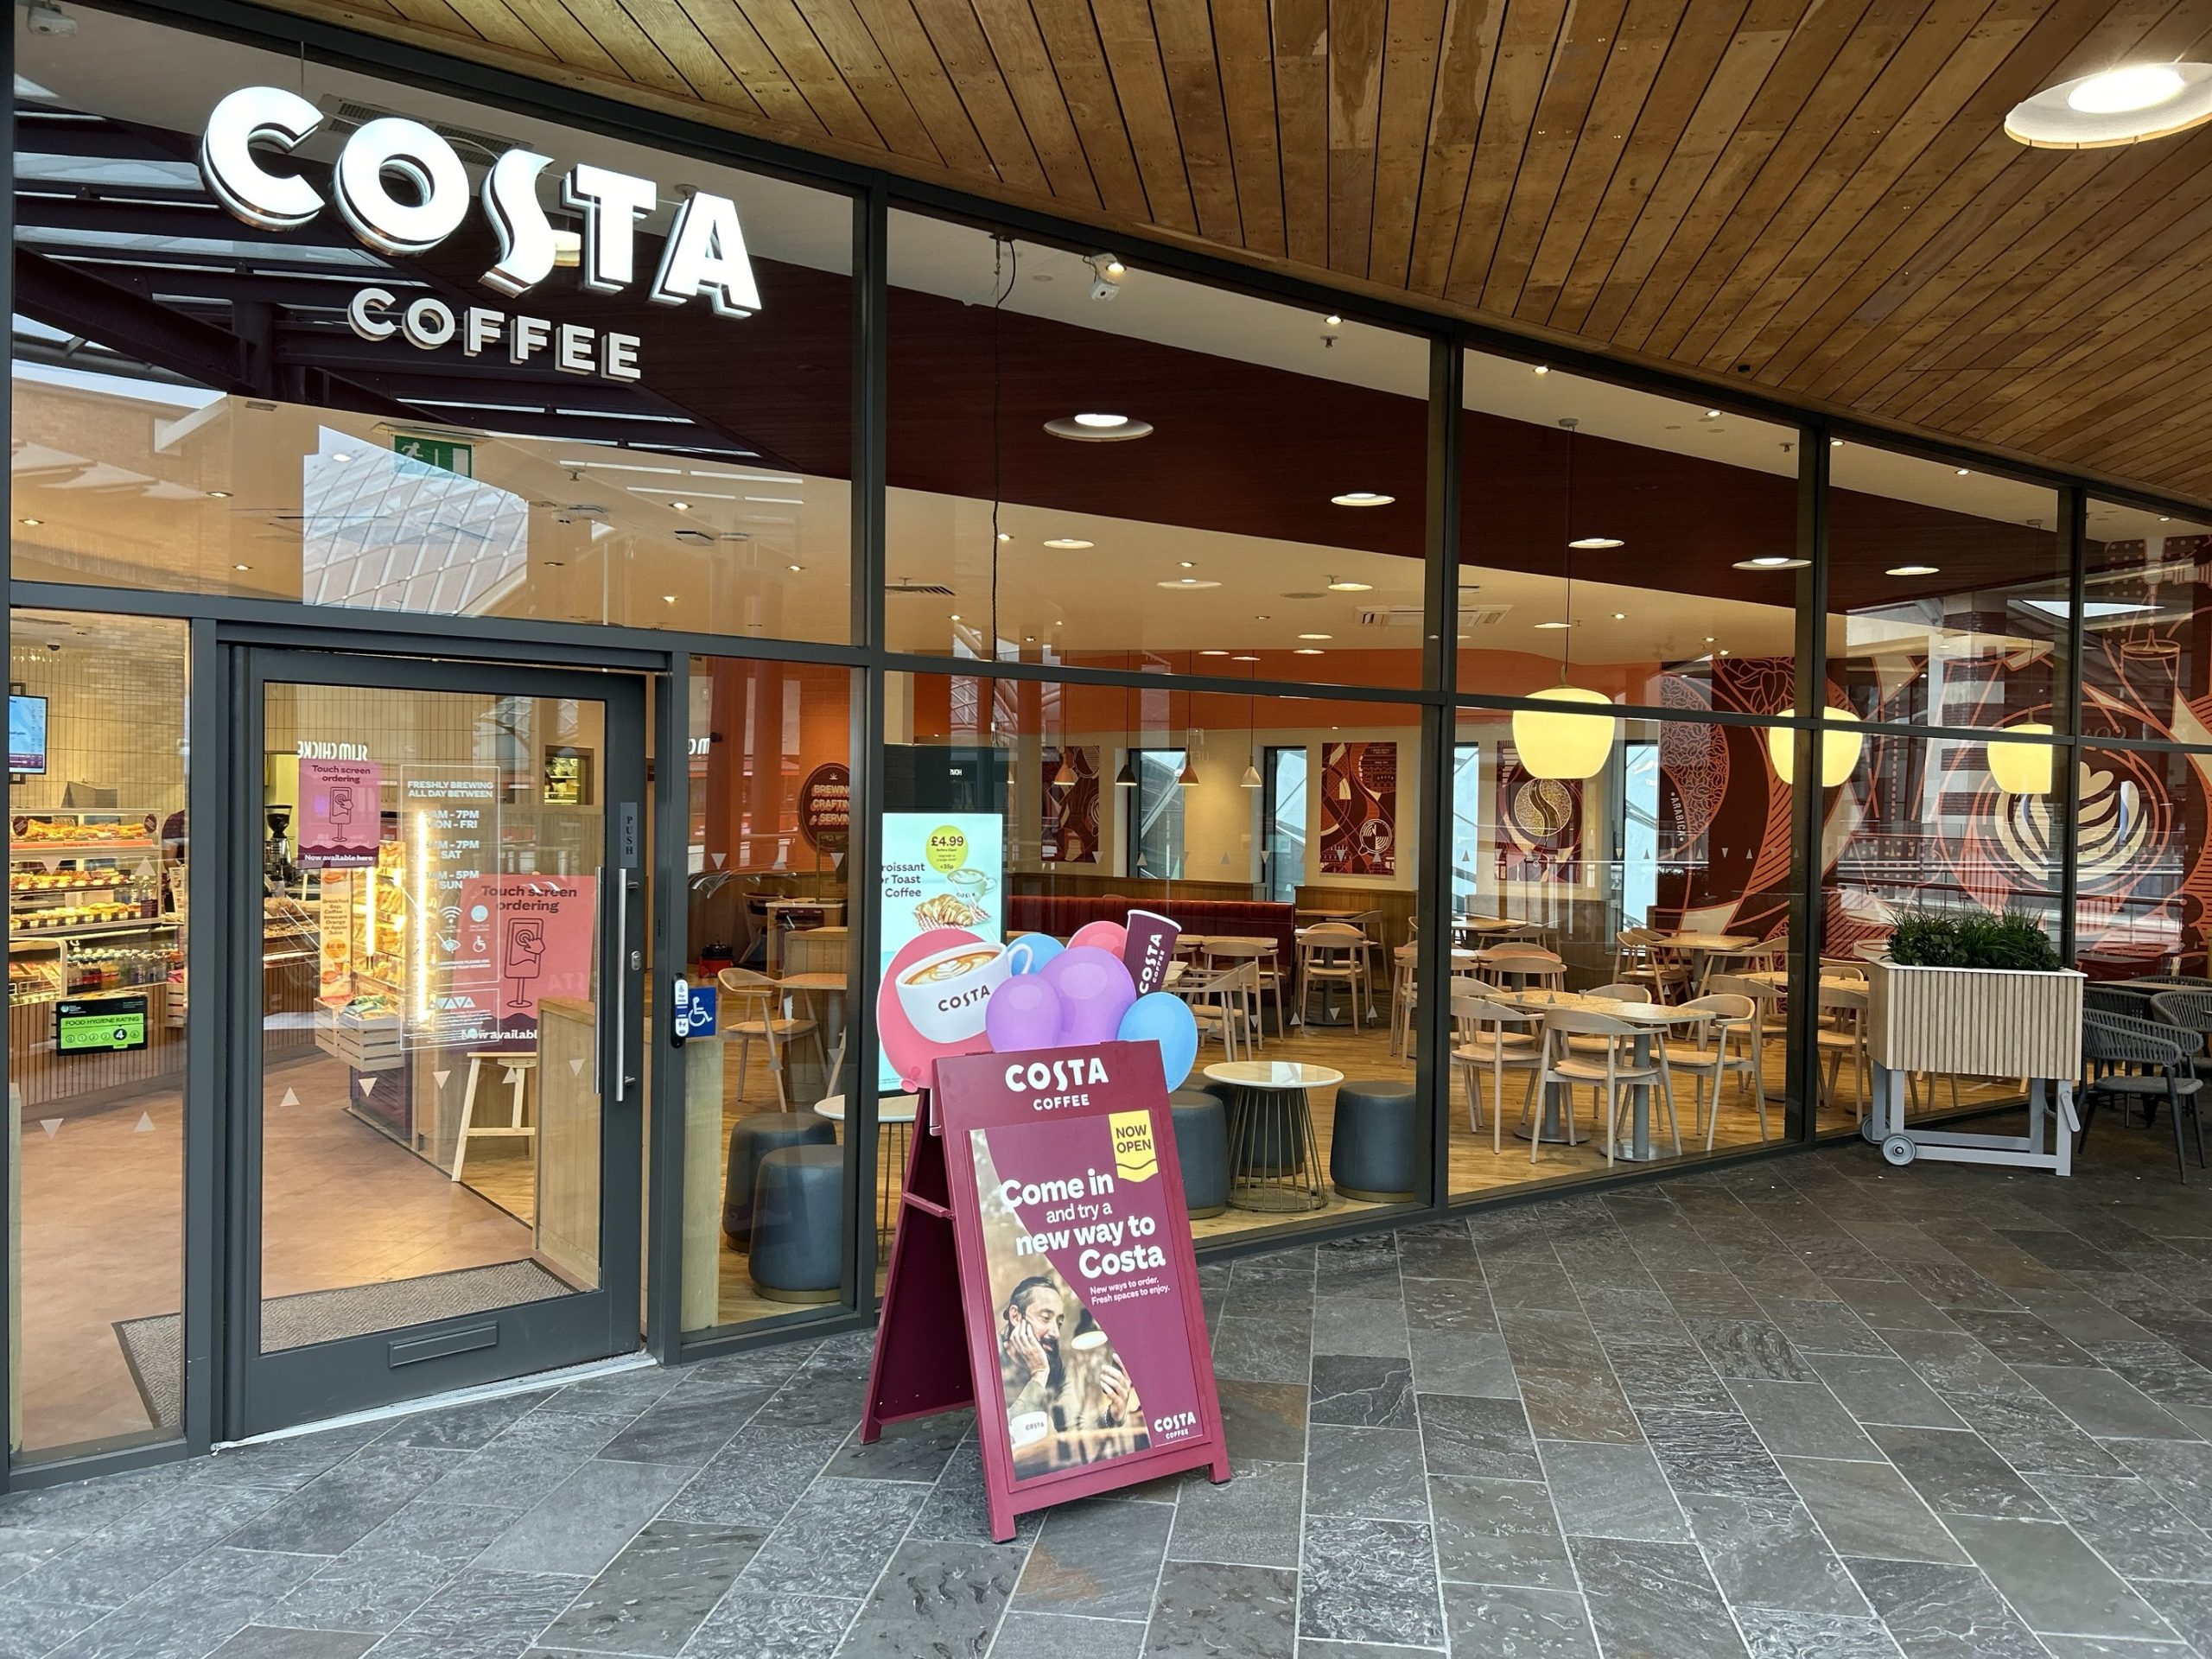
Costa Coffee: The High Street Challenge
Identifying Market Dynamics to Understand Commercial Performance
Costa Coffee, the UK’s largest coffee chain, faced post-COVID sales fluctuations across high street stores. They needed to determine if these changes were due to a market-wide reduction in footfall or issues specific to their brand.
Key takeaways from this case study
“By blending footfall data with Costa’s sales information, we helped Costa turn data insights into actionable optimisation strategies for their store network.
Easier performance assessment
Huq’s footfall data allows Costa to more accurately quantify the performance of a location.
Valuable historical comparison
Huq enables Costa to properly assess changes to visitor numbers over longer periods.
Better strategic planning for new stores
Huq’s data-driven insights help inform retail strategies and key decisions.
Clearer visitor trends and insights
Visitor data is now more informative and actionable.
Client Overview
Costa Coffee, the UK’s largest coffee chain, has a well-established presence across high streets, retail centres, transport hubs and Drive Thrus. Like many quick service brands, Costa faced significant changes post-COVID and needed to assess the underlying trends affecting their high street store performance specifically.
In the post-COVID landscape, Costa experienced fluctuations in sales across their high street stores. Some stores performed well, while others were underperforming, particularly in areas that had historically been strong. The key question for Costa was: are these shifts driven by a market-wide reduction in footfall, or was the brand experiencing an issue specific to their stores?

Informing strategy: Costa found that smaller retail centres with stronger pitches tended to perform better. Using these insights, Costa created an updated network strategy that focused on relocating stores to prime locations with higher footfall.
The Challenge
Costa needed an objective way to measure footfall at each of their high street locations. By comparing this data with sales figures, they hoped to uncover their penetration rate both pre and post covid. This would provide a clearer view of whether Costa was underperforming or outperforming in certain locations, helping them refine their overall store strategy going forward.
Costa needed insights to:
1
Measure footfall for each high street store to understand location performance.
2
Combine different datasets for a more accurate picture of store performance.
3
Track penetration rates across chosen stores.
Huq's Solution
Huq provided Costa Coffee with detailed footfall data across all of their high street locations from 2019 to 2023. This data allowed Costa to see foot traffic patterns and trends, both before and after the pandemic. Huq data was seamlessly integrated into Costa’s existing sales and store attribute database, enabling Costa to gain comprehensive insights into footfall penetration and how it had shifted over time at store level.
High Street Footfall
Spanning 5 years, this data captured the number of visitors passing by Costa’s high street stores on a daily basis.
Density Metrics
This helped Costa assess footfall levels across the retail centre, identifying primary, secondary and tertiary pitches.
Historical Comparison
By using data from both pre- and post-COVID years, Costa could effectively track changes in footfall trends and relate them to store performance.
How Huq's Solution Helped
Using Huq’s footfall data, Costa was able to blend these insights with its own beverage sales data to calculate the penetration rate at each store. This allowed them to determine the percentage of footfall that turned into actual customers and how this has changed over time.
Penetration Rate
Costa identified a typical penetration rate of 1.5% - 3.5% of total footfall, depending on pitch and retail centre type. Prime retail locations had higher penetration rates and more robust sales while tertiary sites had seen a decrease in both footfall and sales, with some stores experiencing volume drops of more than 20%.
Data Driven Decisions
By incorporating Huq’s footfall data into its location strategy, Costa was able to make strategic decisions to secure more profitable locations.
Informing Strategy
Costa found that smaller retail centres and stronger pitches tended to perform better. Using these insights, Costa created an updated network strategy that focused on relocating high street stores to prime locations with higher footfall as well as focussing on less competitive smaller centres for new store growth activity in order to drive performance.
Final comments
With Huq’s footfall data, Costa Coffee was able to gain valuable insights into the health of their high street store portfolio. By identifying areas where footfall had dropped and then comparing this to sales performance, Costa developed an understanding that the market, rather than their brand, had changed in certain locations. Huq underpinned a data-driven strategy for relocating underperforming stores and focusing future investments towards high-potential locations.
“Footfall trends don’t just reflect market conditions; they reveal opportunities to optimise and maximise sales in retail environments.”
This case demonstrates how Huq’s consumer footfall data can be a powerful tool for retailers looking to understand market trends and benchmark performance, ultimately driving profitability into their store network, simply by knowing where their consumers are.
Is your business facing similar challenges?
Our experienced team can demonstrate how to use location intelligence and analytics to augment a wide range of use cases, including:
- Identifying locations for new stores
- Optimising your existing store portfolio
- Informing your pricing strategy
- Improving the effectiveness of marketing
- Benchmarking performance across locations
- Understanding competitor landscape
- Optimising opening hours


