.svg)
Weekly Wrap: UK Retail Footfall Trends: Week 2, 2025
Discover the latest shifts in UK retail footfall, with significant changes in London, Wales, and the South West as of January 19, 2025.

January 23, 2025
2 min read
Table of contents
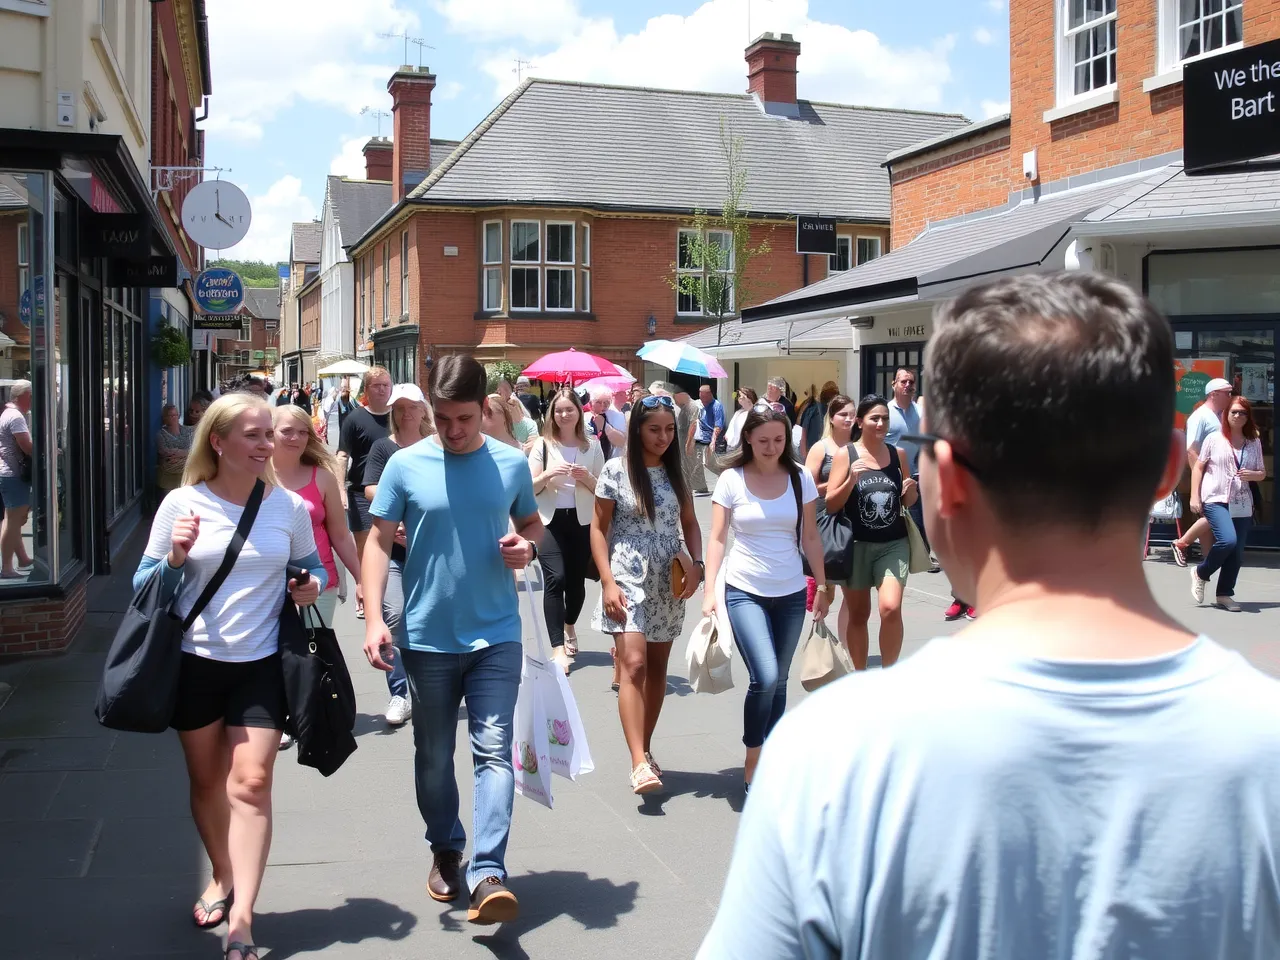
In the second week of 2025, the UK retail landscape exhibited varied trends across different types of retail centres and regions, highlighting the dynamic nature of consumer behaviour and the evolving market conditions. Huq Industries' comprehensive data provides crucial insights into these trends, which are essential for retailers and commercial real-estate companies strategizing in the current economic climate.
Daily Footfall by Retail Centre Type
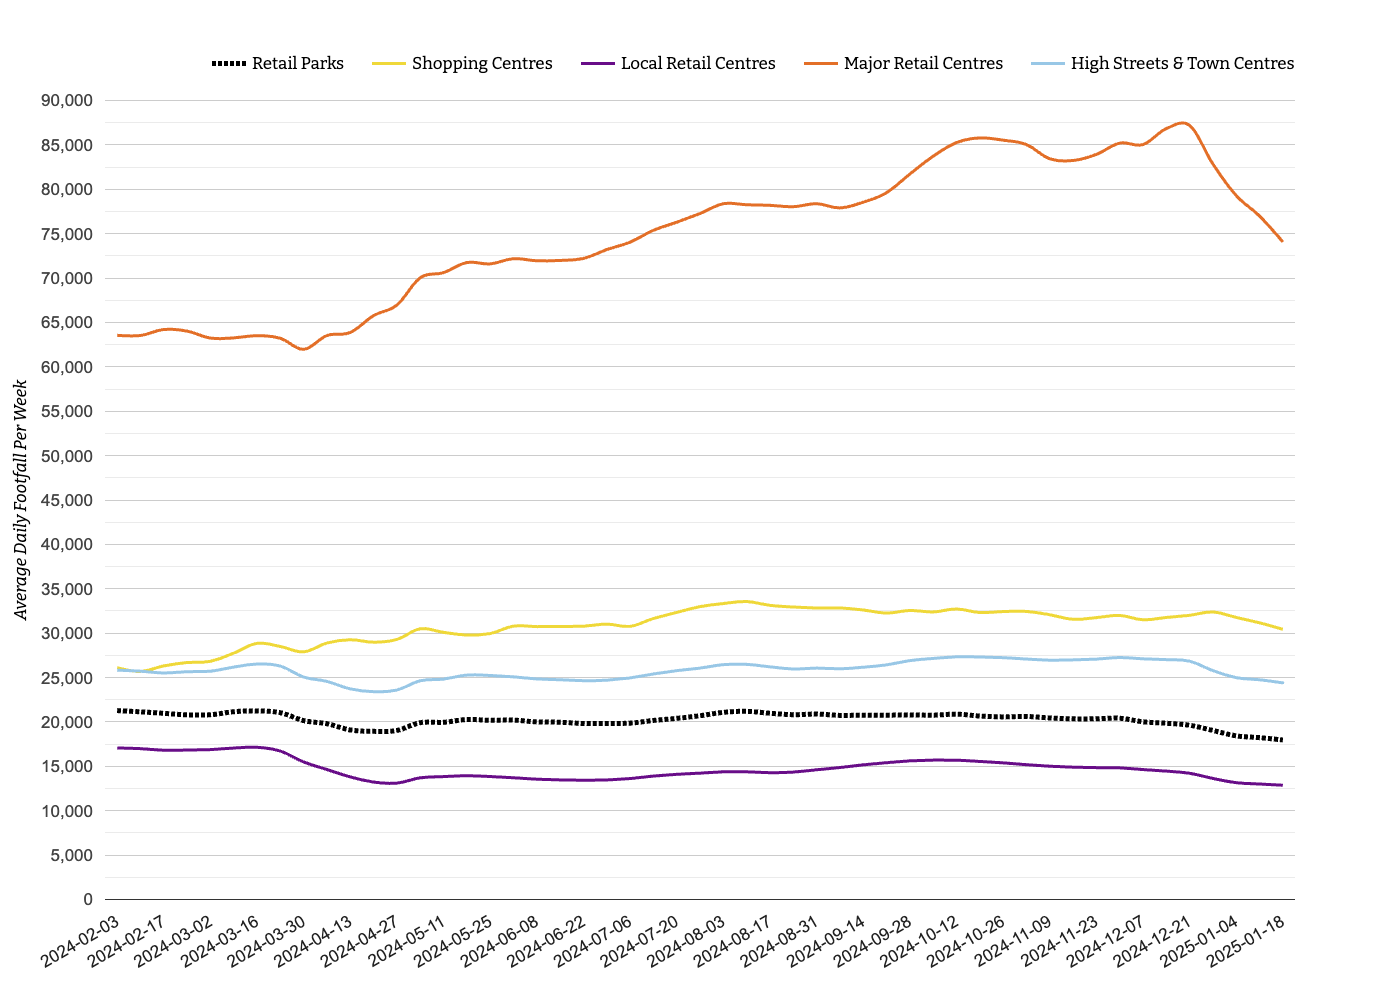
Retail Parks
In London, retail parks have seen an 8% increase in dwell time year-on-year, suggesting a preference for longer shopping trips. This trend is also observed in the East of England, where dwell time has increased by 10%. However, footfall in the South West has dropped, and Scotland also saw a marked decrease. These outcomes indicate a varying degree of retail recovery and consumer confidence across the UK. Read more about Retail Parks Footfall.
Major Retail Centres
Major retail centres have shown notable changes. In Wales, the average daily footfall has increased by 3.4%, but the average visit dwell time has decreased by 9.6%, indicating shorter visits. The South East and East Midlands have experienced increases in dwell time by 1.8% and 7.1%, respectively. However, the South West faced challenges with a decrease in average daily footfall and in dwell time. Read more about Major Retail Centres Footfall.
Local Retail Centres
Local retail centres in Wales have seen an increase in dwell time, while London's footfall rose by 2.7%. The South East also reported a significant year-on-year increase in dwell time, showcasing a shift towards longer shopping experiences. Read more about Local Retail Centres Footfall.
Shopping Centres
Shopping centres across the UK presented mixed results. The East Midlands recorded a decrease in both footfall and dwell time, while the South East saw an increase in dwell time to 136 minutes. London showed a robust increase in footfall year-on-year, although dwell time decreased. Read more about Shopping Centres Footfall.
High Streets & Town Centres
High streets and town centres also displayed diverse trends. London's footfall increased year-on-year, contrasting with declines in the North East and Wales. Scotland saw a slight week-on-week decrease in footfall but an increase in dwell time, indicating more extended visits. Read more about High Streets & Town Centres Footfall.
Market Outlook
The data suggests that the coming weeks will likely see continued growth in dwell times in areas like London and the East of England. However, regions such as the South West and Scotland might not experience significant changes in footfall. Retailers and commercial real-estate companies should monitor these trends closely to optimise their strategies in the rapidly evolving UK retail market.
Huq Industries' detailed and region-specific data is invaluable for understanding and adapting to the evolving market dynamics in the UK's retail sector. As one of the leading location intelligence companies, huq provides essential insights that help businesses strategise effectively.
Frequently Asked Questions
Clear answers to the most common questions about movement intelligence, retail expansion, and location analytics.
Related Blogs and Insights



.svg)
Empowering strategic teams with the world's most accurate and accessible location intelligence.
Contact

.svg)