.svg)
Week 35 2025 Footfall Performance: UK Local Retail Centres Update
UK Local Retail Centres experienced a modest 2.3% week-on-week increase in footfall, even as overall visitor numbers show a 5.1% year-on-year decline. Regional variations and dwell time improvements add further complexity to the current retail landscape.

September 12, 2025
3 min read
Table of contents
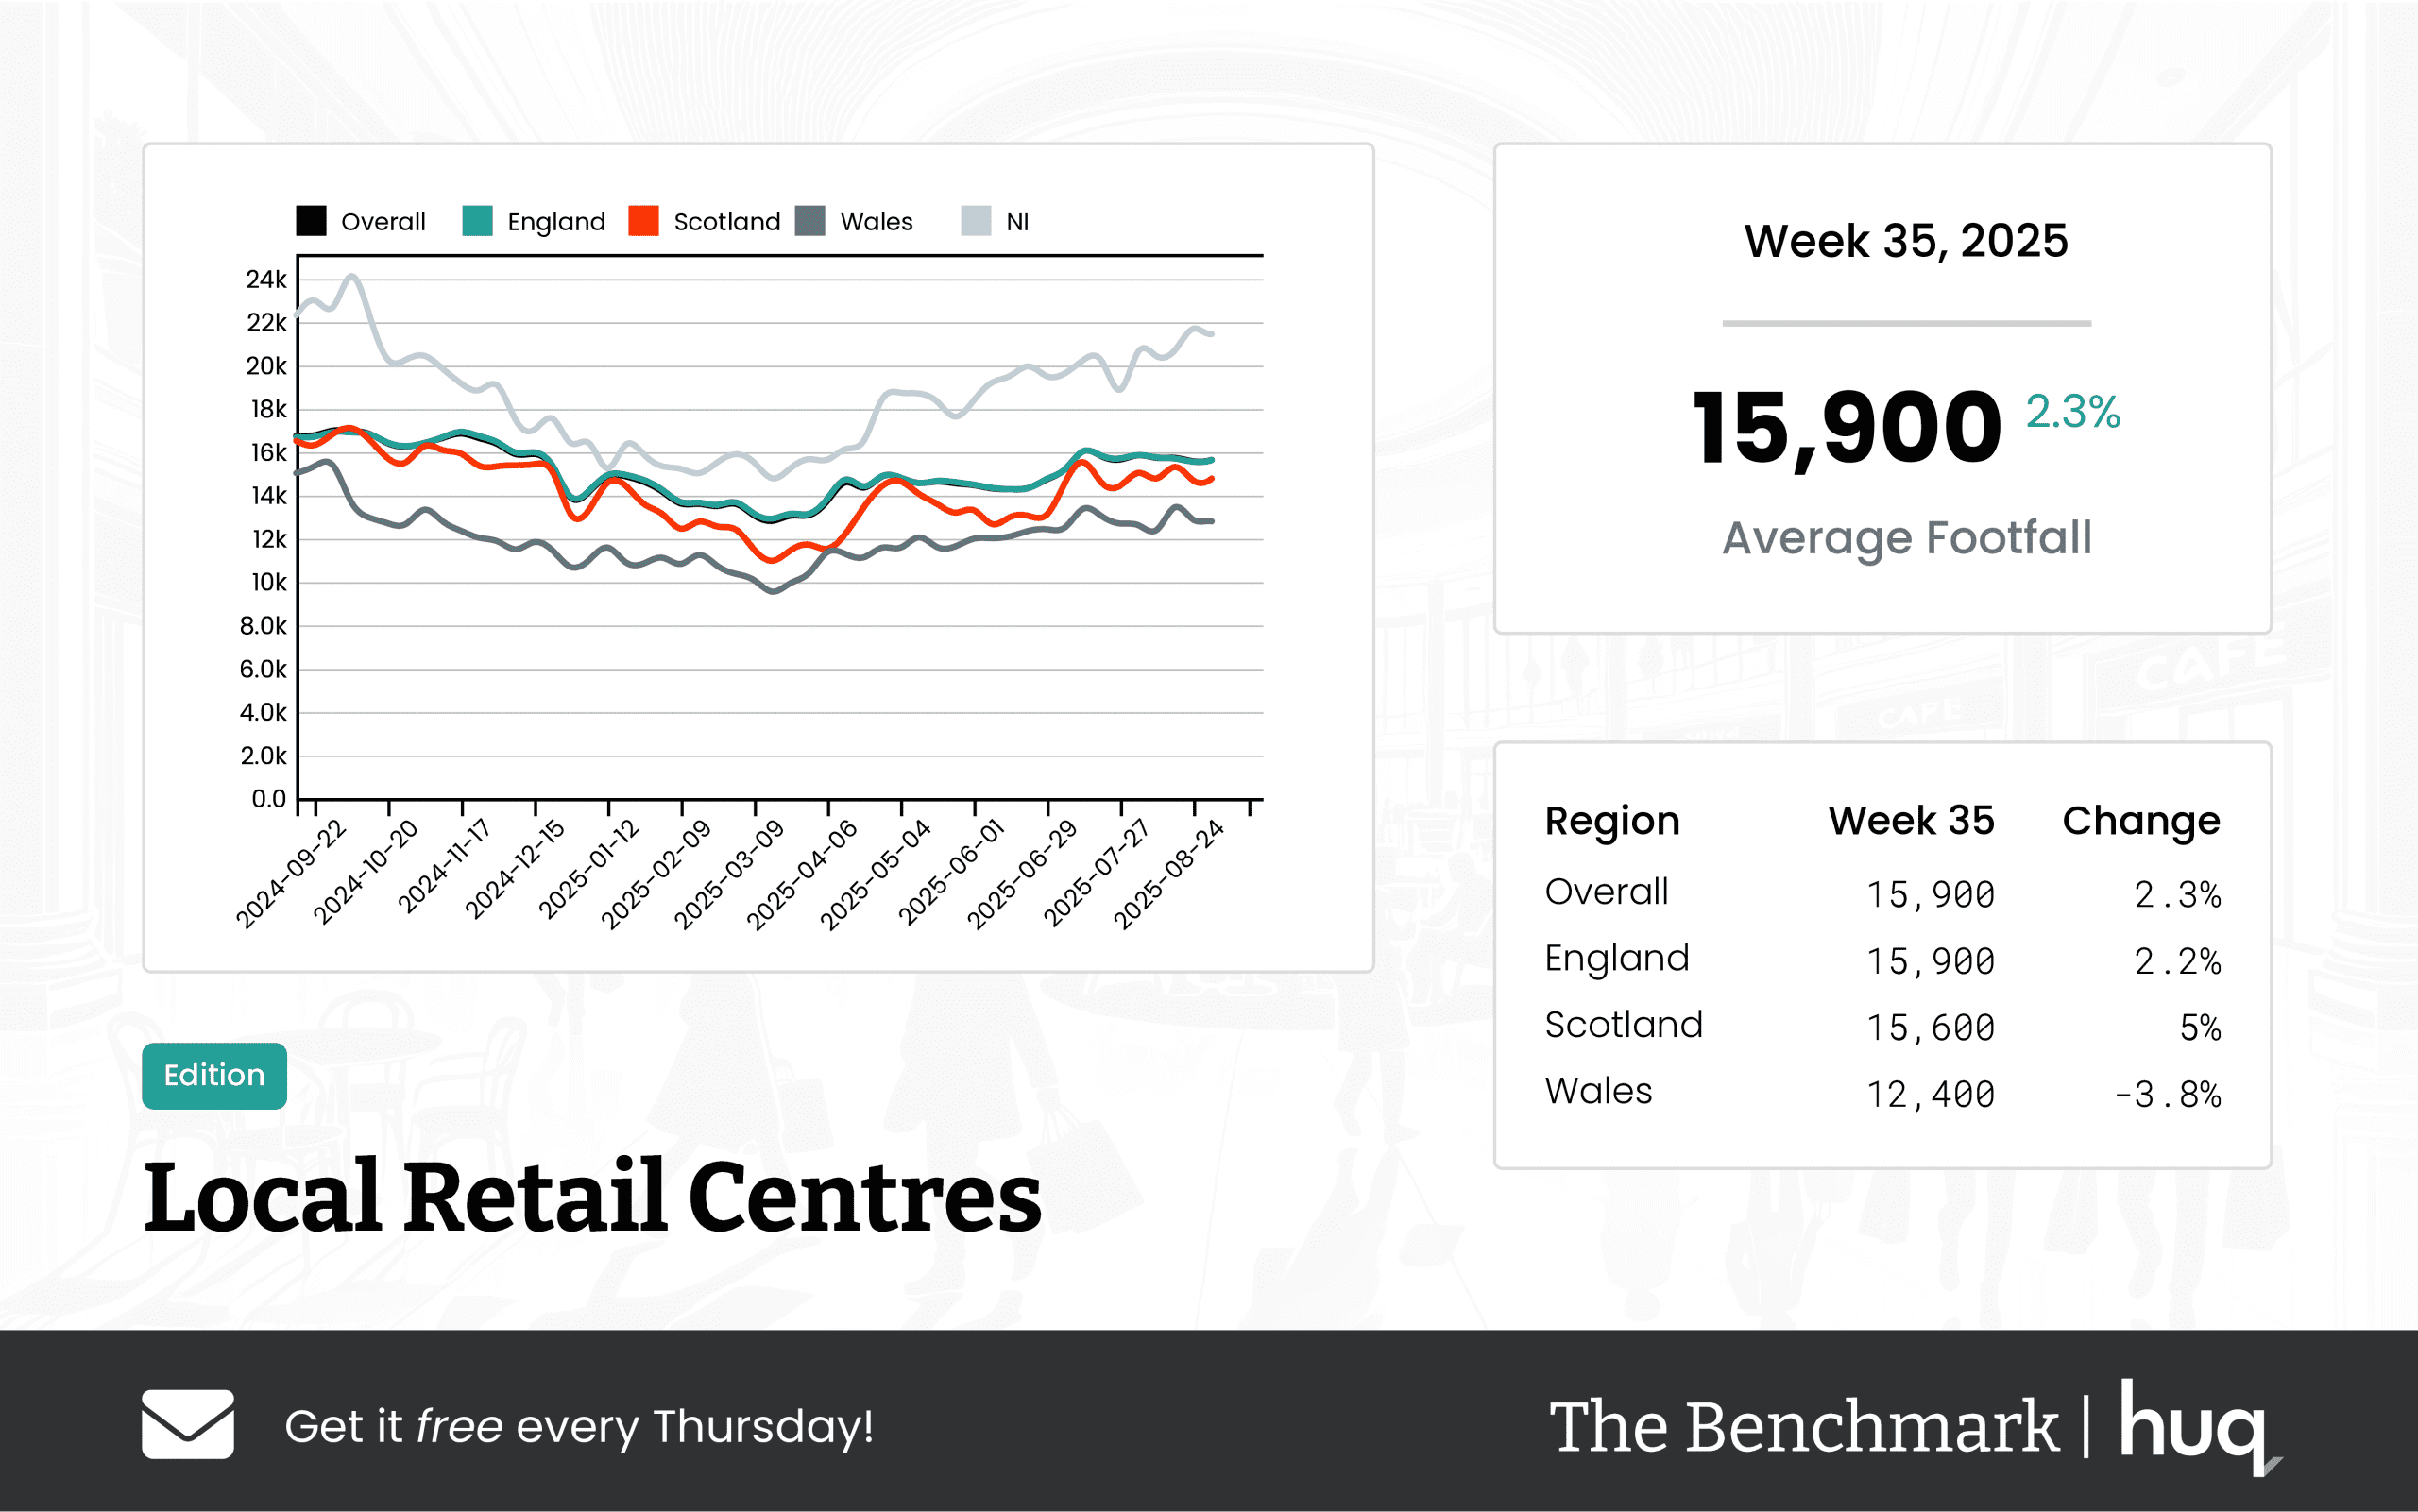
The latest footfall performance data for UK Local Retail Centres paints a mixed picture. Over Week 35 of 2025, centres recorded an average daily footfall of 15,900—a 2.3% increase on a week-on-week basis—something that could be interpreted as a short-term rebound. However, when compared to the same period last year, there is a 5.1% decline, reflecting ongoing shifts in visitor behaviour and seasonal fluctuations.
Overall Performance
The Benchmark's data highlights the interplay of short-term gains and long-term challenges. While there is evidence of a modest recovery from week-to-week increases, the comparative decline on an annual basis suggests that the retail sector is adjusting to broader market trends and evolving consumer preferences.
Regional Overview
England closely mirrors the national performance with an average of 15,900 visitors per day, a steady week-on-week increase of 2.2%, and a year-on-year decline of 4.9%. Scotland, though slightly lower with an average of 15,600 daily visitors, shows a robust week-on-week rise of 5% despite a comparable annual drop of 5.7%. In contrast, Wales is facing notable challenges. With an average daily footfall of 12,400, the region experienced a 3.8% drop in a single week coupled with a significant 17.8% fall year-over-year. These disparities underline how varied regional economic factors and market dynamics continue to influence retail centre performance.
Dwell Time Performance
The data on visitor dwell time reveals encouraging signs for retailer engagement. Across all centres, visitors now spend an average of 98 minutes on-site—up 3.2% from the previous week and showing a promising 7.7% rise compared to last year. In England, this metric improves further to 99 minutes, with a weekly surge of 4.2% and an 8.8% annual increase. Scotland mirrors this positive movement with a sharp weekly increase of 16.7% and a 12.6% year-on-year gain. Interestingly, although Wales boasts the longest dwell time at 126 minutes, it saw a weekly decrease of 13.7%, even though the annual increase is at 16.7%. This suggests that while visitor engagement remains high in certain regions, short-term factors are influencing time spent within these centres.
Industry Comment
Joe Capocci, Spokesperson for Huq Industries, noted that "the notable decline in Wales’ footfall coupled with the recent retail industry news on fashion-focused events underscores how local dynamics continue to challenge and shape visitor behaviour across the UK." His remarks emphasize that while the data indicate some positive trends in terms of dwell time and short-term footfall gains, localised events and regional economic conditions are playing a critical role in shaping retail centre performance.
Conclusion
Week 35’s footfall performance data reveals both encouraging improvements and significant regional disparities. As local retail centres navigate a complex and evolving market landscape, ongoing analysis of these trends will be crucial for strategic planning and operational adjustments across the UK.
Media: For all media and press enquiries, please contact media@huq.io
About Huq Industries
Huq Industries is the leading provider of location intelligence across the UK, Europe, and the Middle East, specialising in delivering high-quality data insights on footfall, consumer behaviour, and retail performance. By leveraging advanced analytics, Huq Industries enables retailers and analysts to understand and respond to market trends effectively, ensuring they are well-equipped to navigate the changing landscape of high street and town centre commerce.
Get the latest intelligence Benchmark update each Thursday!
Frequently Asked Questions
Clear answers to the most common questions about movement intelligence, retail expansion, and location analytics.
Related Blogs and Insights



.svg)
Empowering strategic teams with the world's most accurate and accessible location intelligence.
Contact

.svg)