.svg)
Week 25, 2025 Local Retail Centres Performance Update: Location Analytics Trends
UK local retail centres recorded a modest 5.1% weekly footfall increase and a 3.4% annual decline, signalling resilience. Location analytics and footfall data indicate a gradual recovery.

July 3, 2025
2 min read
Table of contents
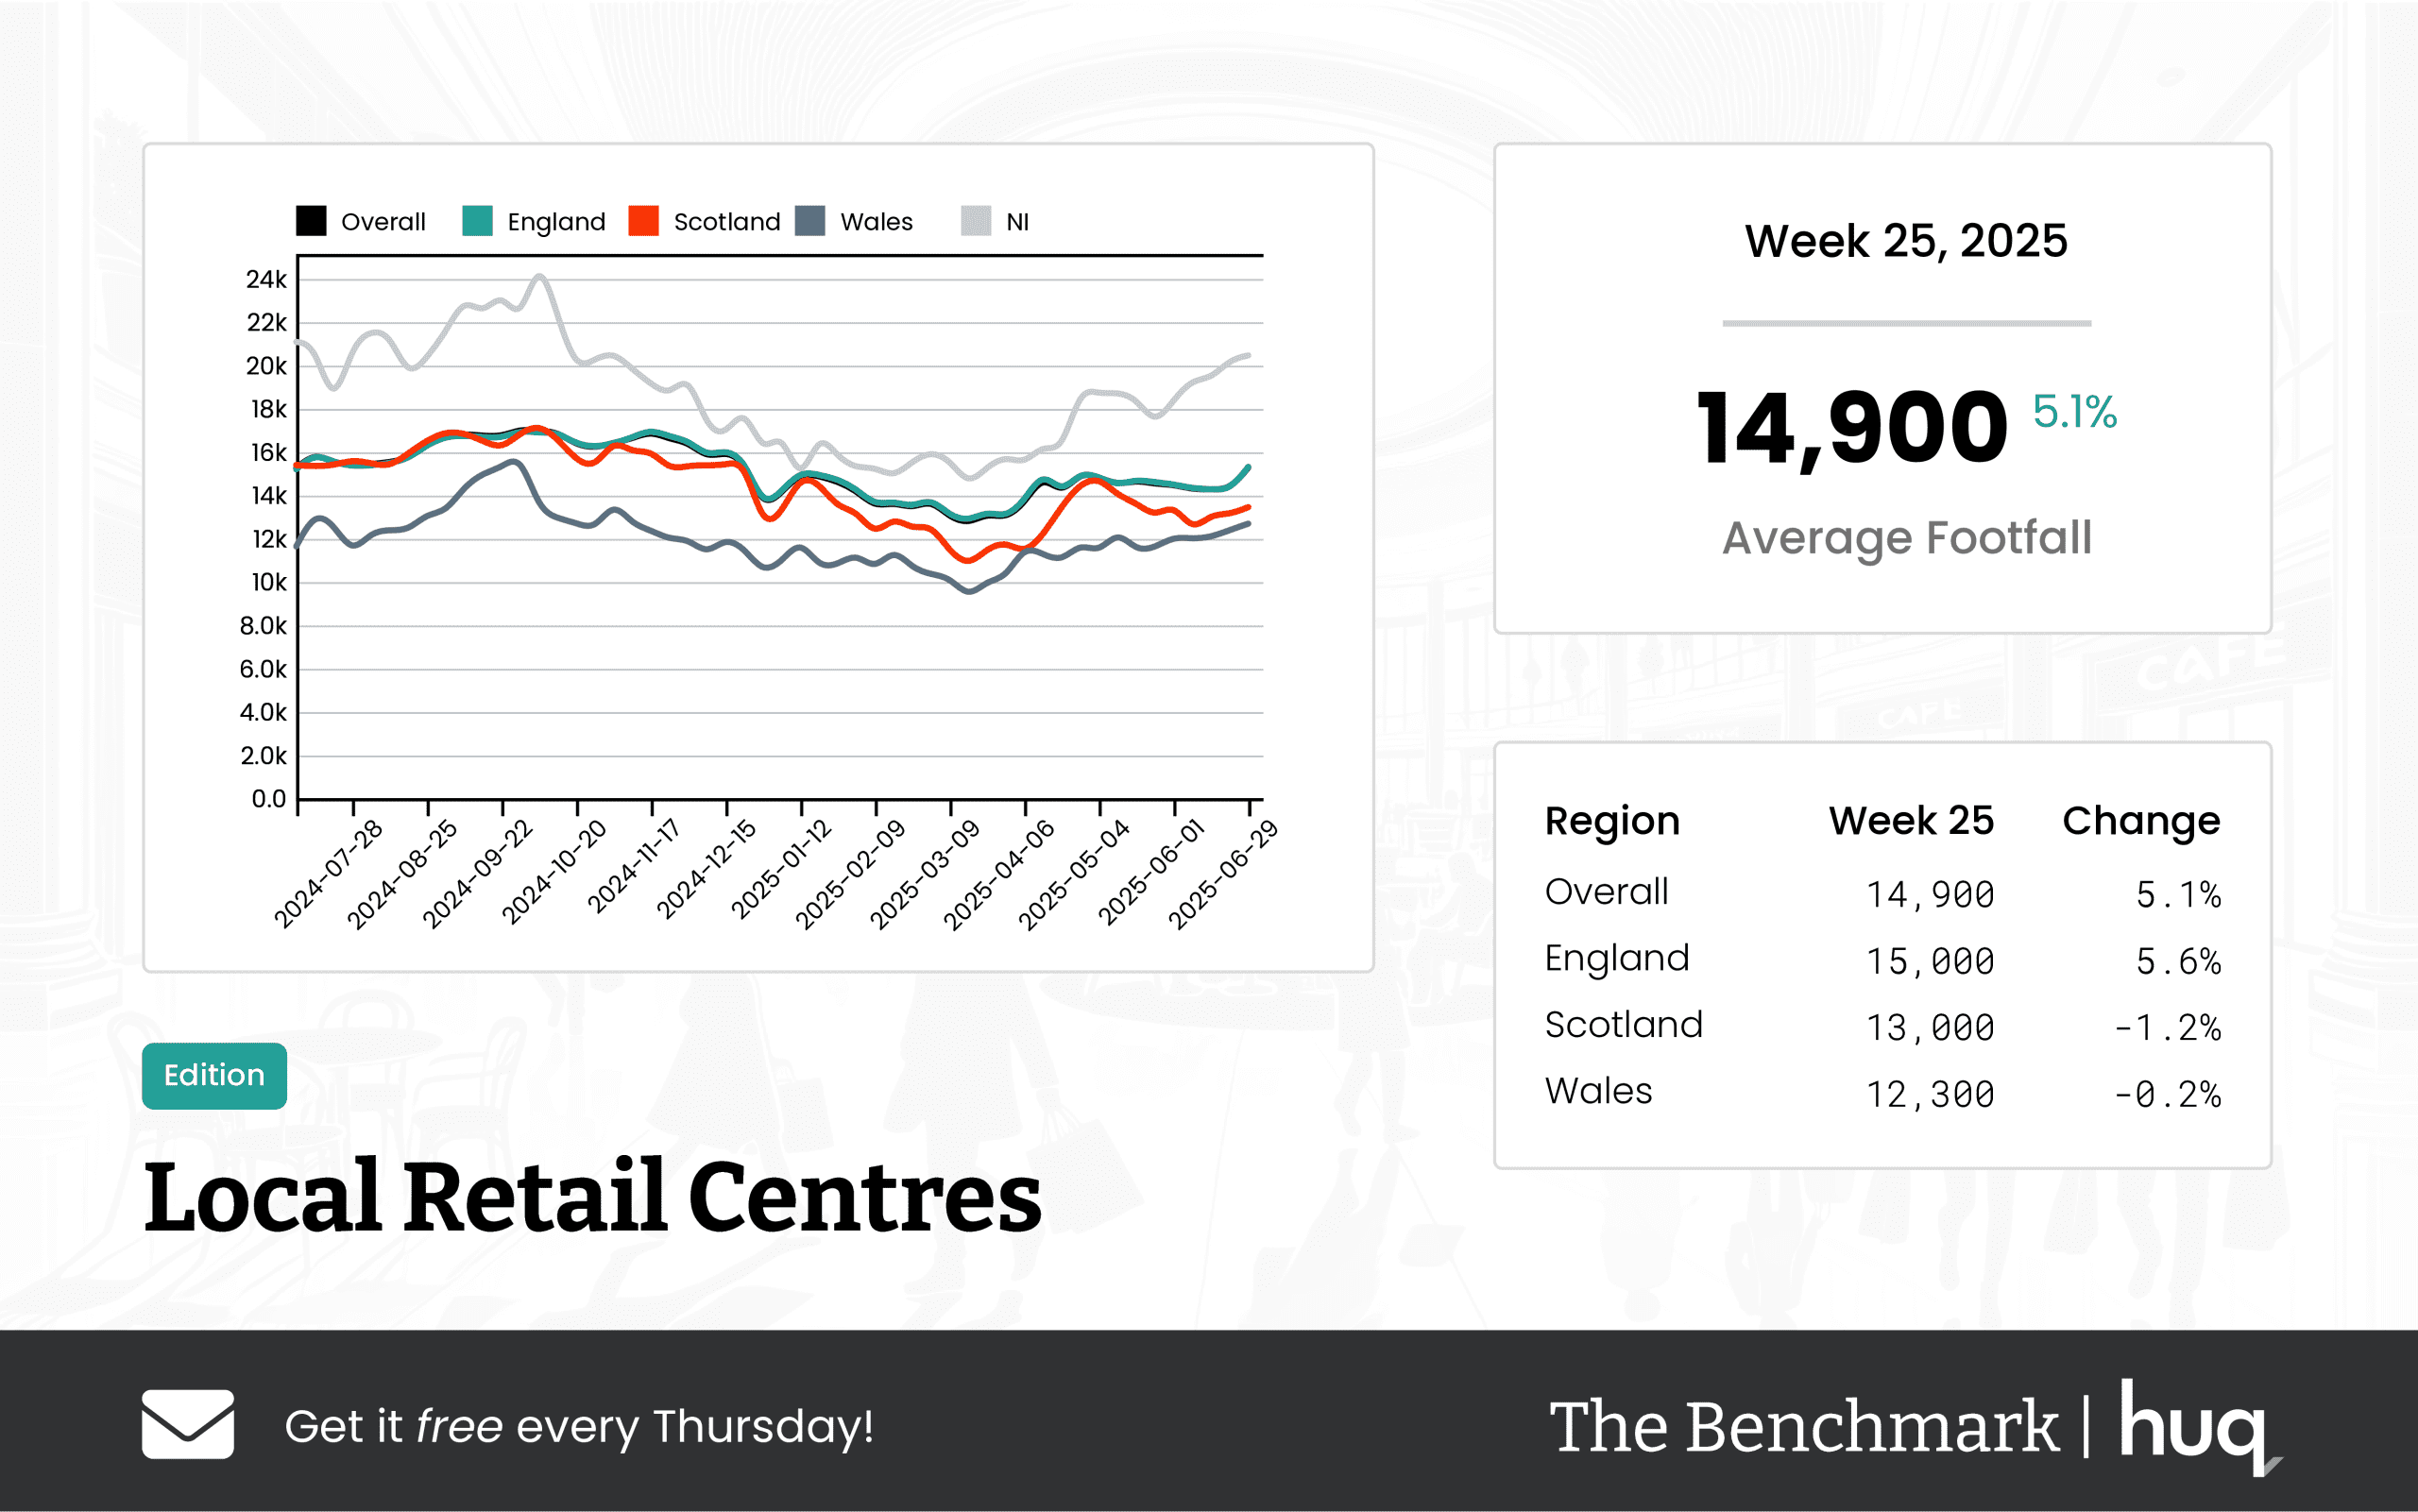
A new analysis using location analytics reveals evolving shopping trends, insightful footfall data, robust retail performance and dynamic consumer behaviour. This additional perspective offers a clear indication of the market recovery and complements the metrics reported in the press release below.
Overview
The Benchmark’s latest update on UK Local Retail Centres for Week 25 has revealed a mixed performance across the nation. Overall, the centres recorded an average daily footfall of 14,900, marking a moderate week-on-week increase of 5.1% while showing a slight annual decline of 3.4%. These figures indicate a recent recovery over the past week, despite a softer performance compared to the same period last year.
Regional Performance
In England, the average daily footfall reached 15,000 with a pleasing week-on-week increase of 5.6%, complemented by a minor year-on-year decline of 3.0%. This trend suggests that many English local centres are beginning to rebound, likely due to good weather conditions.
In contrast, Scottish centres have reported a daily average of 13,000 visitors, with a modest week-on-week decrease of 1.2% and a notable year-on-year decline of 15.2%. Meanwhile, retail locations in Wales achieved a daily peak of 12,300 visitors; although there was a marginal week-on-week dip of 0.2%, the annual data shows a slight improvement, with an increase of 0.8%.
Dwell Time Trends
Visitor engagement, as measured by dwell time, also provided a deeper insight into consumer behaviour. Overall, the average time spent per visit was 97 minutes.
Specifically, English centres maintained an average dwell time of 97 minutes, reflecting stability, while visitors in Wales spent a longer duration of 104 minutes per visit. Scottish centres led in engagement with an average dwell time of 108 minutes, a figure that was supported by a week-on-week increase of 11.3%, suggesting that shoppers in Scotland are engaging more thoroughly during their visits.
Joe Capocci, spokesperson for Huq Industries, stated: "We have observed a sharp rebound in weekly footfall in certain regions which is well aligned with the recent warm weather."
Media: For all media and press enquiries, please contact media@huq.io
About Huq Industries
Huq Industries is the leading provider of location intelligence across the UK, Europe, and the Middle East, specialising in delivering high-quality data insights on footfall, consumer behaviour, and retail performance. By leveraging advanced analytics, Huq Industries enables retailers and analysts to understand and respond to market trends effectively, ensuring they are well-equipped to navigate the changing landscape of high street and town centre commerce.
Get the latest intelligence Benchmark update each Thursday!
Frequently Asked Questions
Clear answers to the most common questions about movement intelligence, retail expansion, and location analytics.
Related Blogs and Insights



.svg)
Empowering strategic teams with the world's most accurate and accessible location intelligence.
Contact

.svg)