.svg)
Week 15, 2025 Major Retail Centres Performance Update: Location Analytics Insights
UK Major Retail Centres show overall trends with a 6.9% weekly decline and a 3.9% year on year increase in footfall. The latest report highlights promising retail performance and footfall trends, supporting robust location analytics.

April 24, 2025
2 min read
Table of contents
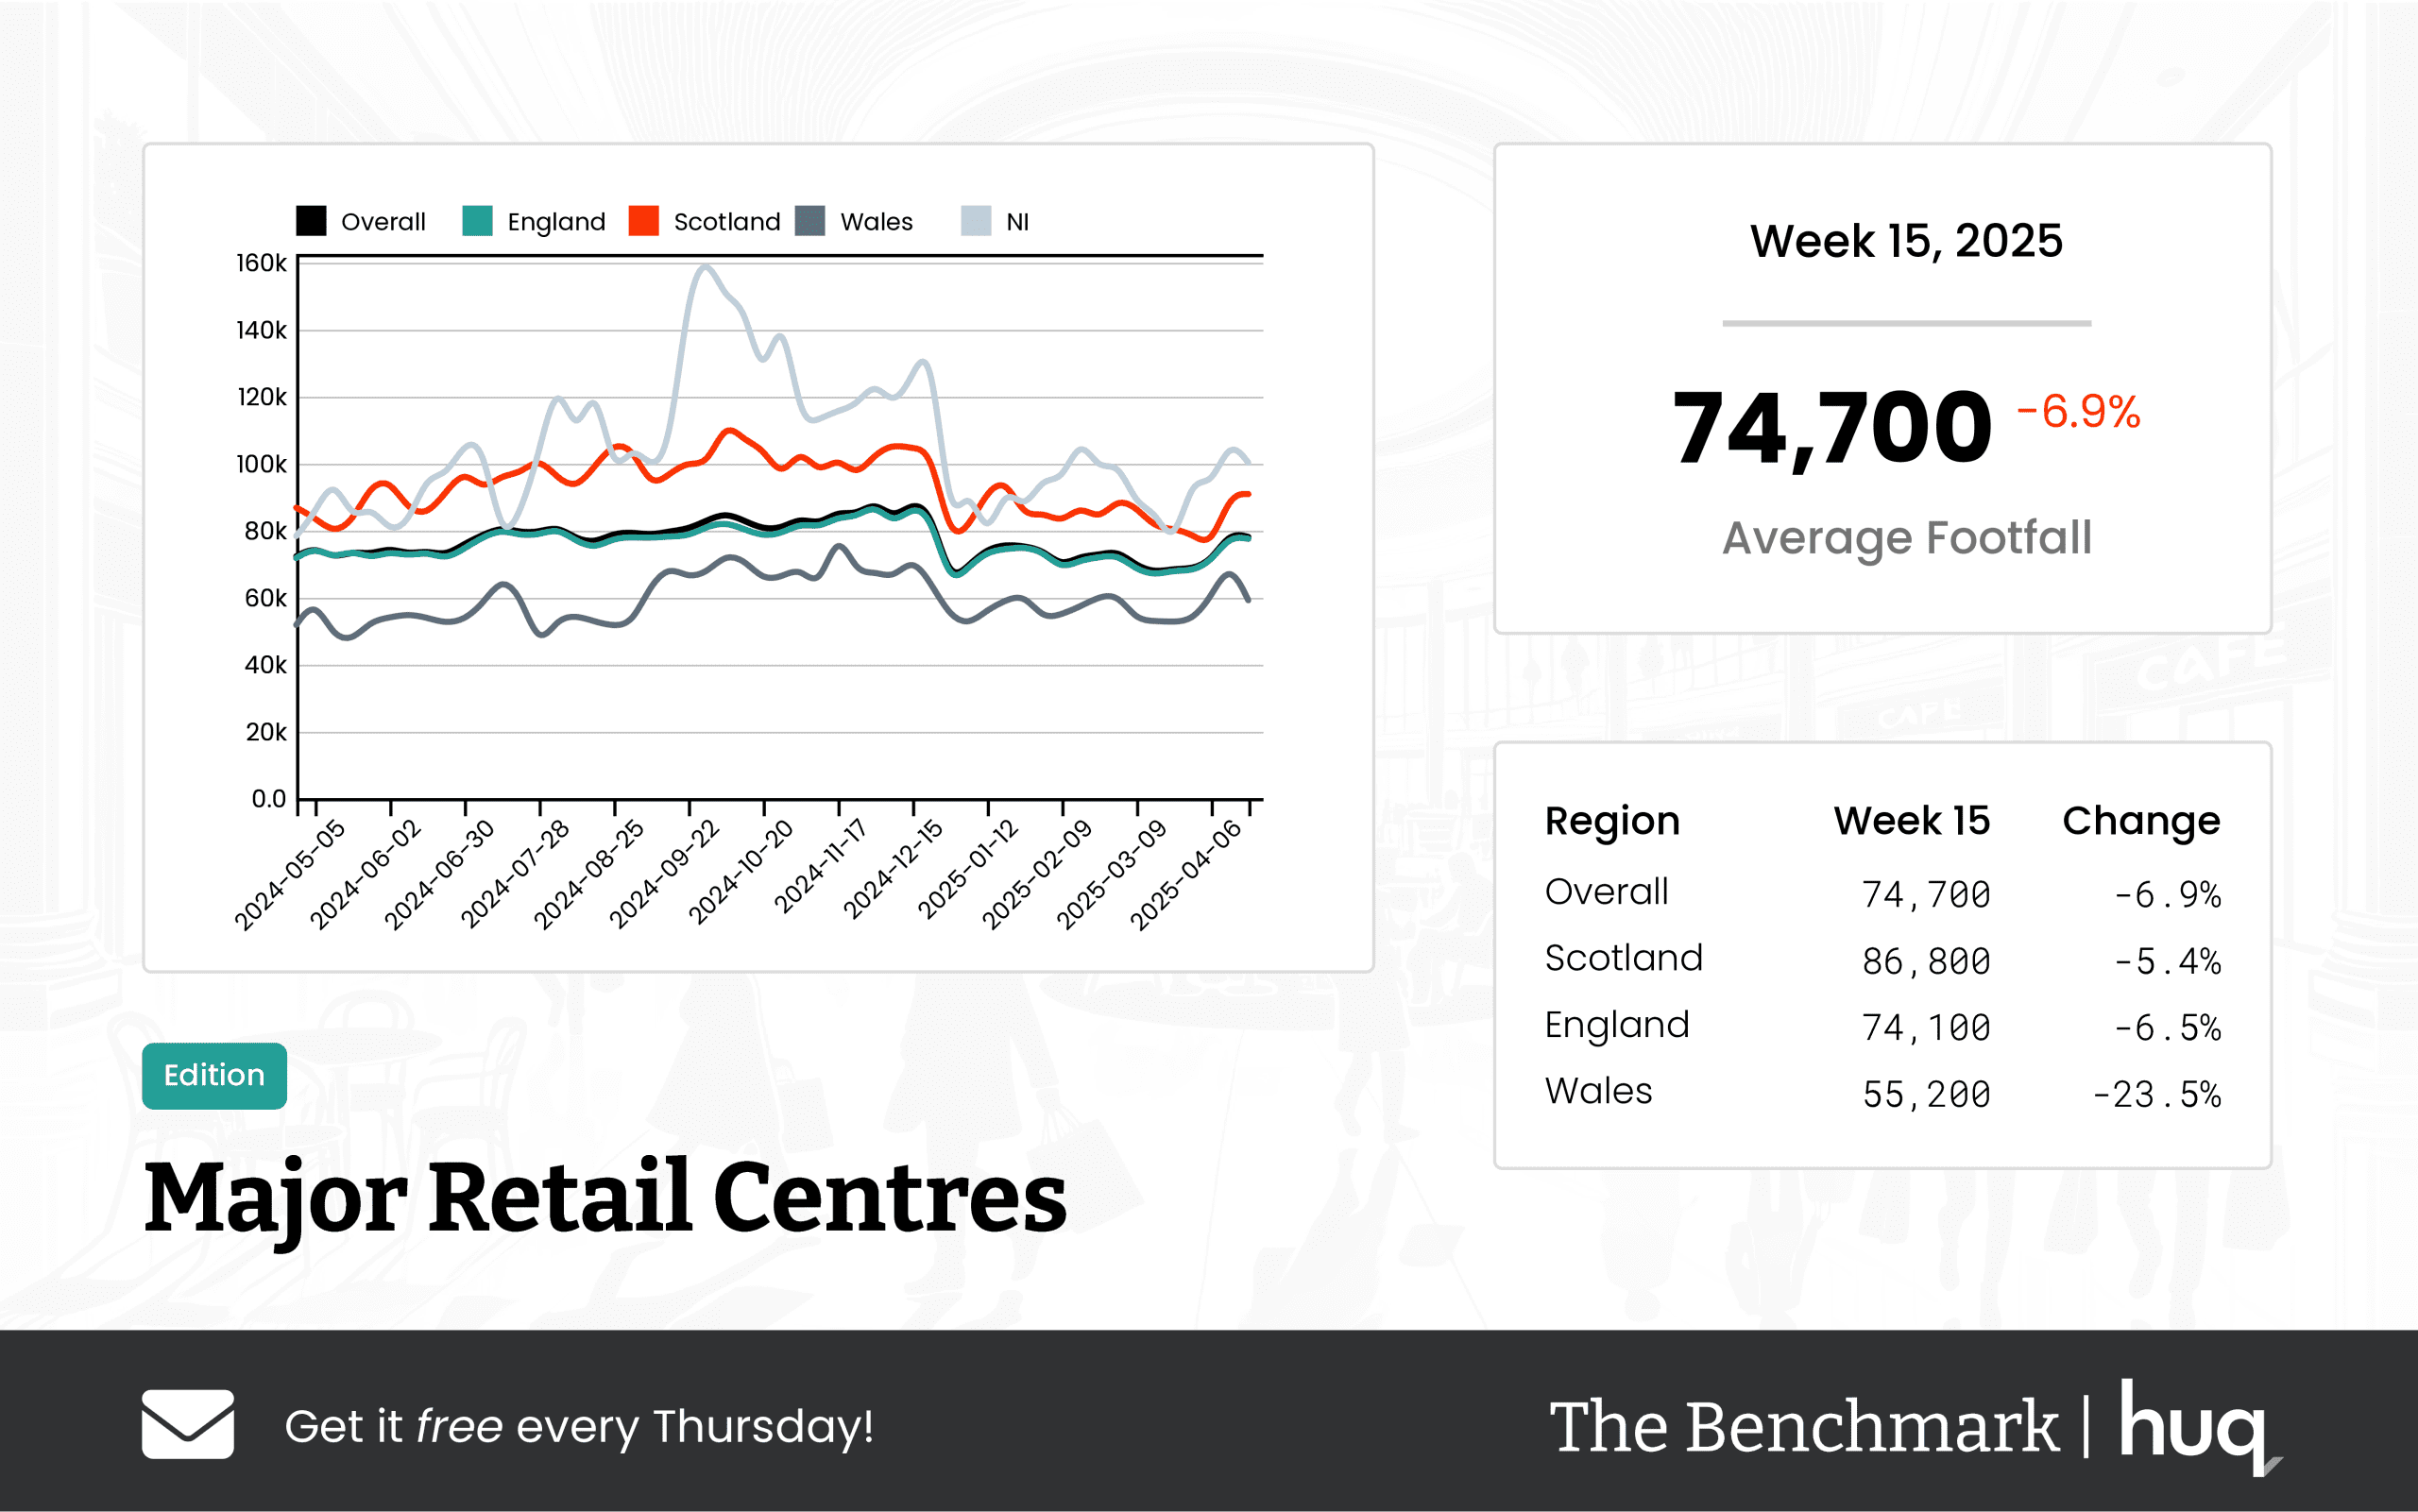
The latest update from The Benchmark offers an in-depth insight into the current performance of the UK's major retail centres. Focusing on detailed location analytics, the report reveals an average daily footfall of 74,700 for the week ending 20 April 2025, marking a 6.9% week-on-week decline. However, a more encouraging long-term picture emerges with a 3.9% increase year on year, demonstrating the resilience of the retail landscape amidst evolving consumer patterns.
A breakdown of the data by region uncovers important performance nuances. Scotland tops the metrics with an average daily footfall of 86,800, showing a smaller week-on-week decline of 5.4% alongside a modest yearly rise of 3.2%. In contrast, retail centres in England recorded an average of 74,100 visitors daily, with a 6.5% week-on-week dip and a year-on-year improvement of 3.5%. Wales, however, trails with the lowest average daily footfall at 55,200, experiencing a significant week-on-week drop even as annual trends hold relatively steady.
Visitor dwell time further enriches this data narrative. Across all centres, the average visitor spent 112 minutes per visit, reflecting a 5.9% week-on-week decrease, although the year on year change was a modest 0.9% increase. Scotland again distinguishes itself with an average visit lasting 115 minutes—a period boosted by a substantial 13.9% week-on-week increase and an 8.5% annual uplift. Meanwhile, centres in England averaged 113 minutes, with a 7.4% decline over the week but a slight year-on-year gain of 2.7%. Wales, with an average dwell time of 94 minutes, recorded a more notable annual decline in visitor engagement.
Joe Capocci, spokesperson for Huq Industries, commented on these trends, saying, "The most striking change in footfall was seen in Wales with a notable decline, which is supported by the latest Retail Industry News." This insight underscores the shifting dynamics in retail performance across the UK, prompting further exploration of the factors driving these trends.
Overall, while weekly fluctuations depict some challenges, the year-on-year growth trend and rising dwell times in key regions highlight a cautiously optimistic outlook for the UK retail sector as it navigates a period of transformation and digitalization.
Media: For all media and press enquiries, please contact media@huq.io
About Huq Industries
Huq Industries is the leading provider of location intelligence across the UK, Europe, and the Middle East, specialising in delivering high-quality data insights on footfall, consumer behaviour, and retail performance. By leveraging advanced analytics, Huq Industries enables retailers and analysts to understand and respond to market trends effectively, ensuring they are well-equipped to navigate the changing landscape of high street and town centre commerce.
Get the latest intelligence Benchmark update each Thursday!
Sign Up NowFrequently Asked Questions
Clear answers to the most common questions about movement intelligence, retail expansion, and location analytics.
Related Blogs and Insights



.svg)
Empowering strategic teams with the world's most accurate and accessible location intelligence.
Contact

.svg)