.svg)
UK Shopping Centres – Week 34, 2025 Performance Update with Location Analytics
UK shopping centres displayed robust footfall trends in week 34, 2025. Location analytics reveals a 12% rise and demonstrates improved retail industry engagement.

September 4, 2025
1 min read
Table of contents
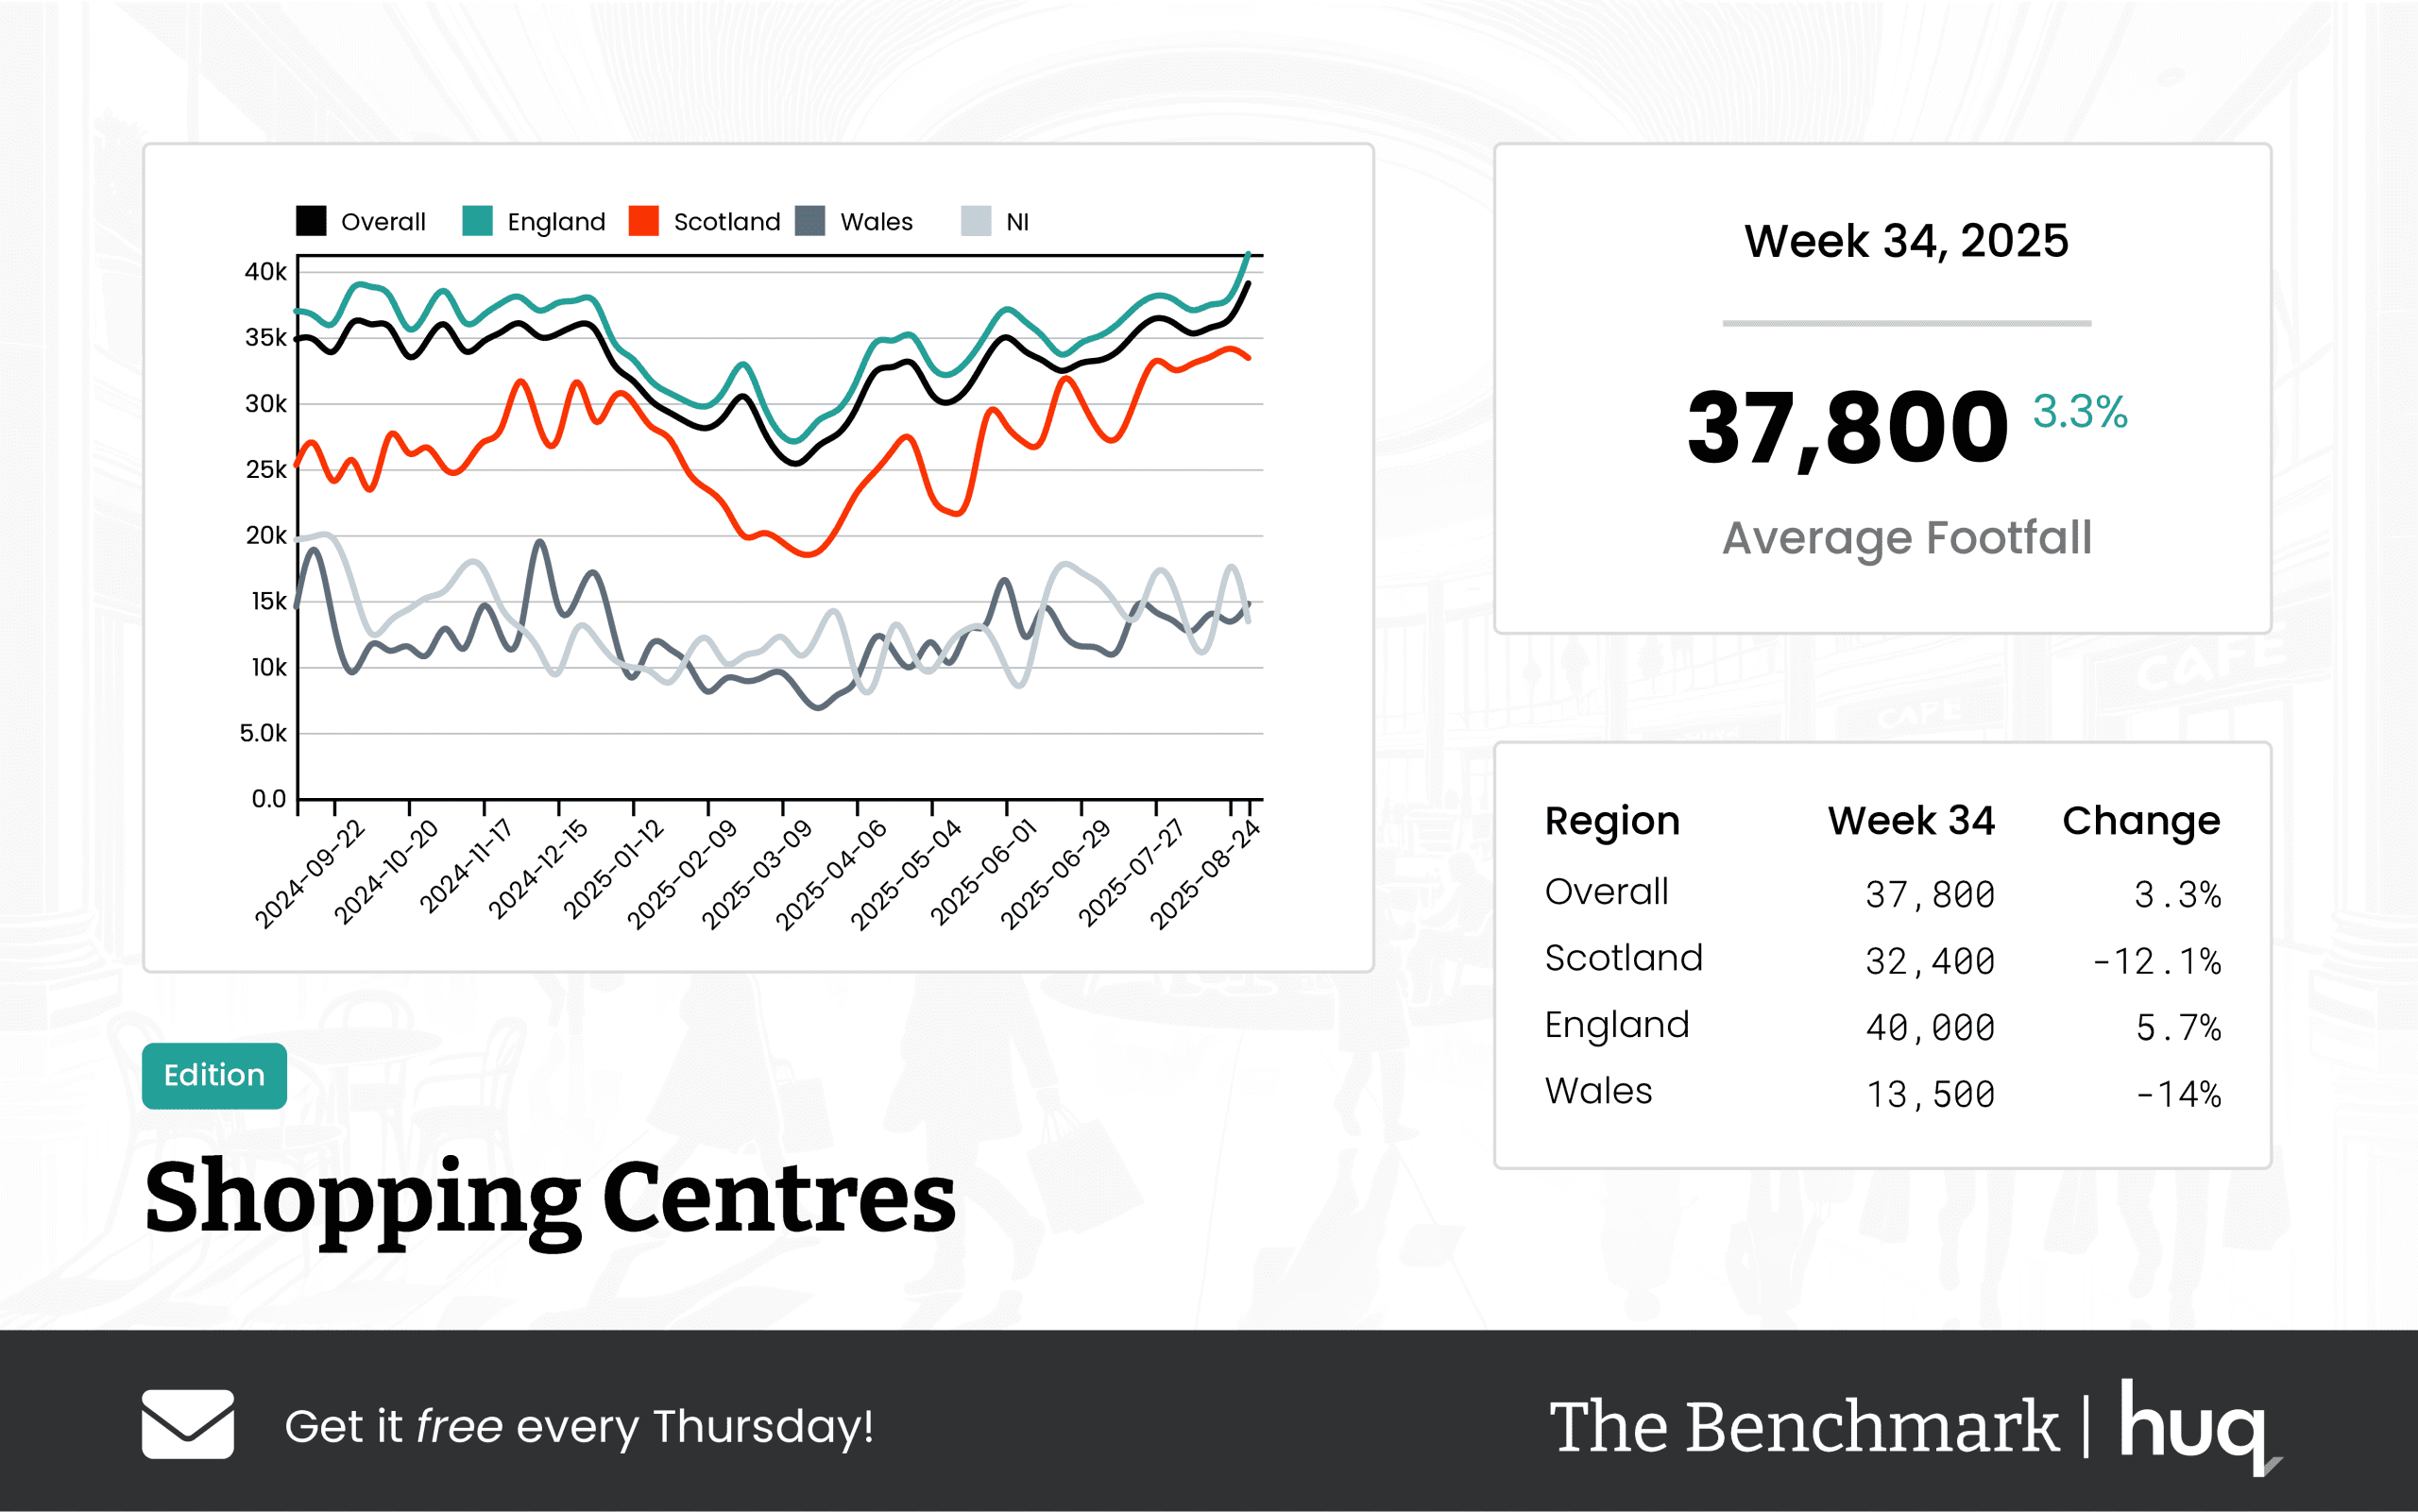
For the week ending 2025-08-31, Huq Industries' Benchmark report, based on comprehensive location analytics, indicates that UK shopping centres recorded an average of 37,800 daily visits. This not only marks a modest increase from the previous week but also shows a significant improvement over the same period last year. The data highlights that along with increasing visitation, the average visit duration has extended to 105 minutes, suggesting that consumers are spending more time within the retail spaces, engaging more deeply, and reflecting evolving consumer behavior across the retail landscape.
Examining the regional performance reveals varied trends across the UK. In England, shopping centres have recorded a robust average of 40,000 daily visits paired with increased dwell time, signifying strong visitor sentiment and effective market dynamics. Conversely, centres in Scotland, despite a strong year-on-year increase in footfall, showed a decline in the current week's figures and a slight reduction in visit duration compared to the previous week. Wales, on the other hand, lagged behind with centres averaging just 13,500 daily visits and visitors spending only 52 minutes on average.
Media: For all media and press enquiries, please contact media@huq.io
Frequently Asked Questions
Clear answers to the most common questions about movement intelligence, retail expansion, and location analytics.
Related Blogs and Insights



.svg)
Empowering strategic teams with the world's most accurate and accessible location intelligence.
Contact

.svg)