.svg)
UK Retail Parks – Week 37 (2025) Footfall Retail Performance Update
Week 37 retail data shows overall stable footfall with a modest week-on-week increase of 0.1%, despite a small year-on-year decline. Recent footfall analytics reflect consistent visitor patterns in UK retail parks.

September 25, 2025
2 min read
Table of contents
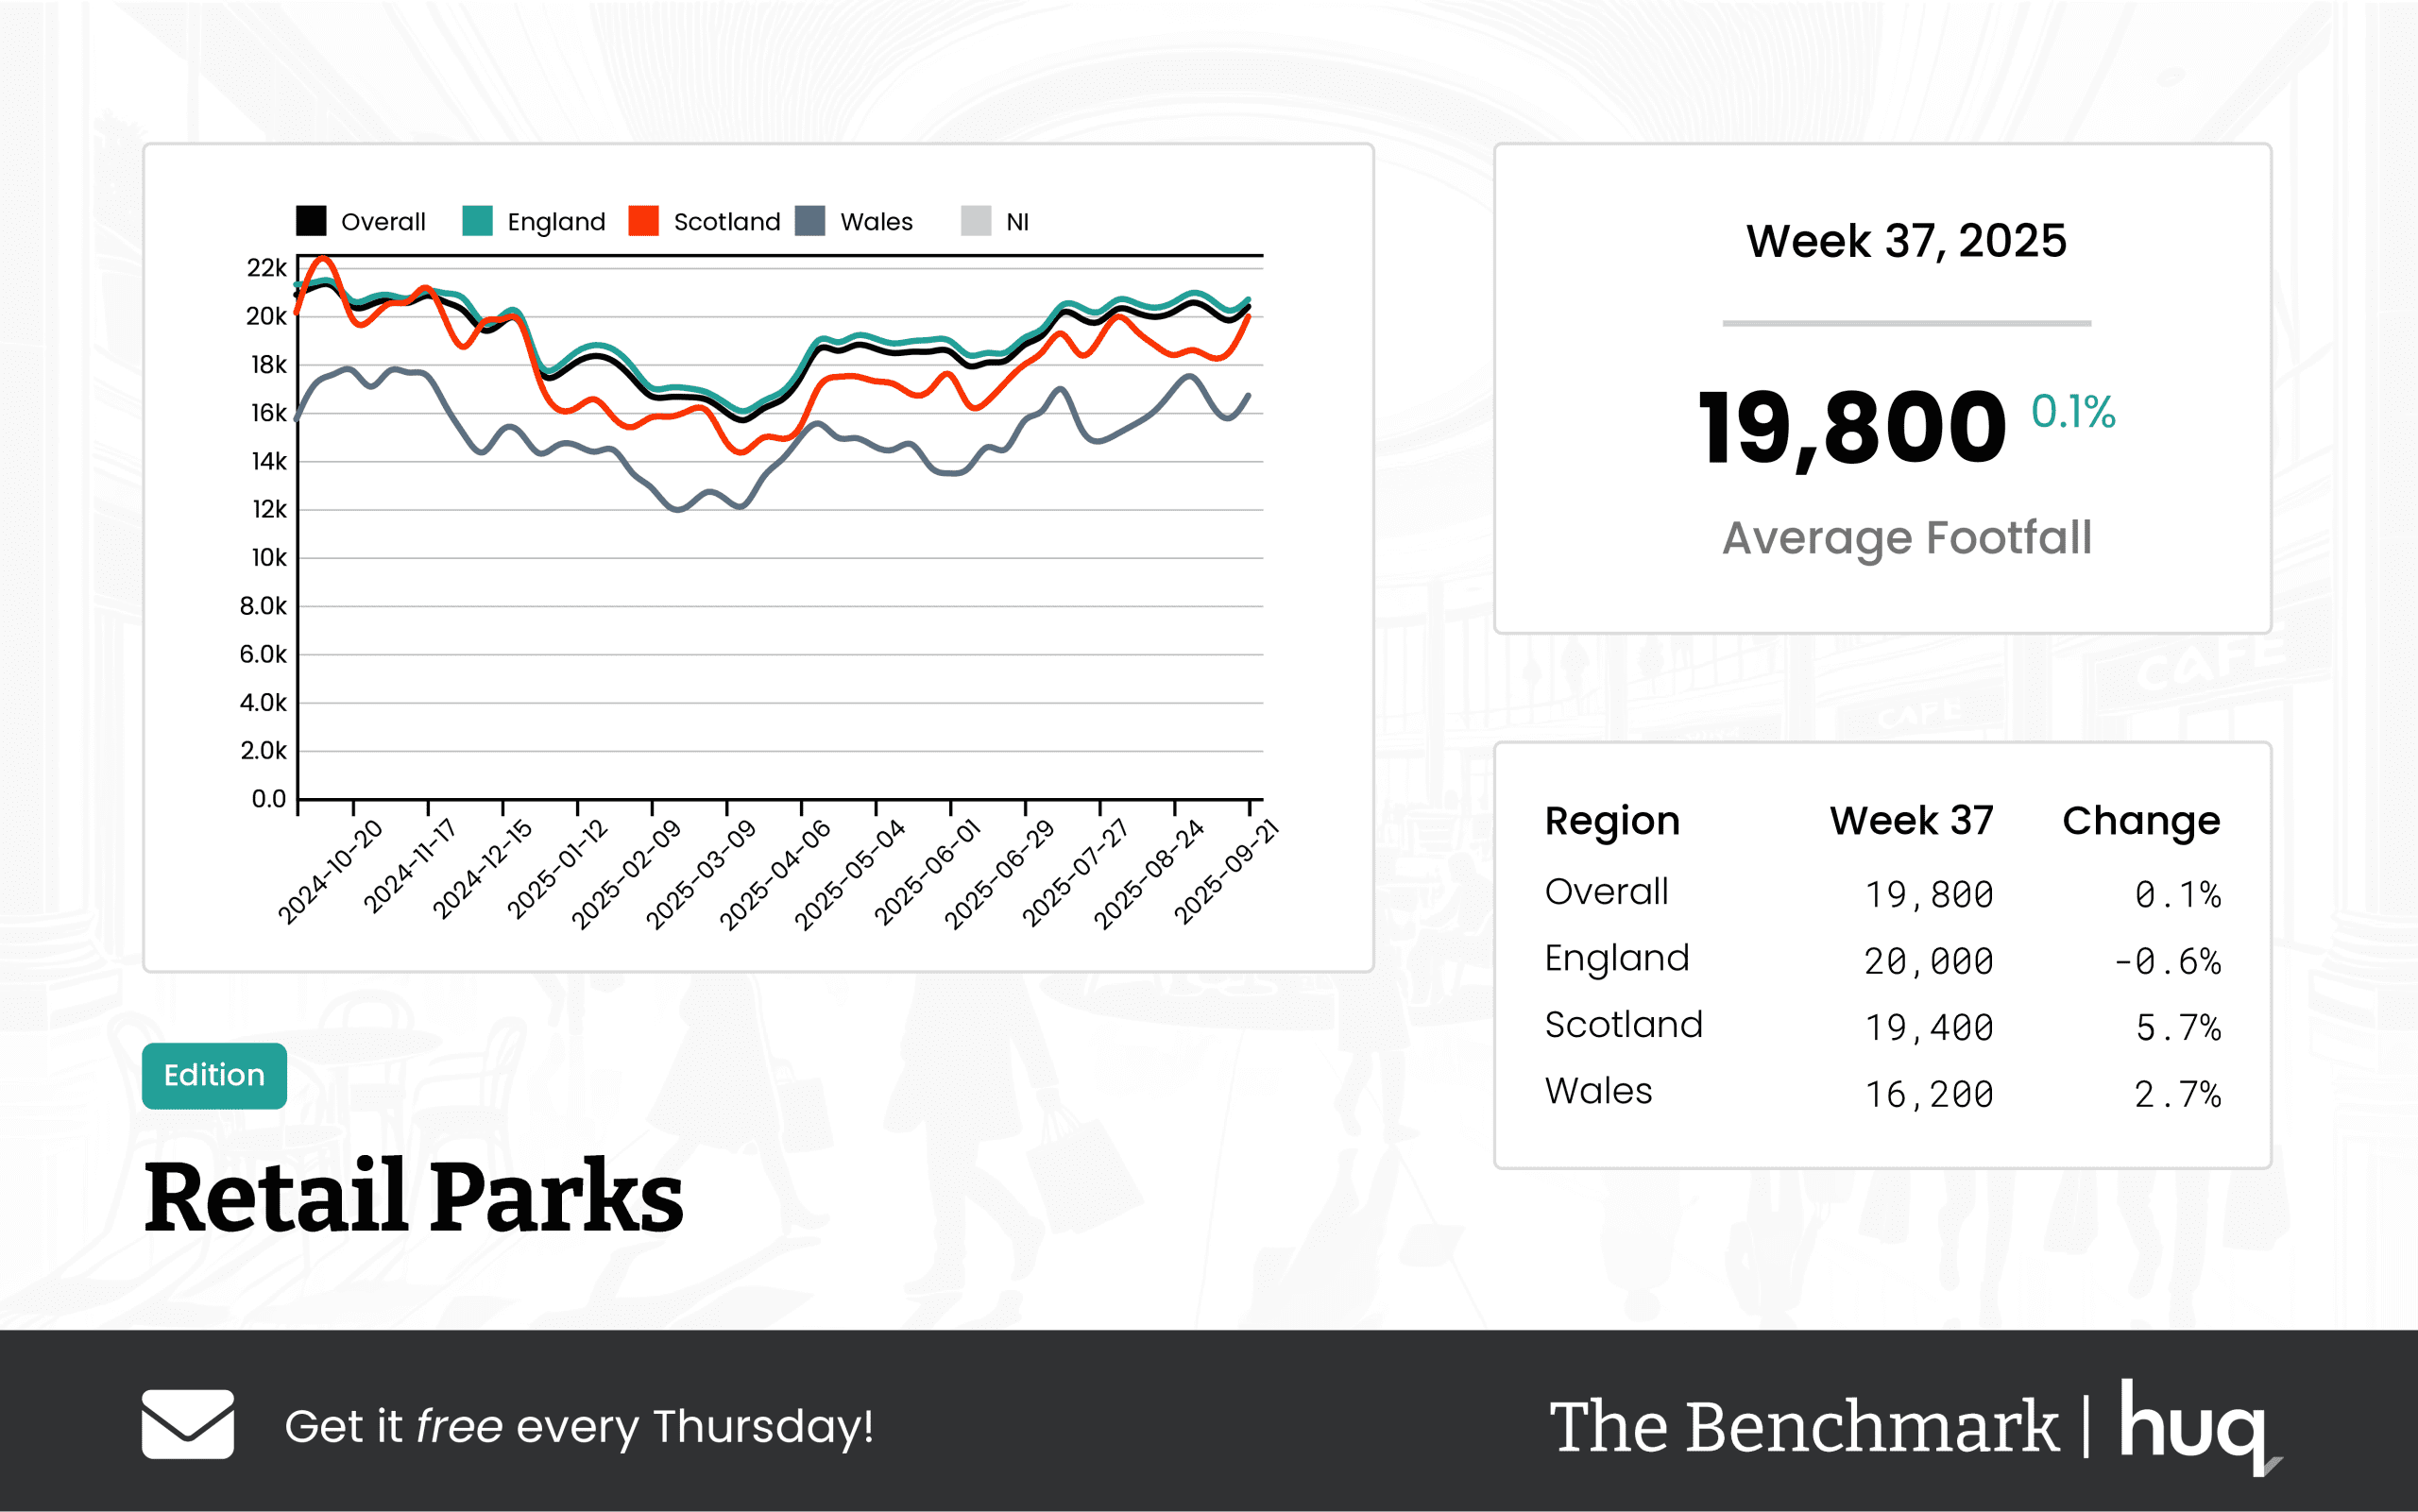
In the latest weekly update, UK retail parks have maintained a broadly stable trend in footfall, with the overall average daily visitation for the week recording 19,800. This comes alongside a modest week-on-week boost of 0.1%, even though comparisons with the same week last year indicate a decline of 5.1%. Such detailed analytics enable retailers to fine-tune operations and marketing strategies to meet evolving visitor patterns.
Breaking the data down regionally reveals nuanced performance trends. England leads the pack with the highest daily footfall at 20,000. However, this region experienced a slight week-on-week decrease of 0.6% and a year-on-year drop of 5.4%. Meanwhile, Scotland’s retail parks have shown promising signals with a robust week-on-week gain of 5.7%. Although Scotland's year-on-year figures have fallen by 3.9%, the recent uptick points to emerging positive trends in the market. Similarly, Wales posted a healthy week-on-week increase of 2.7%, reaching an average daily footfall of 16,200, despite a 2.5% fall over the same period last year.
Dwell time metrics further enrich the insights from this data set. Overall, visitors spent an average of 82 minutes per visit, supported by a significant week-on-week increase of 13.9%. In England, visitor engagement appears slightly higher, with average visit durations clocking in at 84 minutes and an impressive 18.3% bump over the previous week. In contrast, Scotland saw its average duration at 74 minutes, experiencing a minor decline from the week before, while Wales registered 71 minutes with a modest week-on-week gain.
Retail professionals can take a proactive approach by leveraging these detailed footfall analytics alongside improved counting technologies. Insights derived from both overall and regional statistics offer a refined perspective on visitor behavior, helping stakeholders adapt to both short-term fluctuations and long-term trends.
Commenting on the findings, Joe Capocci, spokesperson for Huq Industries, noted, "Scotland’s sharp increase in week-on-week footfall, alongside retail industry developments such as The Range creating jobs ahead of the Enniskillen store opening, highlights significant emerging trends that could shape future strategies." This optimistic outlook is driving further investments and operational adjustments across the UK retail landscape.
As retail parks continue to evolve in response to dynamic consumer behaviors, industry insiders will be closely monitoring these trends to optimize performance and better cater to the needs of modern shoppers.
Media: For all media and press enquiries, please contact media@huq.io
About Huq Industries
Huq Industries is the leading provider of location intelligence across the UK, Europe, and the Middle East, specialising in delivering high-quality data insights on footfall, consumer behaviour, and retail performance. By leveraging advanced analytics, Huq Industries enables retailers and analysts to understand and respond to market trends effectively, ensuring they are well-equipped to navigate the changing landscape of high street and town centre commerce.
Get the latest intelligence Benchmark update each Thursday!
Frequently Asked Questions
Clear answers to the most common questions about movement intelligence, retail expansion, and location analytics.
Related Blogs and Insights



.svg)
Empowering strategic teams with the world's most accurate and accessible location intelligence.
Contact

.svg)