.svg)
UK Retail Parks – Week 31, 2025 Performance Update: Insights from Location Analytics
UK Retail Parks Week 31, 2025 shows a 0.4% drop in footfall and a 2.8% rise in visit duration, signalling a shift in visitor engagement. Highlights reveal robust location analytics and evolving consumer trends in retail park dynamics.

August 14, 2025
2 min read
Table of contents
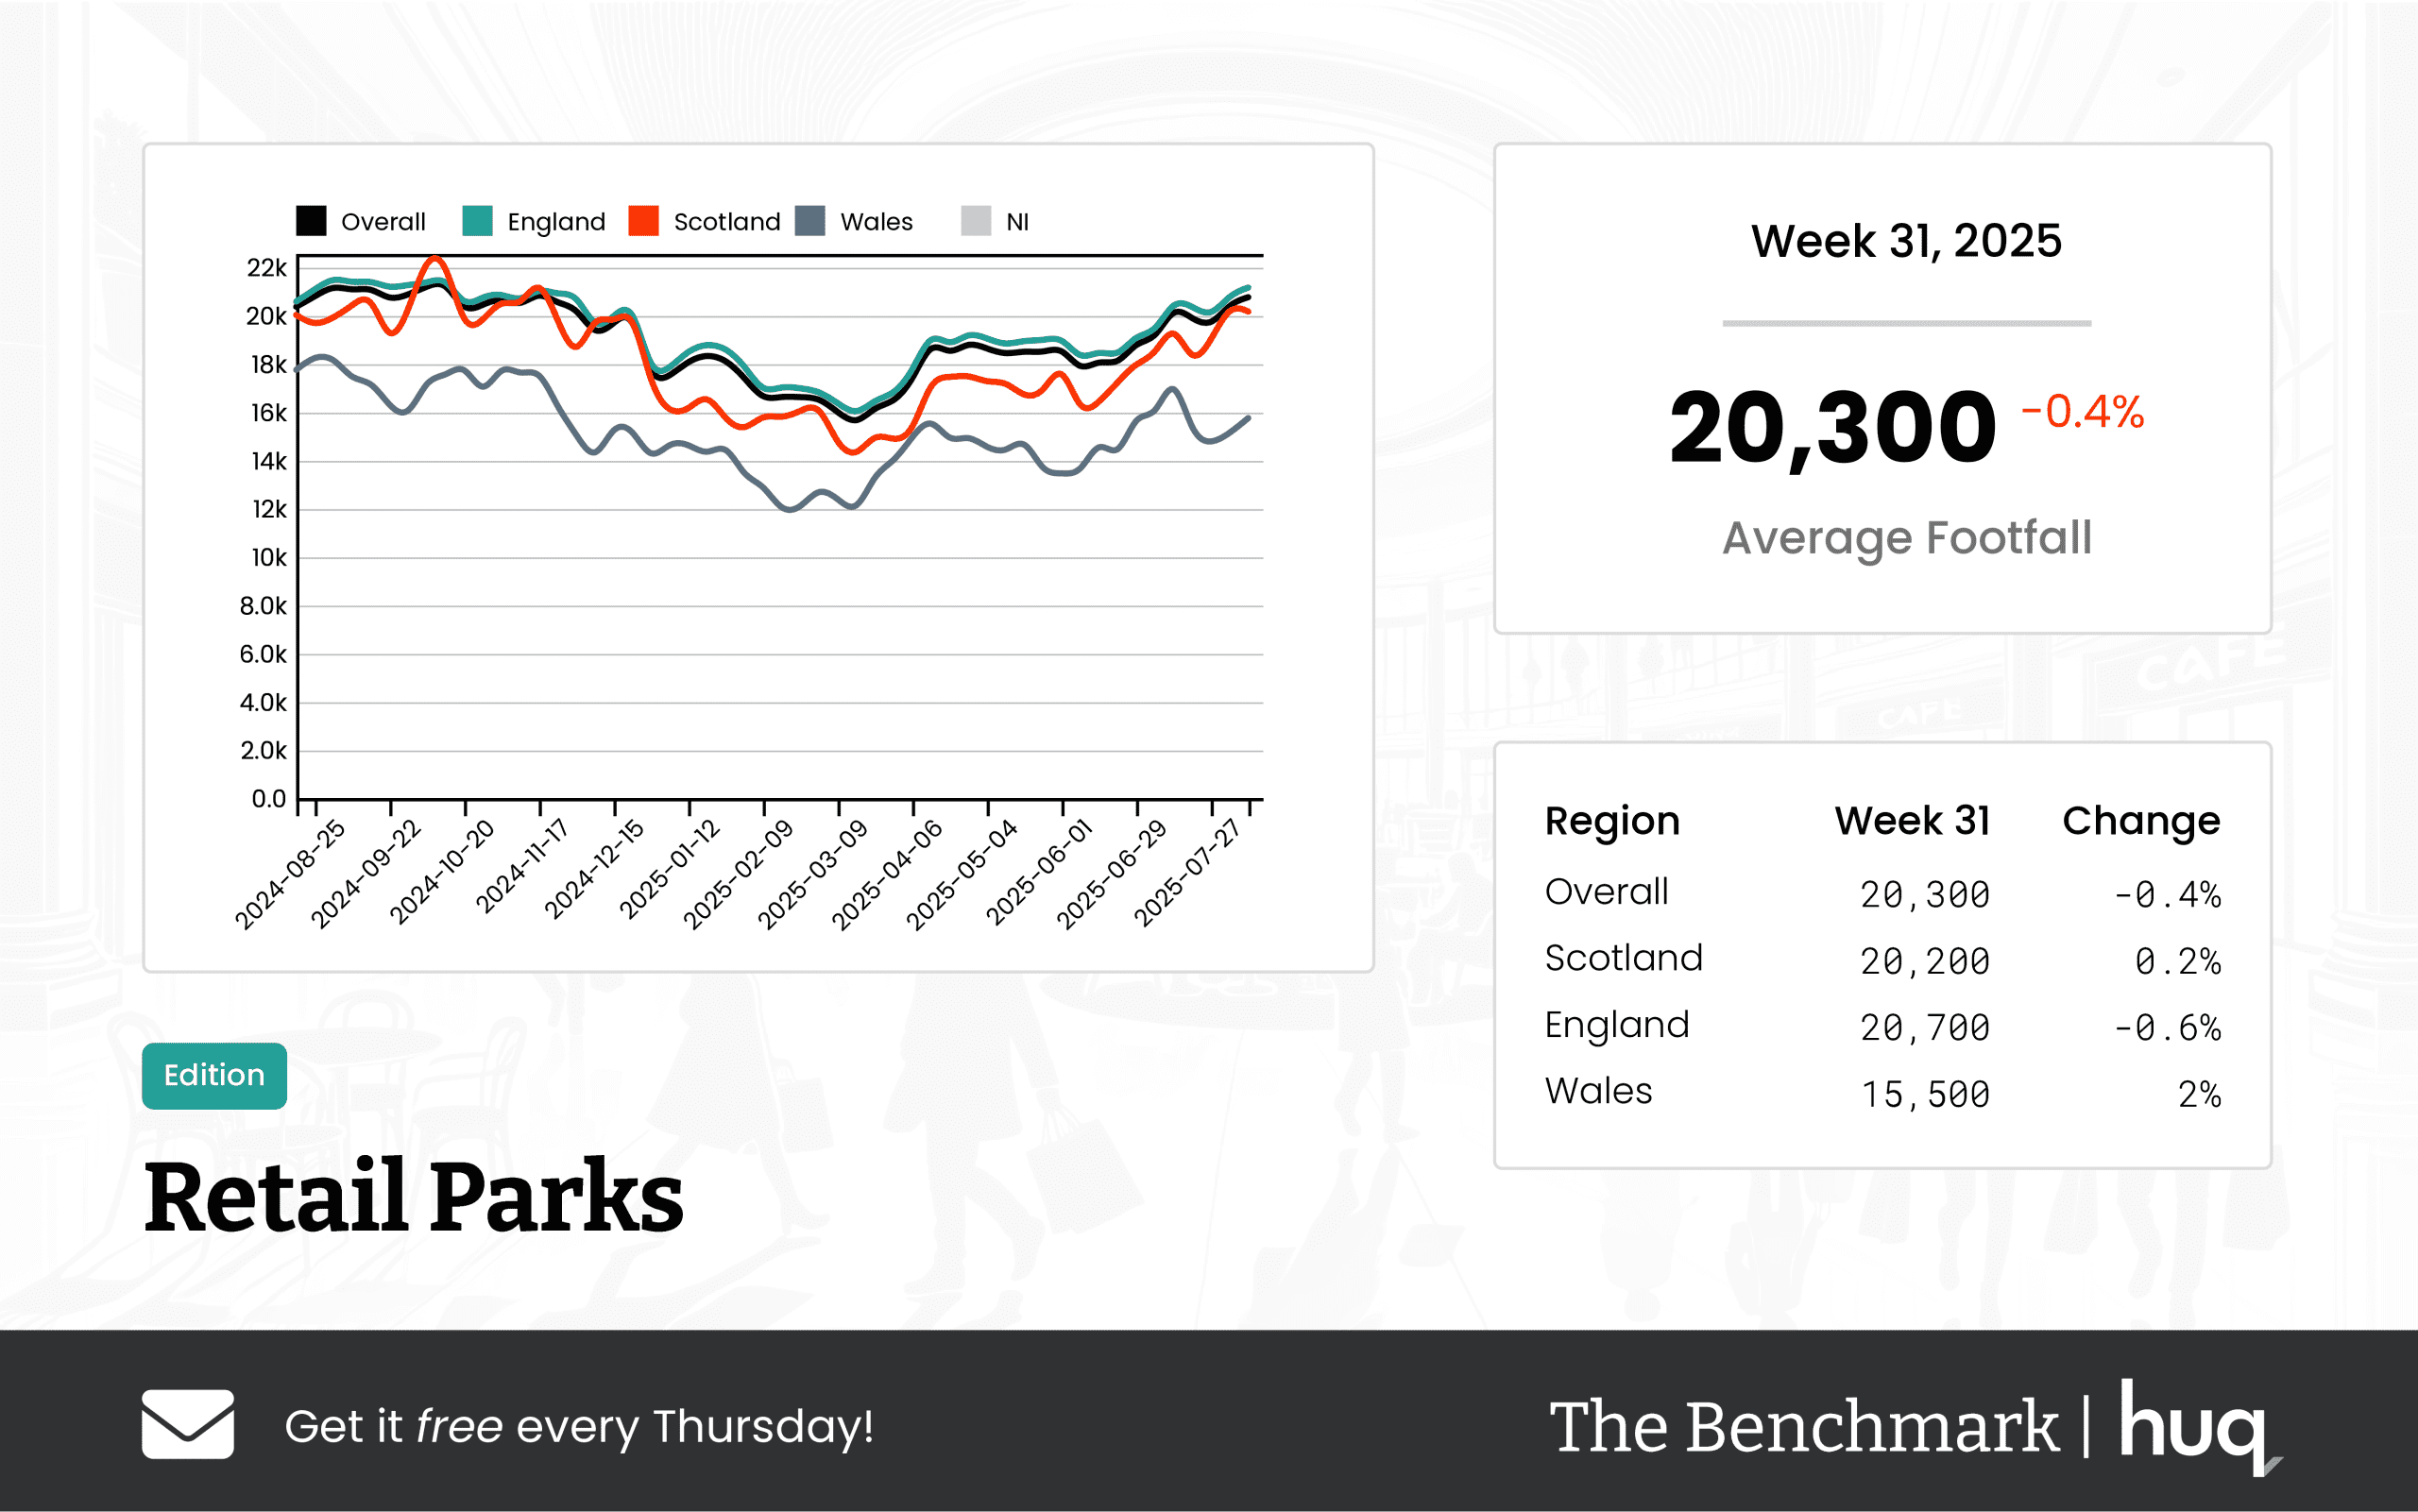
The recent performance update for UK retail parks in Week 31, 2025 reveals a mixed bag in visitor numbers and engagement metrics based on comprehensive location analytics. The benchmark data indicates that while the average daily footfall across these retail parks slightly decreased by 0.4% to 20,300, there was a notable increase in average visit duration, which climbed by 2.8% weekly to 73 minutes – up by a substantial 10.6% on an annual basis.
A closer look at regional performance uncovers several fascinating trends:
- In Scotland, retail parks averaged 20,200 daily visitors. Although modest, there was a 0.2% weekly increase, which coupled with a 1.3% annual rise, reflects steady local engagement.
- England, on the other hand, experienced a higher daily count of 20,700 visitors. However, it registered a 0.6% decline week-on-week and a 3.8% fall compared to the previous year. Despite this dip in footfall, England boasted the highest average dwell time at 75 minutes, showing a strong weekly increase of 4.2% and a 15.4% annual gain, suggesting enhanced consumer interaction.
- Wales showed a contrasting trend with a lower average of 15,500 daily visitors. Despite this, there was a healthy weekly increase of 2% in footfall; however, the region saw a significant 15.6% decline when compared to the previous year, and it recorded the shortest average visit duration at 58 minutes.
Visitor engagement metrics, as indicated by dwell time, further accentuate the disparity in regional performance and underline the importance of tailored marketing and operational strategies. The UK market continues to grapple with various challenges, yet the increasing dwell time suggests that when visitors do come, they are spending more time exploring and engaging with the retail environment.
Industry expert Joe Capocci of Huq Industries noted, "The most striking change in footfall was observed in Wales with a notable annual decline, which is underscored by recent retail industry news on new park developments, and this indicates a shift in consumer engagement patterns."
As the landscape of retail parks evolves, these insights emphasize the need for stakeholders to continue leveraging robust location analytics to adapt and innovate in response to changing consumer behaviors.
Media: For all media and press enquiries, please contact media@huq.io
About Huq Industries
Huq Industries is the leading provider of location intelligence across the UK, Europe, and the Middle East, specialising in delivering high-quality data insights on footfall, consumer behaviour, and retail performance. By leveraging advanced analytics, Huq Industries enables retailers and analysts to understand and respond to market trends effectively, ensuring they are well-equipped to navigate the changing landscape of high street and town centre commerce.
Get the latest intelligence Benchmark update each Thursday!
Sign Up NowFrequently Asked Questions
Clear answers to the most common questions about movement intelligence, retail expansion, and location analytics.
Related Blogs and Insights



.svg)
Empowering strategic teams with the world's most accurate and accessible location intelligence.
Contact

.svg)