.svg)
UK Retail Parks – Week 22 Performance Update 2025: location analytics Insights
UK retail parks experienced a 6.6% footfall decline overall, while improved engagement was noted through location analytics and retail park trends.

June 12, 2025
2 min read
Table of contents
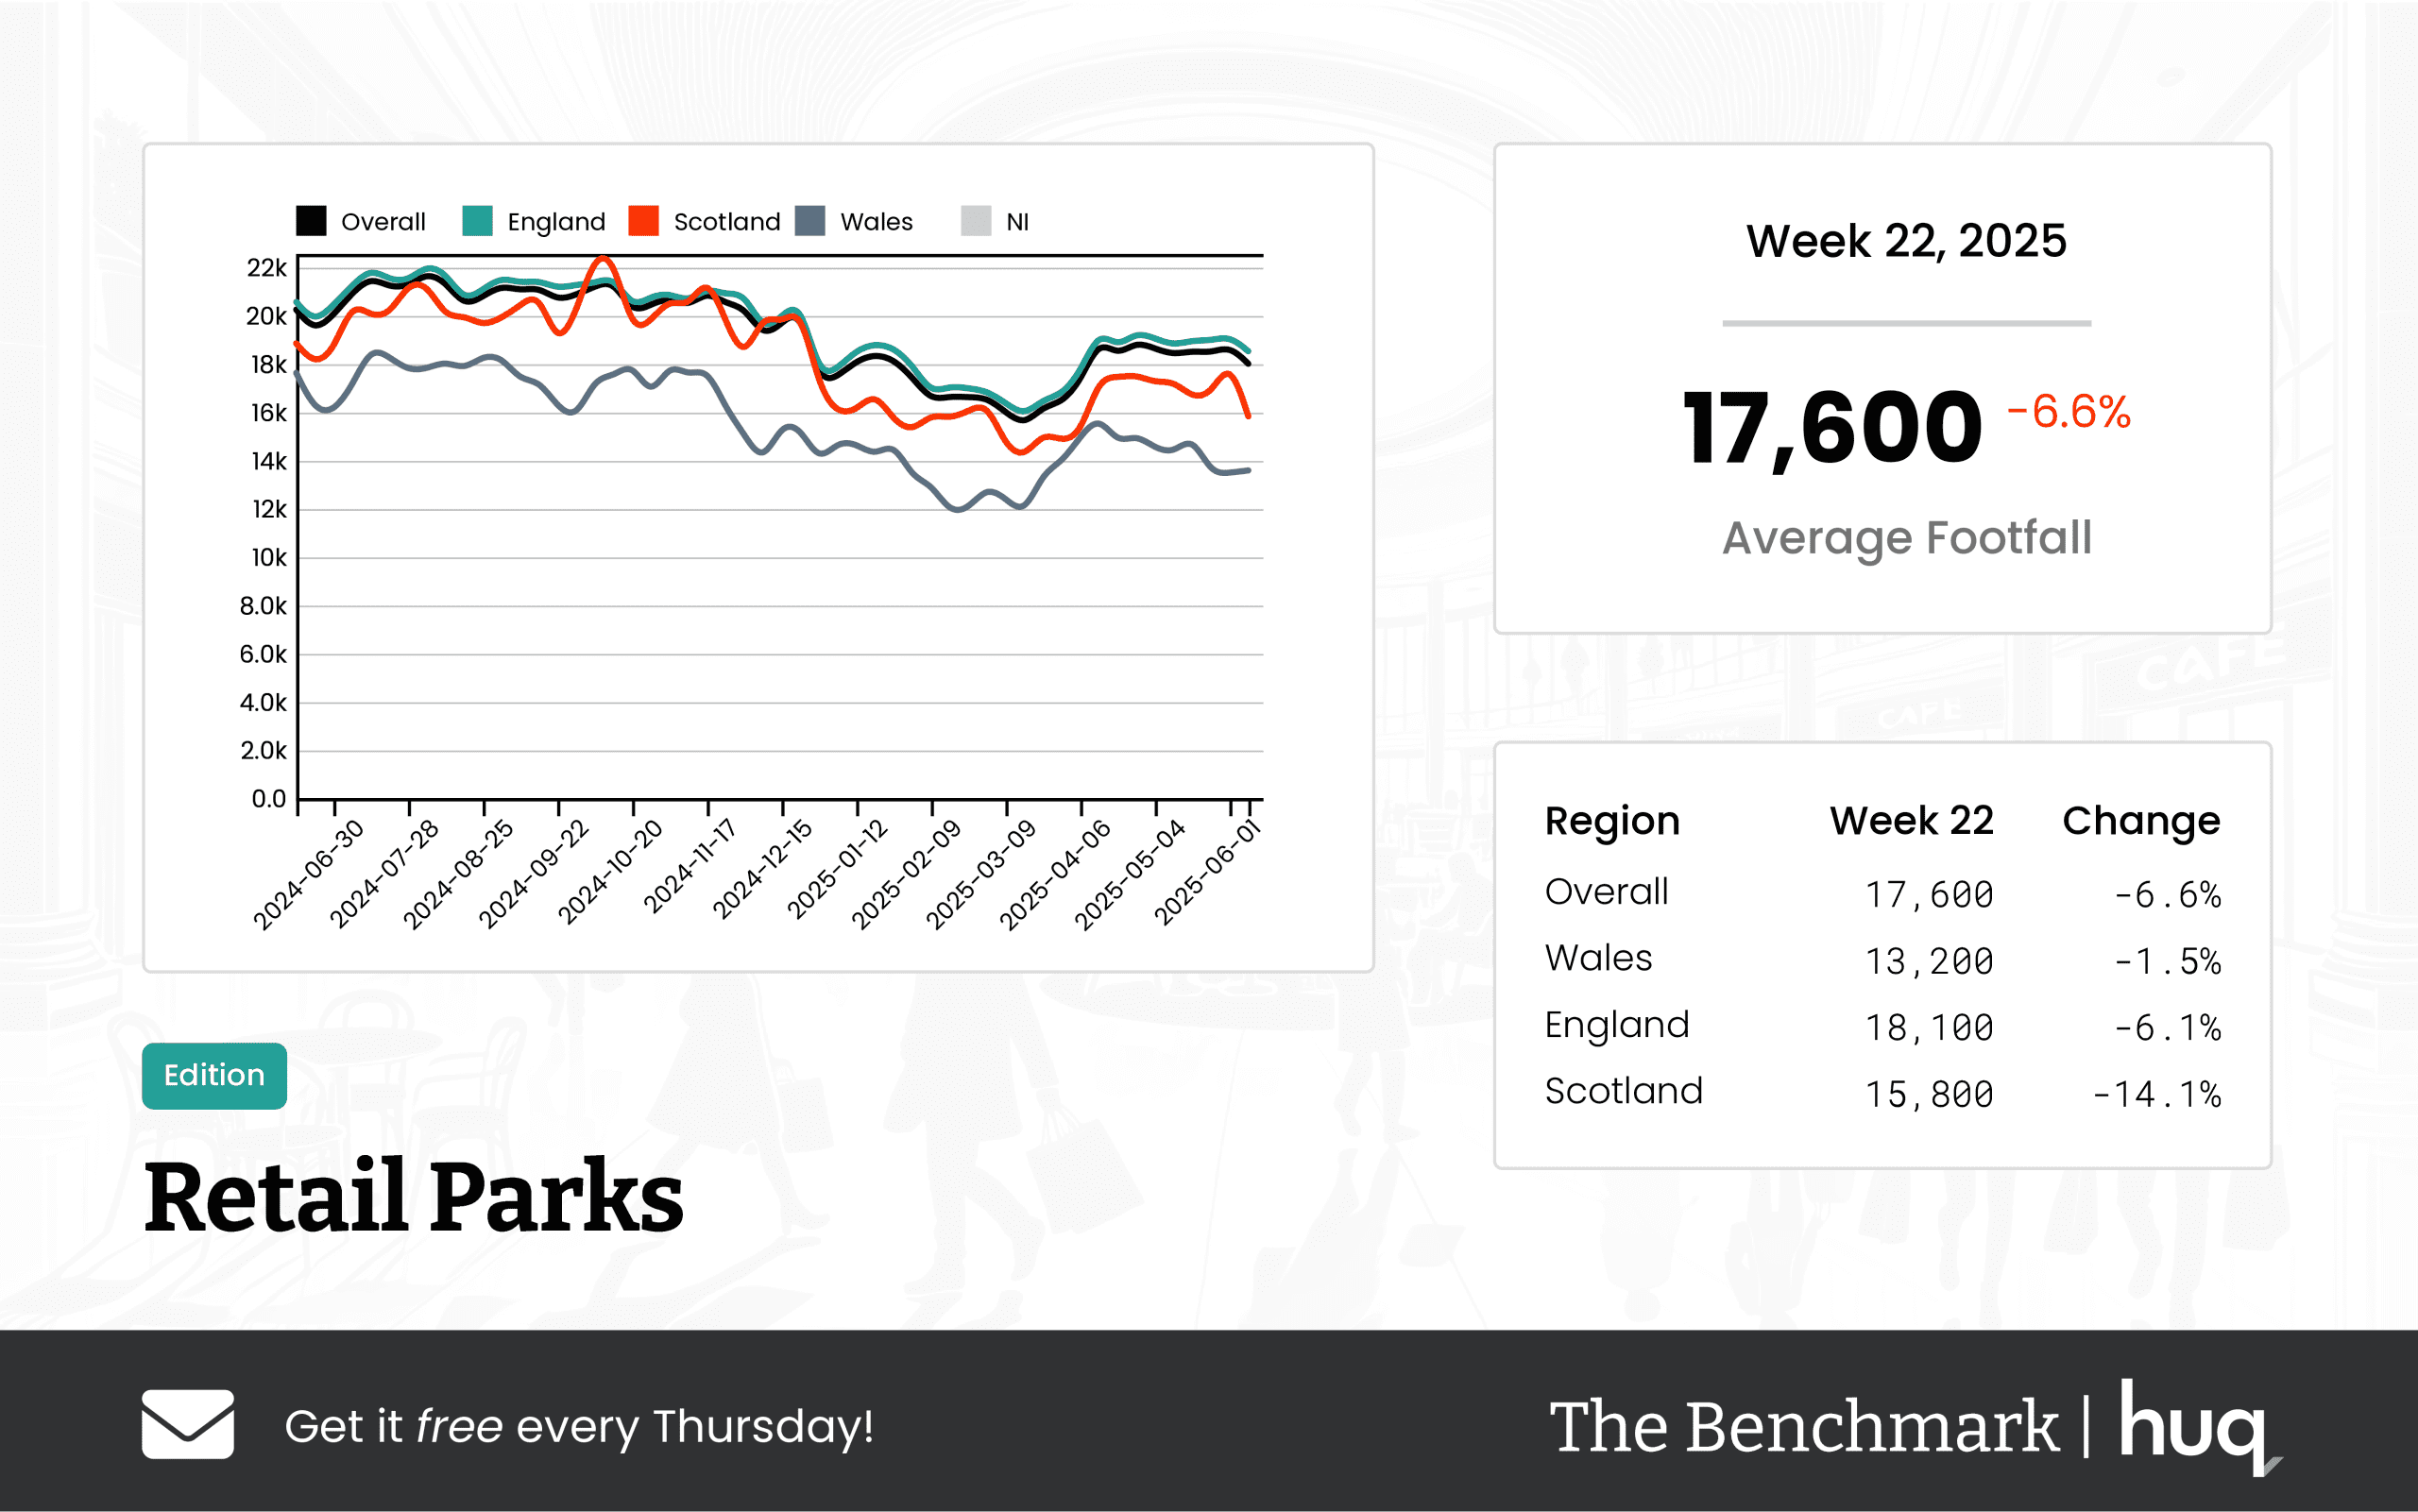
The latest data from The Benchmark Monitor indicate that UK retail parks recorded an average daily footfall of 17,600 for the latest full week – a moderate decline of 6.6% from the previous week and an 11.5% drop compared with the same week last year. With refined location analytics provided by Huq Industries, stakeholders can now assess current trends more thoroughly, focusing on evolving customer engagement alongside solid footfall analysis.
In England, the retail parks recorded an average daily footfall of 18,100, marking a 6.1% decline compared with the previous week and a 10.8% reduction year-on-year. Wales showed steadier performance, with an average of 13,200 daily visitors declining only marginally by 1.5% on a week-on-week basis, though year-on-year figures indicate a notable drop. Meanwhile, Scotland’s retail parks experienced a sharper decline with an average daily footfall of 15,800, falling by 14.1% from the previous week and a 14.5% decrease compared to last year. These regional differences confirm key retail park trends and emphasize the value of targeted location analytics.
Beyond footfall, dwell time metrics provide additional insight into evolving visitor behavior. Although fewer visitors are frequenting these parks, those who do are staying longer. The overall average dwell time is now 77 minutes per visit – an 8.5% improvement from the previous week – and has seen a substantial annual increase. Specifically, England leads with an average visit duration of 79 minutes, a 9.7% week-on-week gain, while visitors in Wales maintain a consistent 77-minute duration. In contrast, Scotland's retail parks have seen lower dwell times, averaging only 60 minutes per visit with both weekly and annual declines, further highlighting divergent regional trends.
Joe Capocci, a spokesperson from Huq Industries, noted, "The data underscores the most striking change – a sharp 14.1% decline in Scotland’s footfall – while extended dwell times in England suggest visitors are engaging more meaningfully. This sentiment is echoed by recent retail park incidents, reinforcing the need for continuous monitoring and analytical insights."
The integration of location analytics provides a richer understanding of customer patterns, and while overall footfall may be dipping, the increased visitor engagement offers hope for turning these trends around in future cycles. Stakeholders are urged to keep a close eye on these evolving metrics to better tailor their strategies in an increasingly competitive retail environment.
Media: For all media and press enquiries, please contact media@huq.io
About Huq Industries
Huq Industries is the leading provider of location intelligence across the UK, Europe, and the Middle East, specialising in delivering high-quality data insights on footfall, consumer behaviour, and retail performance. By leveraging advanced analytics, Huq Industries enables retailers and analysts to understand and respond to market trends effectively, ensuring they are well-equipped to navigate the changing landscape of high street and town centre commerce.
Get the latest intelligence Benchmark update each Thursday!
Frequently Asked Questions
Clear answers to the most common questions about movement intelligence, retail expansion, and location analytics.
Related Blogs and Insights



.svg)
Empowering strategic teams with the world's most accurate and accessible location intelligence.
Contact

.svg)