.svg)
Shopping Centres Footfall Report: Week 5, 2025
Scotland sees 11.1% increase in footfall year-on-year, while Northern Ireland faces a sharp decline, according to latest footfall data.

February 13, 2025
2 min read
Table of contents
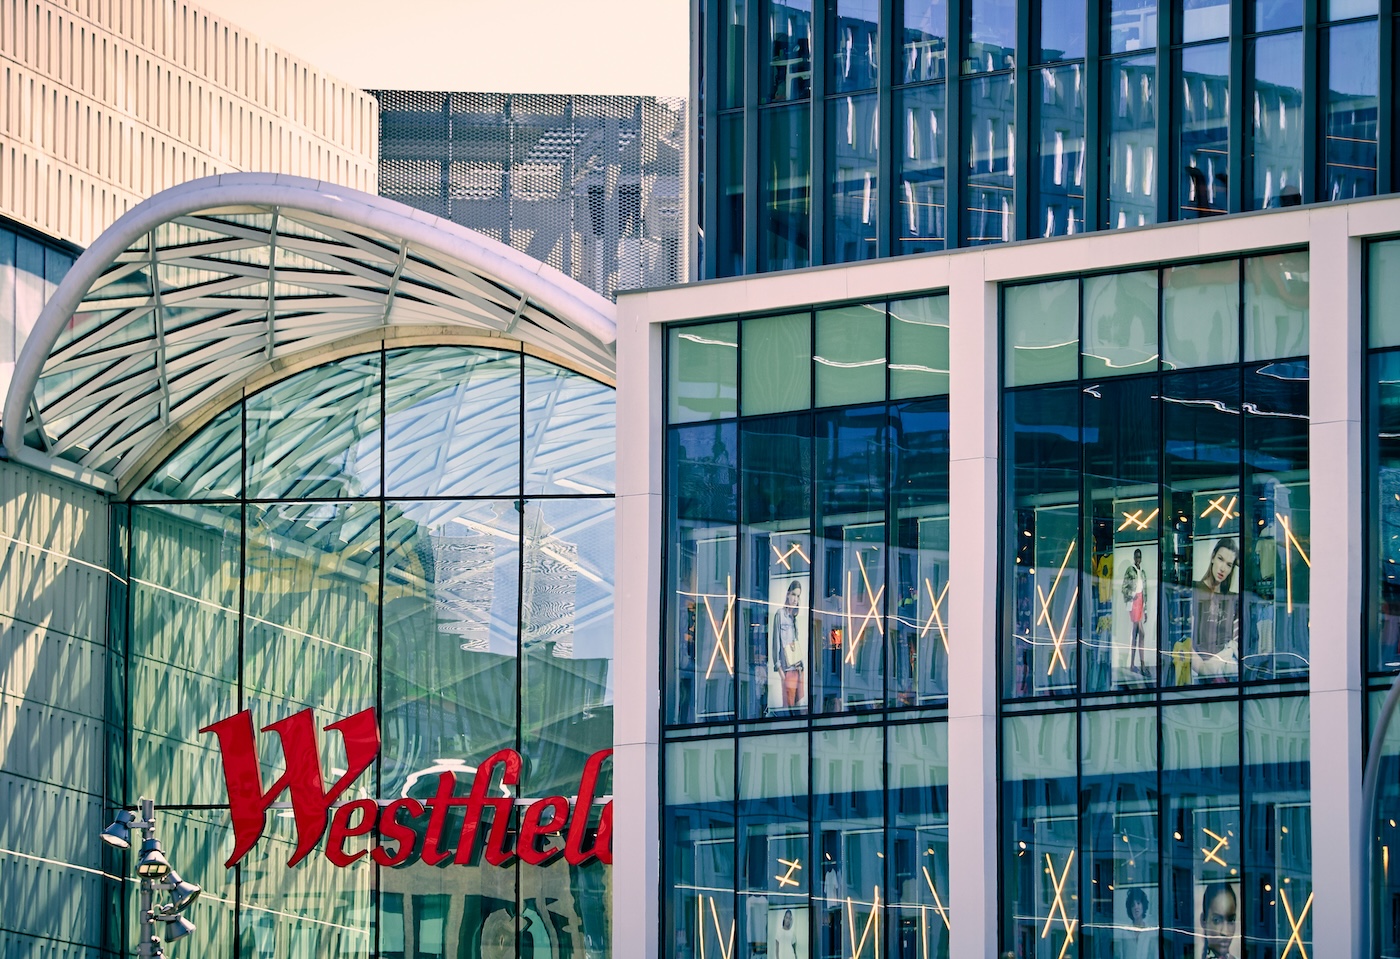
Scotland sees an 11.1% increase in footfall year-on-year, while Northern Ireland faces a sharp decline, according to latest footfall data.
Recent data from Huq Industries reveals varied trends in retail centre visitation across the UK, highlighting regional differences in consumer behaviour. As of the week ending February 9, 2025, the data shows that while some regions experienced a decline in footfall, others saw significant increases in dwell time, indicating a complex landscape for retailers.
Shopping Centres Daily Footfall
Regional Footfall Trends
In Scotland, despite a slight week-on-week decrease in footfall, there was an 11.1% increase compared to the same week last year. Dwell time in Scotland decreased, suggesting shorter visits. Conversely, the West Midlands saw a modest week-on-week increase in footfall and a notable increase in dwell time year-on-year, reflecting longer stays at shopping centres.
Northern Ireland faced a sharp decrease in footfall, one of the steepest declines observed. However, dwell time more than doubled, indicating that those who visited spent a lot more time at the centres. London showed a robust increase in footfall year-on-year, coupled with a slight increase in dwell time, underscoring its resilience as a hub for retail destinations.
Performance of Specific Centres
Gloucester Quays Outlet in the South West and Cheshire Oaks Designer Outlet in the North West were among the top performers, with footfall changes respectively. In contrast, London’s retail centres like the London Designer Outlet in Wembley and Westfield London in Hammersmith and Fulham saw minimal changes, indicating a stabilisation in visitor numbers after previous fluctuations.
Market Outlook
Based on the direction of the latest footfall data and historical trends, the coming four weeks are likely to see continued regional variability in footfall and dwell times. Retail centres in regions with increasing footfall may experience further growth, while those in areas with declining footfall might face challenges. This analysis by Huq Industries not only provides insights into regional retail trends but also helps stakeholders understand the dynamics at play, aiding in strategic planning and operational adjustments.
Partner with huq
Track consumer footfall and spend dynamics across your store network using huq data and compare to your own sales data. Gain insights into crucial questions such as ‘are we out-performing the market’, ‘where are our similar locations for new store growth’, and ‘how healthy is this retail centre’.
If you are interested in basing your location insights to actual consumer behaviour then please connect with our team.
Subscribe now to huq Newsletters. Weekly source for location performance insights - delivered to your inbox. Shopping centres, high-streets, brands and more!
Frequently Asked Questions
Clear answers to the most common questions about movement intelligence, retail expansion, and location analytics.
Related Blogs and Insights



.svg)
Empowering strategic teams with the world's most accurate and accessible location intelligence.
Contact

.svg)