.svg)
Shopping Centres Footfall Report, Week 43: East Midlands Leads
In the latest footfall report from Huq Industries, data from over 2,700 retail centres across the UK for week 43 reveals varied trends in footfall, dwell time, and weekday visitation.

January 9, 2025
2 min read
Table of contents
In the latest footfall report from Huq Industries, data from over 2,700 retail centres across the UK for week 43 reveals varied trends in footfall, dwell time, and weekday visitation. This comprehensive analysis highlights significant regional differences in shopping behaviour and centre performance, crucial for stakeholders in the retail sector.
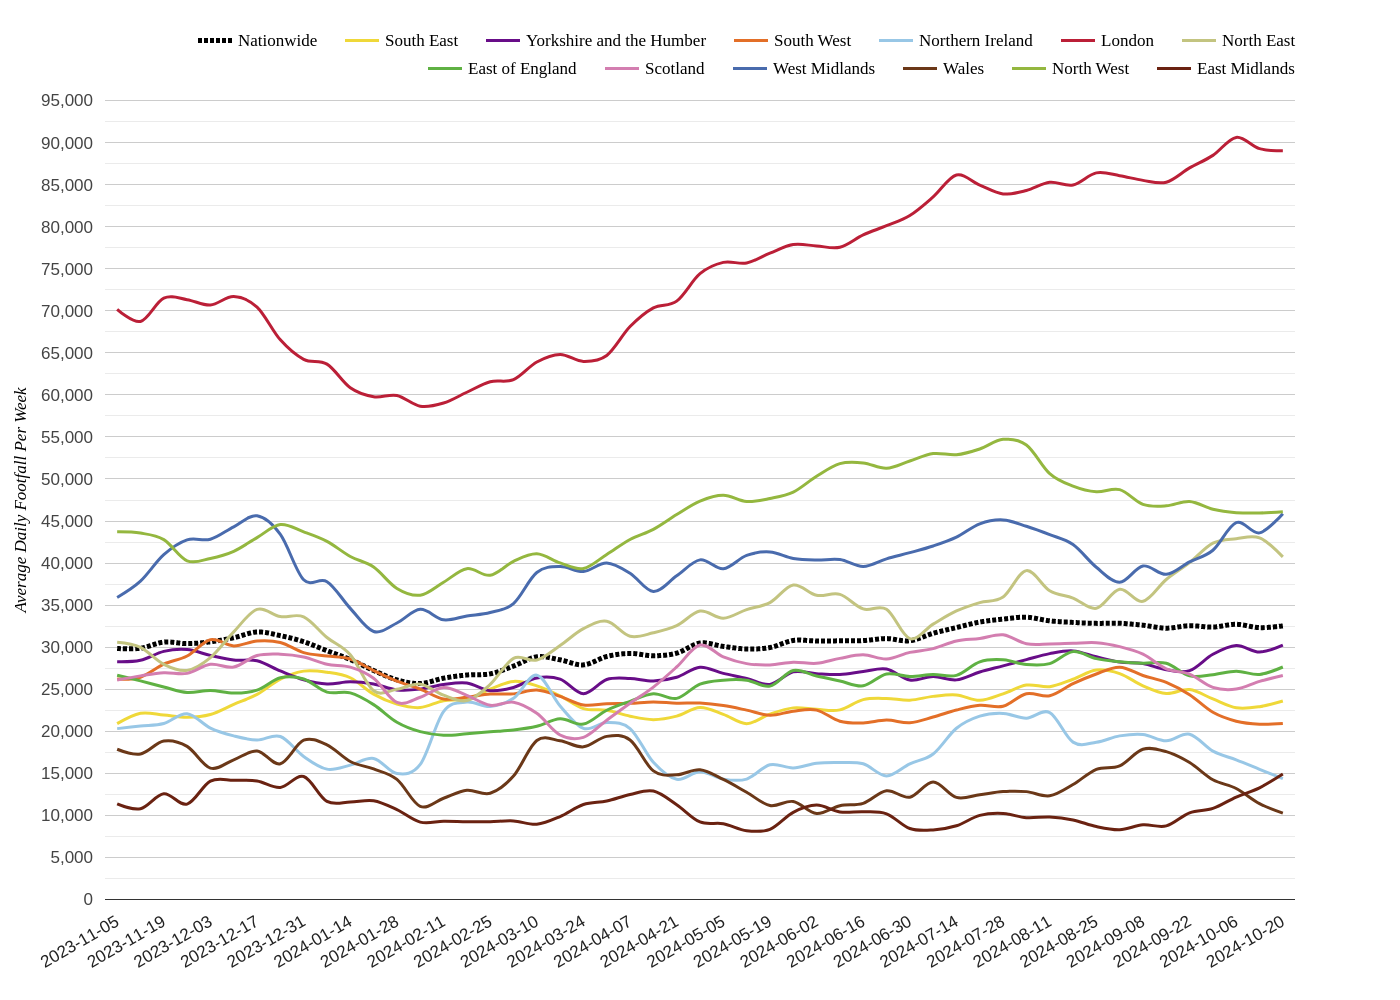
Shopping Centres Daily Footfall
Footfall Data Analysis
In the East Midlands, footfall data indicates a notable increase, marking a significant rise compared to the last 12 months. London also experienced a healthy increase in footfall year on year. Conversely, Wales and Northern Ireland observed a decrease in footfall over the same period, according to the latest footfall statistics.
Dwell Time Insights
Dwell time, which measures the average length of a visit, increased in London, where visitors spent more time per visit compared to the previous year. The West Midlands also saw a substantial increase in dwell time year on year. However, Scotland and the South West experienced a decrease in dwell time, indicating shorter visits.
Weekday Visitation Trends
Weekday visitation shares, which indicate the percentage of visits occurring on weekdays, showed an increase in the North East, reflecting a shift towards weekday shopping. However, regions like Scotland and the South West saw a decrease in weekday visitation, suggesting a different trend.
Location Intelligence in Retail
The report also identifies specific retail centres that have outperformed or underperformed. The White Rose Centre in Leeds and the Ashford Designer Outlet in the South East were among the top performers, showing significant improvements in footfall. In contrast, centres like Merry Hill in the West Midlands and Gloucester Quays Outlet in the South West faced declines.
Market Outlook
Based on the direction of the latest data and trends observed this time last year, huq’s location intelligence analytics suggest that the East Midlands may continue to see an increase in footfall over the coming four weeks. Conversely, regions like Wales and Northern Ireland might not experience significant recovery in footfall during the same period. This forecast is essential for planning and strategy development in location intelligence retail.
Partner with huq
Track consumer footfall and spend dynamics across your store network using huq data and compare to your own sales data. Gain insights into crucial questions such as ‘are we out-performing the market’, ‘where are our similar locations for new store growth’, and ‘how healthy is this retail centre’.
If you are interested in basing your location insights to actual consumer behaviour then please connect with our team.
Frequently Asked Questions
Clear answers to the most common questions about movement intelligence, retail expansion, and location analytics.
Related Blogs and Insights



.svg)
Empowering strategic teams with the world's most accurate and accessible location intelligence.
Contact

.svg)