.svg)
Retail Parks Footfall Report: Week 51 2024
Recent data from Huq Industries reveals nuanced trends in retail park visitation across the UK, highlighting regional variations in footfall, dwell time, and weekday visitation for the week ending December 21, 2024.

January 9, 2025
2 min read
Table of contents
Recent data from Huq Industries reveals nuanced trends in retail park visitation across the UK, highlighting regional variations in footfall, dwell time, and weekday visitation for the week ending December 21, 2024. The data, which covers over 2,700 retail centres, shows a mixed bag of results with some regions experiencing slight declines in footfall while others see improvements in dwell times.
Retail Parks Daily Footfall
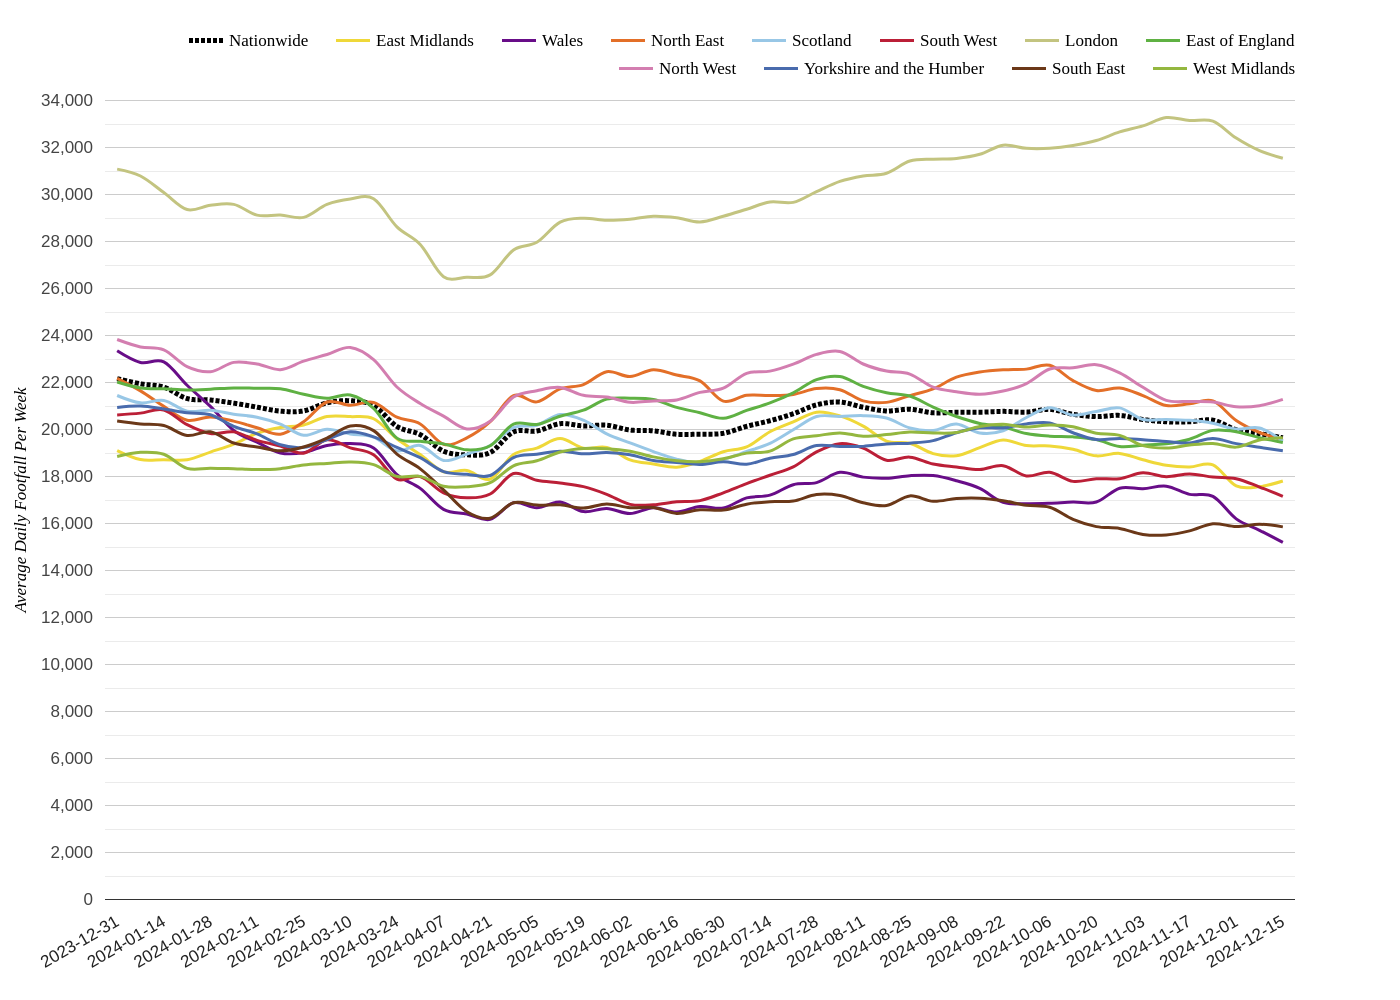
In Yorkshire and the Humber, there was a slight week-on-week decrease in footfall by 0.7%, but the average visit dwell time increased by 5.2% from the previous week. This suggests that while fewer people may be visiting, those who do are staying longer. Similarly, in the South West, footfall decreased by 2.3% week-on-week, yet the average dwell time decreased slightly by 1.8%.
The North West saw a 1.3% increase in footfall week-on-week, coupled with a 1.7% increase in dwell time, indicating a positive trend in both metrics. Conversely, the East of England experienced a 1% decrease in footfall week-on-week, but dwell time increased by 1.3%.
London shows a stable trend with a slight decrease in footfall by 1% week-on-week, but a 2.4% decrease in dwell time, suggesting a quicker turnover of visitors. Scotland’s footfall decreased by 2.7% week-on-week, with a 1.3% decrease in dwell time, indicating a general decline in retail park activity in the region.
These regional variations highlight the dynamic nature of retail park visitation in the UK, influenced by a range of factors from local economic conditions to seasonal changes. Retailers and commercial real-estate companies can leverage this data to better understand consumer behavior and optimize their strategies accordingly.
Partner with huq
Track consumer footfall and spend dynamics across your store network using huq data and compare to your own sales data. Gain insights into crucial questions such as ‘are we out-performing the market’, ‘where are our similar locations for new store growth’, and ‘how healthy is this retail centre’.
If you are interested in basing your location insights to actual consumer behaviour then please connect with our team.
Frequently Asked Questions
Clear answers to the most common questions about movement intelligence, retail expansion, and location analytics.
Related Blogs and Insights



.svg)
Empowering strategic teams with the world's most accurate and accessible location intelligence.
Contact

.svg)