.svg)
Harnessing Daypart Footfall Data
Discover how daypart footfall data helps local authorities and BIDs understand hour-by-hour visitor patterns to guide planning and strategy.

November 4, 2024
3 min read
Table of contents
Harnessing Daypart Footfall Data for Local Economic Insights
Daypart footfall data has become an indispensable asset for local governments and Business Improvement Districts (BIDs) looking to understand how and when people interact with their spaces. In this post, we’ll explore how huq’s platform leverages daypart footfall insights to help local authorities and BIDs maximise the effectiveness of their town centres, high streets, and retail areas.
Sample Report
Gain a clearer understanding of how residents and visitors interact with local centres. Guide public investment decisions by identifying areas that would benefit most. Combine footfall data with local business and service usage metrics to understand the impact of local initiatives. Footfall data provides an evidence-based foundation for long-term planning.
What is Daypart Footfall?
Daypart footfall data captures visitor numbers by time of day, providing a nuanced view of how foot traffic fluctuates from morning to night. This information is especially valuable for understanding daily engagement patterns across locations, from retail centres to town squares and high streets. Tracking when people engage with a space helps local authorities tailor resources and services to align with community behaviour, driving both economic activity and public satisfaction.
Using Daypart Data to Monitor Place Performance
Consider Newcastle City Centre: tracking daypart footfall over a year shows visitor trends from early morning to late at night. In this example, Newcastle sees the majority of its footfall in the afternoon and maintains strong evening and nighttime activity, largely due to its vibrant nightlife. Daypart data shows not only when people visit, but also offers insights into what may be driving engagement at certain times. Comparing different locations within a region, such as Newcastle City Centre and Kingston Park Retail Centre, further highlights each area’s strengths. Kingston Park, for instance, might attract higher morning footfall, while the city centre sees greater nighttime traffic. This level of detail allows councils to adapt their strategies to support each location’s unique role in the local economy.
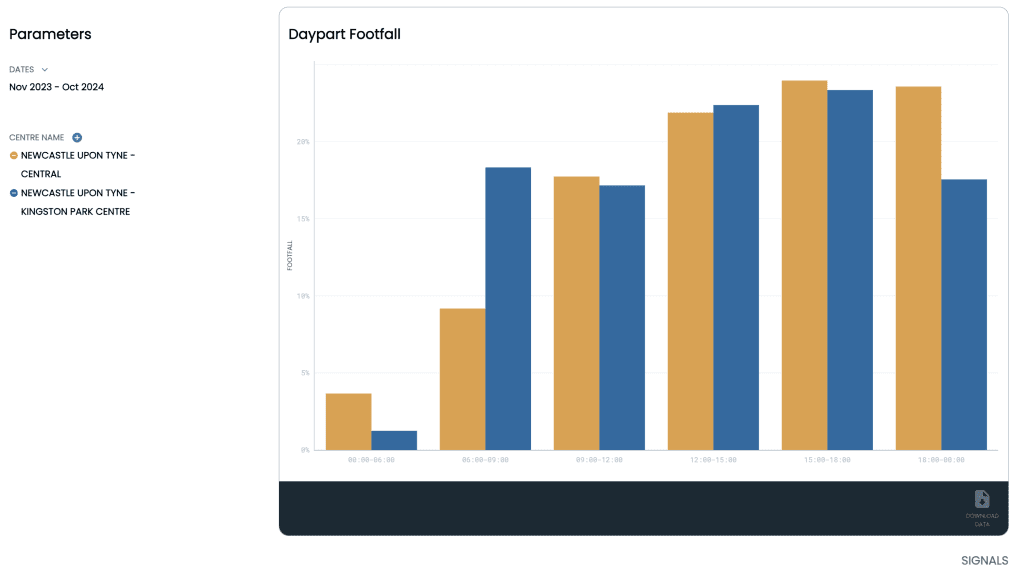
A daypart footfall comparison of Newcastle city and Kingston park retail centre.
Informing Decisions with Daypart Footfall
Daypart data also helps local governments plan resources and policies more effectively. High morning activity in retail centres could encourage adjustments to parking, transport, and business operating hours, while robust evening footfall in city centres might support investment in nighttime safety measures and public transport options. By having this regularly updated information at their fingertips, local authorities can develop targeted interventions that respond to each area’s specific needs. Moreover, the ability to track trends over multiple years—thanks to huq’s dataset spanning back to January 2019—enables councils to measure the impact of past projects and forecast future needs. Comparing current daypart trends with those from previous years also provides context for understanding recovery from challenges like the COVID-19 pandemic and helps guide the implementation of regeneration strategies.
Why Daypart Footfall Data is Essential for Thriving Local Economies
Daypart footfall data goes beyond simply tracking numbers; it offers a powerful, detailed view of community engagement, helping local authorities and BIDs to make data-driven decisions that enhance place performance. By understanding visitor behaviour throughout the day, councils can better support local businesses, improve public services, and strengthen the appeal of public spaces. Ultimately, this data is key to building vibrant, inclusive communities that meet the evolving needs of residents and visitors alike.
Is your team facing similar challenges?
Our experienced team can demonstrate how to use location intelligence and analytics to augment a wide range of use cases, including:
- Identifying areas for community-focused investments
- Optimising the use of public spaces and facilities
- Informing local economic development strategies
- Enhancing the effectiveness of community engagement initiatives
- Benchmarking performance across districts and town centres
- Understanding the local business landscape and visitor demographics
- Optimising event timing and public service hours
Ready to get started? Speak to one of our location experts
Book a demo
Is your team facing similar challenges?
Our experienced team can demonstrate how to use location intelligence and analytics to augment a wide range of use cases, including:
- Identifying areas for community-focused investments
- Optimising the use of public spaces and facilities
- Informing local economic development strategies
- Enhancing the effectiveness of community engagement initiatives
- Benchmarking performance across districts and town centres
- Understanding the local business landscape and visitor demographics
- Optimising event timing and public service hours
Ready to get started? Speak to one of our location experts
Frequently Asked Questions
Clear answers to the most common questions about movement intelligence, retail expansion, and location analytics.
Related Blogs and Insights



.svg)
Empowering strategic teams with the world's most accurate and accessible location intelligence.
Contact

.svg)