
Commercial real estate analytics report
·
United States
Commercial real estate analytics for retail and mixed-use assets
Foot traffic evidence for leasing, valuation discussions and asset management at US shopping centers, retail strips and mixed-use properties.
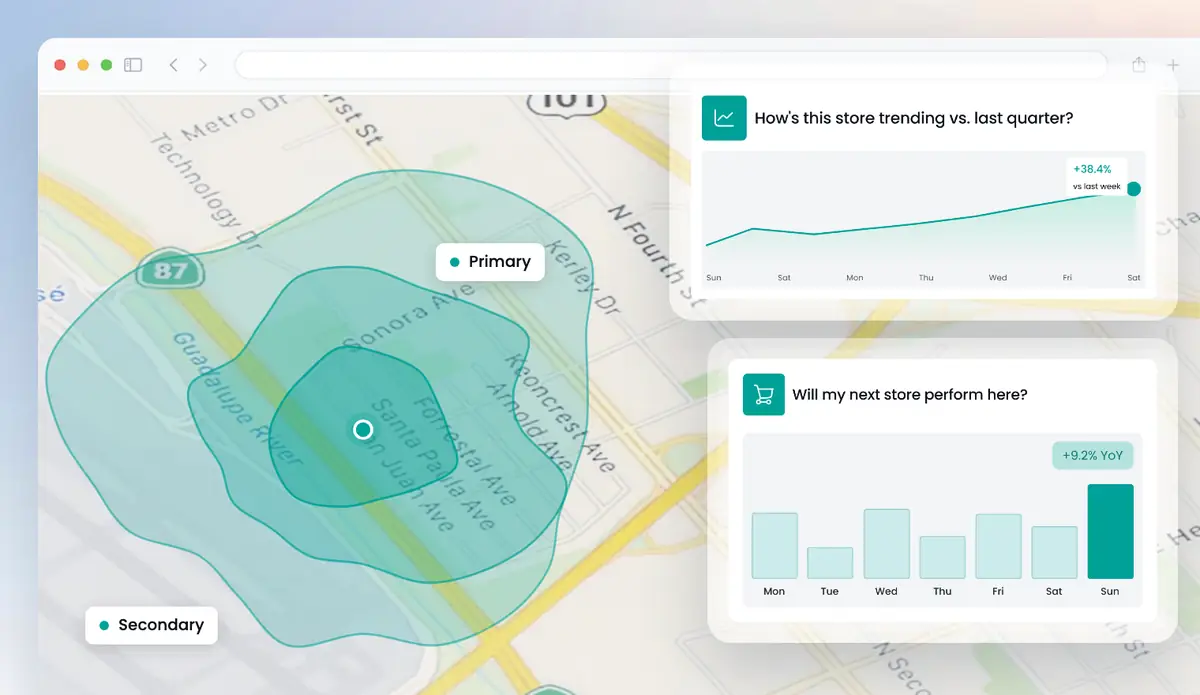
Get a free analysis of your locations
Up to 5 locations. No cost, no commitment.
We handle your details in line with the CCPA and applicable US state privacy laws.
Commercial real estate analytics covers everything from NOI models to lease administration. Huq handles one part of it for retail and mixed-use assets: how people use the property. Weekly foot traffic, residents versus visitors, catchment and drive time, dwell time and benchmarks against competing assets give you evidence for leasing, valuation discussions and asset management. It complements your financial and market data rather than replacing it.
See how commercial real estate analytics works in Huq
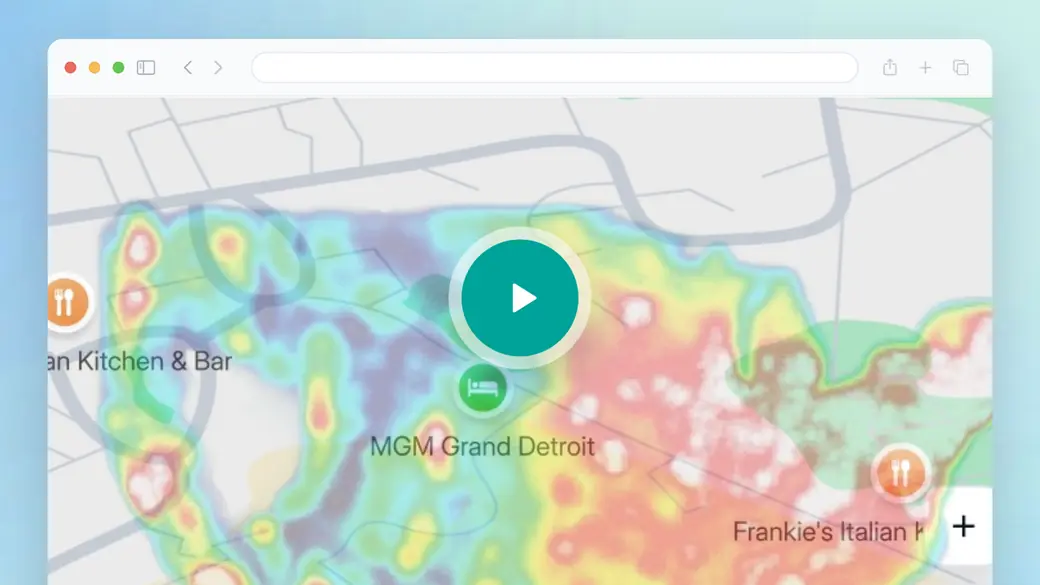
The video gives a short overview of the Huq platform, from the Explore map to Projects and reports. Look for how an asset is selected, how its foot traffic, catchment and density are shown, and how a portfolio is monitored in one place. For commercial real estate analytics, that is the asset-level evidence behind leasing and valuation work.
- Projects: monitor every asset in a portfolio together, with status tracking and reporting for investors and lenders.
- Shopping center and retail center types: benchmark an asset against competing centers of the same type nearby.
- Monthly PDF location reports: KPIs against prior periods, regional and national benchmarks, dayparts and dwell time for each asset.
Trusted by 300+ organisations · Data across 35 markets






What is commercial real estate analytics?
Commercial real estate analytics is the work of turning property, market and financial data into decisions. It spans investment modeling, market intelligence, property management, deal sourcing and location intelligence. Most teams use several tools, each covering one part.
For retail and mixed-use assets, the location intelligence part carries real weight. Rent and occupancy depend on visits: how many people come, how often, how long they stay and where they travel from. Those numbers shape tenant demand, lease renewals and how buyers view an asset.
Huq covers that part. It measures foot traffic at any US address every week, adds catchment, drive time and density, and benchmarks an asset against competing centers of the same type. Geo-spend is available in selected markets. More than 1,000 locations are manually validated in each of Huq's 35 markets twice a year. Huq doesn't model NOI or cap rates, so it sits next to your financial models.
What's in your commercial real estate analytics report
01
Weekly foot traffic trends
Visits to the asset each week, to track performance through a hold period or after repositioning.
02
Catchment and drive time
Where visitors come from and how far they travel, to support leasing pitches and test valuation assumptions.
03
Cross-visitation between assets
Shared and unique visitors for up to 10 location pairs, useful evidence on co-tenancy and tenant mix.
04
Benchmarking vs competing assets
Foot traffic, dwell time and visit frequency at your property compared with competing centers nearby.
What a commercial real estate analytics report shows
A sample asset check for one retail property against its competitive set.
01
Asset foot traffic vs its competitive set
Weekly visits at your property and nearby competing centers. Share of visits shows whether the asset is gaining or losing ground in its market.
02
Visits by day and week part
Visits by time of day and weekday show when the property is busiest, useful in conversations with food, leisure and service tenants.
03
Dwell time and repeat visits
How long visitors stay and how often they return. Rising dwell and frequency support a stronger leasing story; falling numbers flag risk early.
CRE analytics for retail assets across the US
Huq covers any address in the United States: shopping centers, main streets, downtowns, strip malls, competitors' stores and sites you haven't opened yet. No counters, sensors or cameras needed.
Huq manually validates more than 1,000 locations in each of its 35 markets twice a year, and data refreshes weekly.
How it works
Step 1
Tell us your locations
Add up to five addresses in the form. Your own stores, candidate sites or competitors.
Step 2
We run the analysis
Our team maps each location from observed visitor data.
Step 3
We walk you through it
A short call to take you through what the data shows and what it means for you.
Why asset managers use Huq for commercial real estate analytics
- Huq publishes its accuracy by country: a 19.5% median error across published markets, against a 30% healthy threshold.
- Huq's customers give it an NPS of 42.
- Trusted by 300+ organizations across 35 markets, including the global insights, research and location intelligence teams at Nike, Adidas, JD Sports and Samsung.
huq's platform gave us valuable data to support a key decision on potential new sites.
Dan Brogden
National Sales Manager, Puccinos
Who it's for
01
Retail chains of any size
From five-store retailers planning their next site to national brands: choose locations, track store performance and benchmark against competitors.
02
Retail real estate owners
Show shopping center performance, support leasing and get the tenant mix right, for landlords, asset managers and brokers.
03
Investors and private equity
Check how retail brands and assets actually perform before you buy, and monitor them after.
Everything Huq measures, in one platform
- Foot traffic: by week, month and year, with totals, average daily foot traffic, trends, period-over-period change, and visiting vs passing traffic.
- Residents and visitors.
- Trade area and travel time: trade areas by ZIP code, plus drive-time and travel-time analysis.
- Demographics and profiling: age, gender and purchasing power, available in selected markets.
- Behavior: visit frequency, dwell time, time of day and dayparts, cross-visitation between up to 10 location pairs, and international visitation for tourism.
- Foot traffic density and transportation mode.
- Places, brands and industries: points of interest, brand locations and brand analysis, industry performance, shopping center and retail center types.
- Geo-spend: spend by volume and category, available in selected markets.
- Tools: the Explore map (draw any area or use layers for travel time, trade areas, shopping centers, retail centers, brand locations, industries and ZIP codes), White Space Analysis, and Projects for monitoring many locations and reporting to stakeholders.
- Delivery: the platform, CSV or Excel exports, monthly PDF location reports, and data feeds as Parquet and CSV files into Amazon S3 or Google Cloud Storage buckets.
- Cadence: data refreshes weekly.
Frequently asked questions
Where can I get verified CRE market data?
For rents, vacancy and transactions, use established property databases and brokerage research, and check how they source records. For foot traffic, ask how the data is validated. Huq manually validates more than 1,000 locations in each of its 35 markets twice a year. In its own study, Huq visit data tracked Walmart's quarterly US net sales with 0.85 correlation.
What is a commercial real estate data platform?
A platform that brings property data into one place so you can search, analyze and report on it. Some store records such as listings, comps and rents. Others, like Huq, focus on location data: select a property on the Explore map and get weekly visits, catchment, drive time and benchmarks, with monthly PDF reports. Huq doesn't hold listings or comps.
How does foot traffic data help asset management?
It shows how an asset performs between rent reviews. Weekly visit trends highlight decline or recovery early, catchment data supports leasing pitches, and benchmarks against competing centers show where the property stands. Teams use it in tenant conversations, business plans and investment committee packs.
What's in the free commercial real estate analytics report?
An asset check for one retail or mixed-use property: weekly foot traffic trend, where visitors come from, dwell time and a benchmark against one or two competing properties. It shows how Huq's evidence would fit into your leasing or valuation work.
How often is the data updated?
Weekly. Each update adds to the trend for every property, so you can compare performance over time and report on an asset at whatever interval your investors or lenders expect.
Which US assets does Huq cover?
Huq measures foot traffic at any address across the US, including shopping centers, retail strips, main streets and mixed-use schemes. No sensors, cameras or hardware are needed, so you can analyze assets you are underwriting as well as those you own. More than 1,000 locations are manually validated in each of Huq's 35 markets twice a year.
Questions? Talk to us
Book a demoAbout Huq
Huq is a location intelligence company. We turn anonymised mobile location data into footfall, catchment and visitor insight for any place, so retailers, property owners and local authorities can make decisions on evidence.
See how your locations really perform
Up to 5 locations. No cost, no commitment.