
Retail location analysis
·
Retail location analysis in the Benelux
Measure footfall, catchment and dwell time for stores and sites in Belgium, the Netherlands and Luxembourg. Compare every location on the same basis.
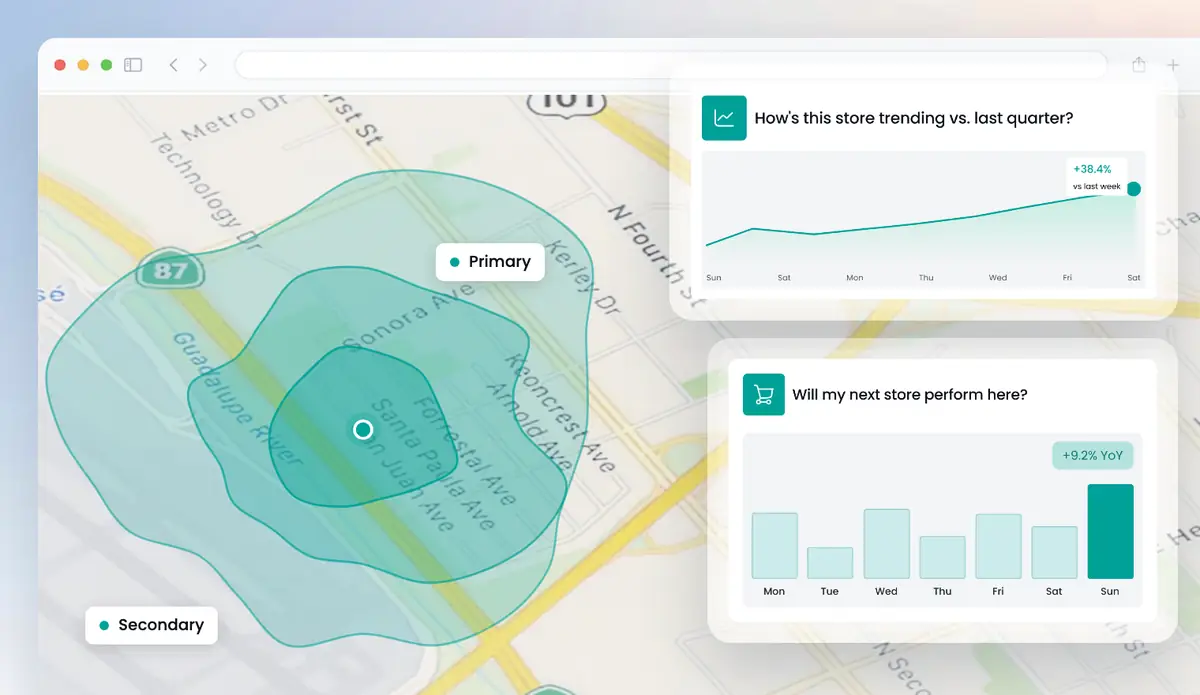
Get a free analysis of your locations
Up to 5 locations. No cost, no commitment.
Retail location analysis from Huq shows how your stores and candidate sites in Belgium, the Netherlands and Luxembourg really perform. See footfall by week, month and year, visiting versus passing traffic, catchment by postcode and dwell time. Compare a Dutch shopping street with a Belgian shopping centre on the same basis. Huq's MAPE is 15.7% in the Netherlands and 17.0% in Belgium.
Retail location analysis in the Huq platform
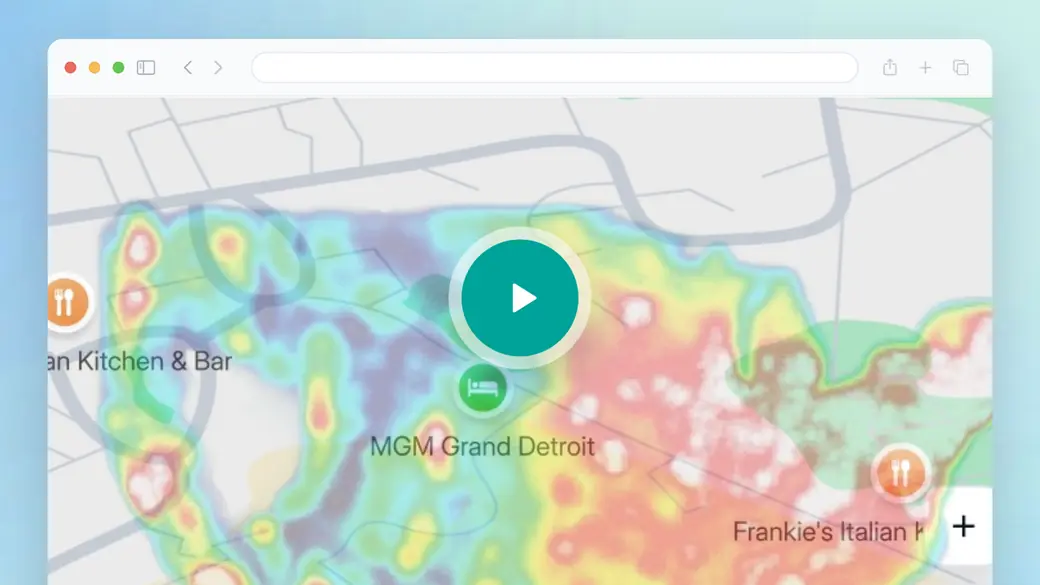
The overview shows the whole Huq platform. For location analysis, watch how footfall for one place breaks down by week, month and year, and into visiting and passing traffic. Every address is handled the same way. So a store in Antwerp and a store in Eindhoven give you figures you can put side by side.
- Footfall trends for one store or shopping street
- Visiting versus passing traffic around a location
- Dwell time and dayparts for a location
Trusted by 300+ organisations · Data across 35 markets






What is retail location analysis?
Retail location analysis measures how a place performs. How many people come? Where do they live? When do they visit, and how long do they stay? It applies to stores you already run and to sites you are considering.
In the Benelux it is often cross-border work. A chain with stores in Amsterdam, Antwerp and Luxembourg City needs one way to compare them. Local counting systems and city footfall counts differ by country and by city. Huq uses one method for every address, so a city centre store in Utrecht and a shopping centre store near Brussels can be compared directly.
Teams use location analysis to explain why one store lags another, prepare lease renewals, plan refits and check whether a shopping street is growing or declining. It is the evidence base. The decision about where to open next is site selection.
What's in your retail location analysis
01
Footfall by week and month
Totals, average daily footfall and period-on-period change for each store or street.
02
Visiting and passing traffic
See how many people visit the area around a store and how many only pass by.
03
Catchment by postcode
Visitor origins by postcode, travel-time bands in km and the split between residents and visitors.
04
Dwell time and dayparts
When people come and how long they stay, by time of day and day of week.
What a retail location analysis shows
Three views give a fast, comparable read on any Benelux location.
01
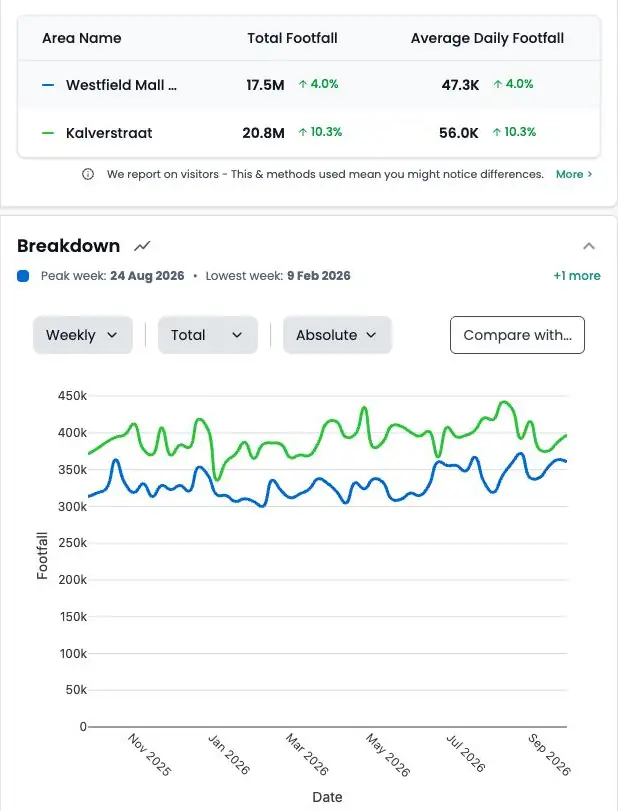
Monthly report with benchmarks
Each monthly PDF report sets the location's footfall against regional and national trends. You see if it beats or lags its market.
02
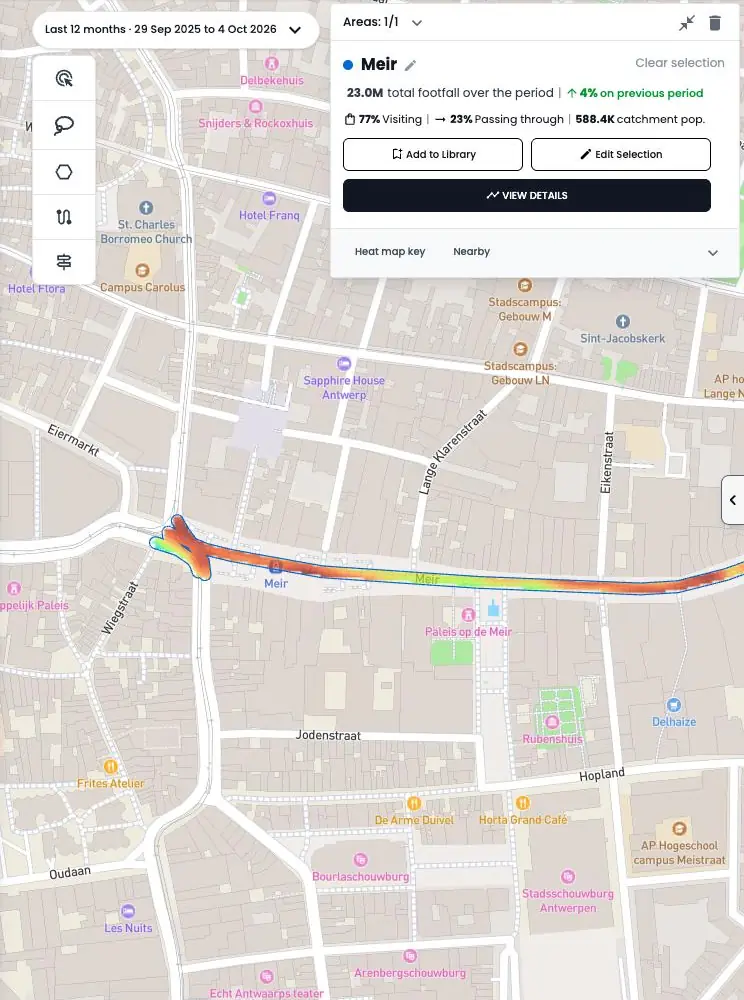
Density heat map
Heat maps of visiting and passing traffic show where activity concentrates on a shopping street or in a centre.
03
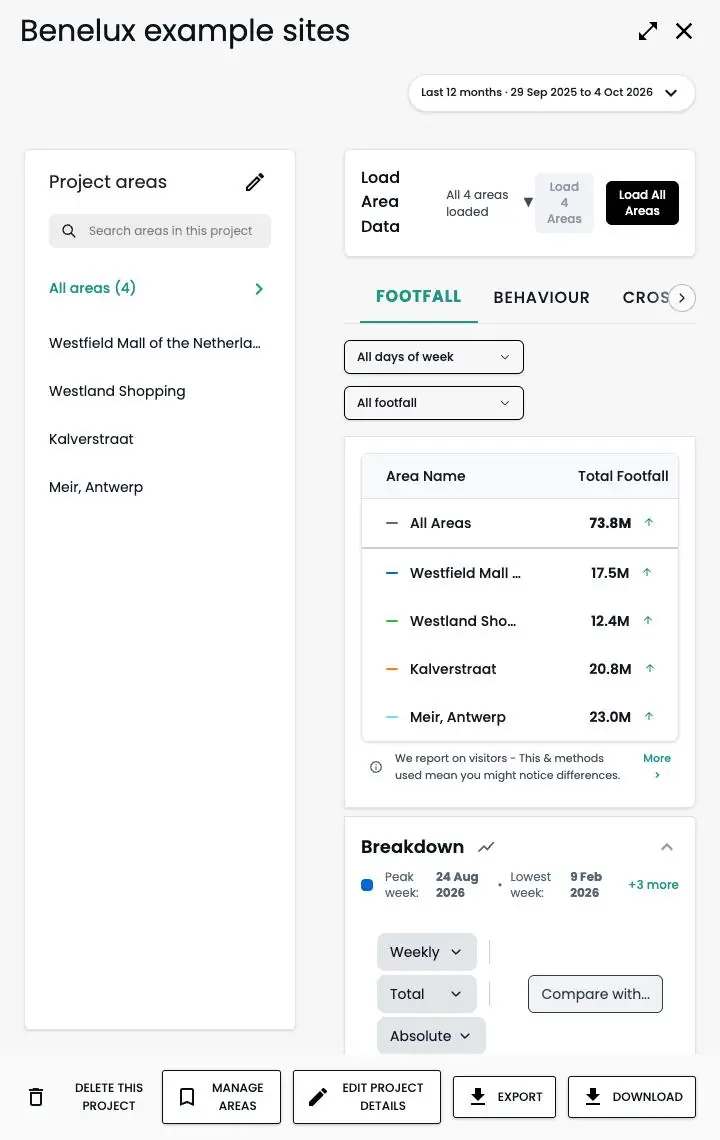
All stores in one Project
Put Dutch, Belgian and Luxembourg stores in one Project to compare them and share monthly PDF reports.
Retail location analysis across Belgium, the Netherlands and Luxembourg
How it works
Step 1
Tell us your locations
Add up to five addresses in the form. Your own stores, candidate sites or competitors.
Step 2
We run the analysis
Our team maps each location from observed visitor data.
Step 3
We walk you through it
A short call to take you through what the data shows and what it means for you.
Why Benelux retailers use Huq for retail location analysis
Who it's for
01
02
03
About Huq
Huq is a location intelligence company. We turn anonymised mobile location data into footfall, catchment and visitor insight for any place, so retailers, property owners and local authorities can make decisions on evidence.
See how your locations really perform
Up to 5 locations. No cost, no commitment.