
Location analytics software
·
Location analytics software for Benelux sites
Measure, compare and report on footfall at any address in Belgium, the Netherlands and Luxembourg. Weekly data with exports and data feeds.
Get a free analysis of your locations
Up to 5 locations. No cost, no commitment.
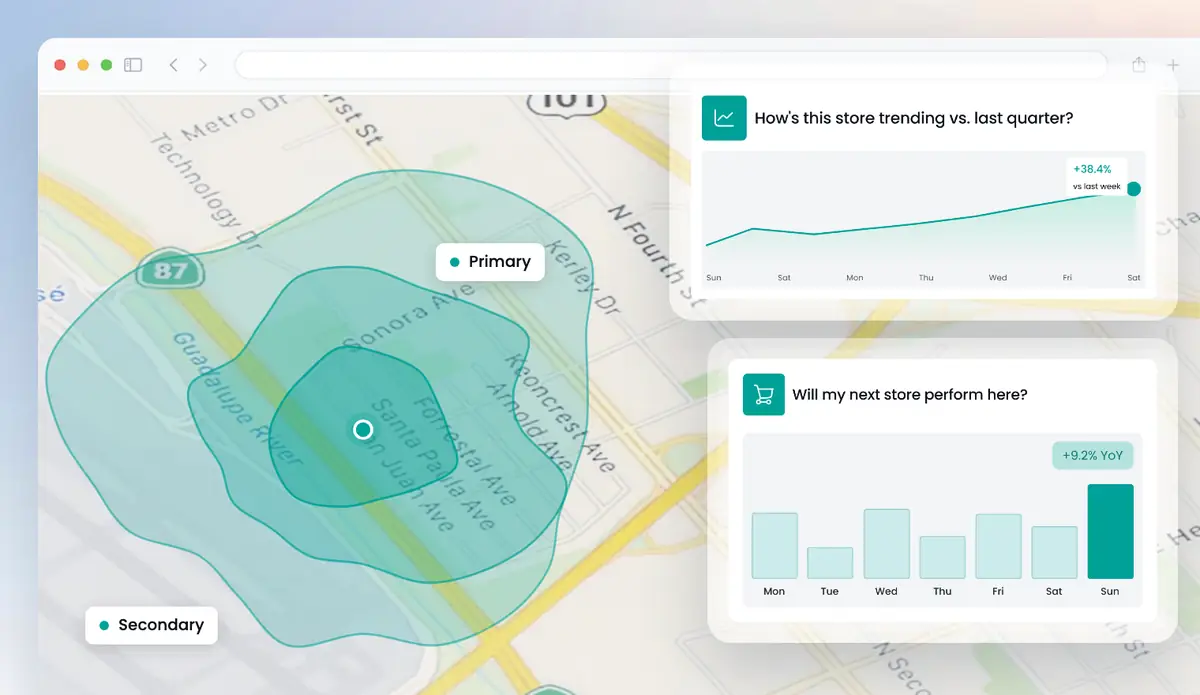
Huq is location analytics software for teams that compare sites across Belgium, the Netherlands and Luxembourg. Add one address or a full branch list. See footfall trends, visiting vs passing traffic, catchment and dwell time. Rank sites against regional and national benchmarks. Export the numbers or send a monthly PDF report. Accuracy is published by country: 15.7% MAPE in the Netherlands and 17.0% in Belgium.
Location analytics for a branch network
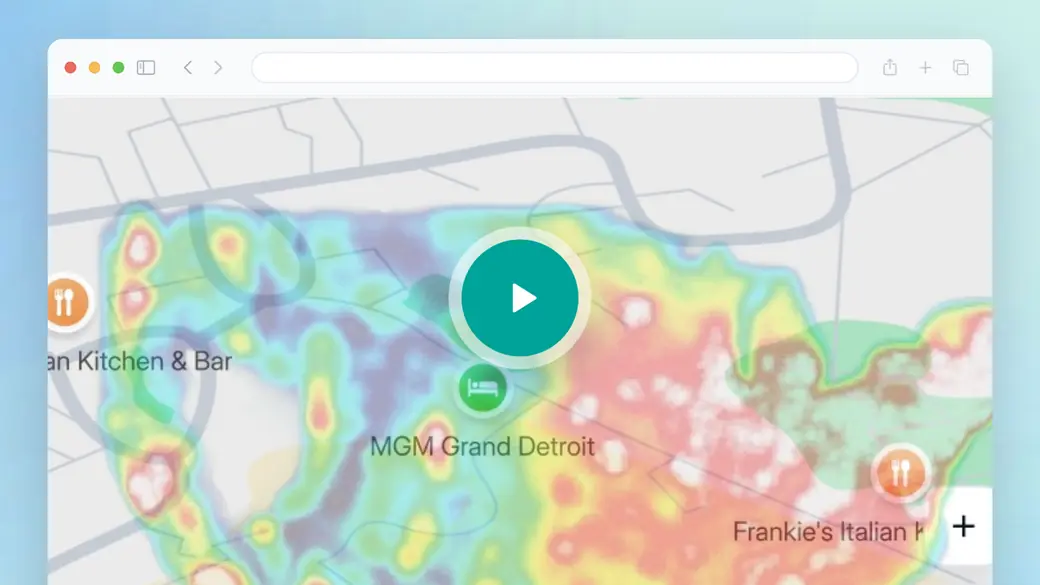
Focus on the workflow, not the visuals. How does an analyst measure one site? How are many sites compared? How do results leave the platform? Look for those three steps in the overview. For Benelux teams with branches in many cities, they decide whether location analytics software saves time.
- One site: footfall by week, month and year, with change on last period
- Many sites: rankings and benchmarks inside a Project
- Output: CSV, Excel, PDF reports or weekly feeds to S3 or Google Cloud Storage
Trusted by 300+ organisations · Data across 35 markets






What is location analytics?
Location analytics, also called location-based analytics, is the analysis of data linked to physical places. It measures and compares what happens at a site over time. Location intelligence is the broader practice of choosing where to act. Location analytics is the measuring and comparing part.
The term covers very different tools. Some count visitors inside one store. Some report where website users are. Some are GIS add-ons for spatial models. Huq analyses observed footfall and visitor behaviour at any address, from a single unit to a national branch network, without hardware on site.
Common Benelux uses: compare a branch in Amsterdam with one in Eindhoven. Check how a shopping centre in Liège performs on Saturdays against weekdays. Measure the effect of a new competitor on a shopping street. Data refreshes weekly, so trends are easy to follow.
What's in Huq's location analytics software
01
Footfall metrics
Totals, average daily footfall, trends, period-on-period change, and visiting vs passing traffic.
02
Rankings and benchmarks
Compare sites with each other and with regional and national benchmarks.
03
Time and behaviour
Dayparts, weekday patterns, dwell time, visit frequency and cross-visitation.
04
Data out
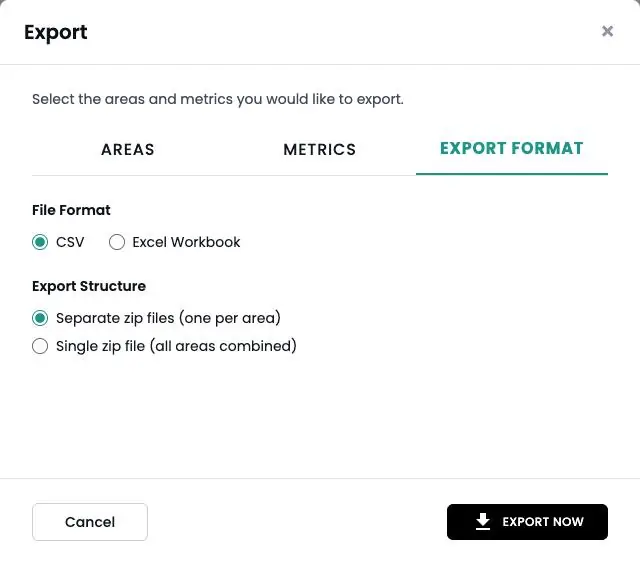
CSV or Excel exports per area or combined, PDF reports, and Parquet or CSV data feeds.
What location analytics shows for Benelux branches
Three steps, shown for a group of branches.

01
Trend for one branch
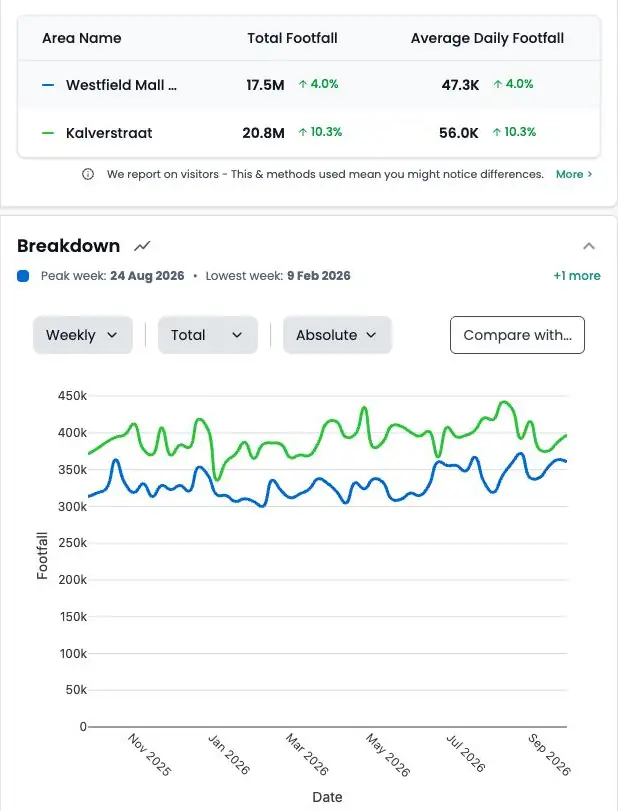
Weekly footfall for a single address, with the trend and change on last period. See at once if a fall is local or seen across the region.
02
Ranking in a Project
Put all branches in a Project. Sort them by footfall or change, track status and pick the sites that need attention.
03
Report and export
Share a monthly PDF report with KPIs, dayparts and catchment. Or export CSV and Excel files for your own models.
Location analytics for any Benelux address
How it works
Step 1
Tell us your locations
Add up to five addresses in the form. Your own stores, candidate sites or competitors.
Step 2
We run the analysis
Our team maps each location from observed visitor data.
Step 3
We walk you through it
A short call to take you through what the data shows and what it means for you.
Why Benelux analysts use Huq for location analytics
Who it's for
01
02
03
About Huq
Huq is a location intelligence company. We turn anonymised mobile location data into footfall, catchment and visitor insight for any place, so retailers, property owners and local authorities can make decisions on evidence.
See how your locations really perform
Up to 5 locations. No cost, no commitment.