
Tourism and visitor data
·
Tourism data for places across Australia and New Zealand
See how many people visit a destination, precinct or attraction, how many come from overseas, where domestic visitors travel from and how long they stay.
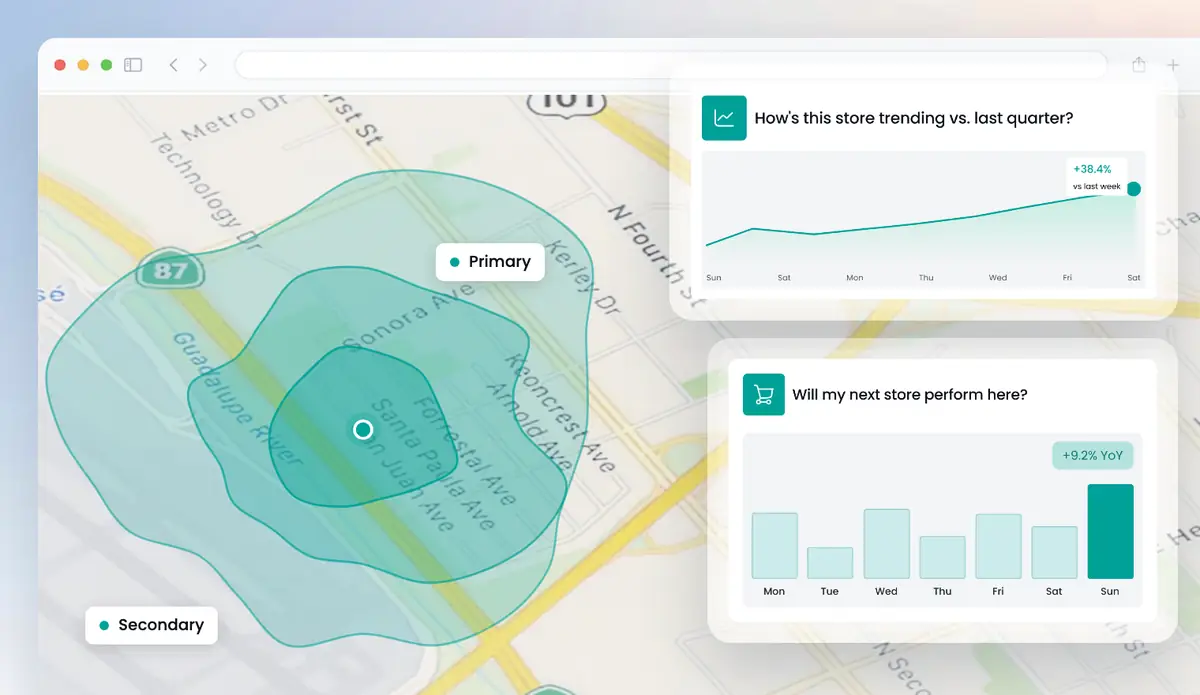
Get a free analysis of your locations
Up to 5 locations. No cost, no commitment.
Tourism data from Huq shows who visits a specific place and how they behave there. It complements official tourism statistics rather than replacing them. For any precinct, attraction, town or CBD in Australia and New Zealand, see weekly footfall, international visitation, residents vs visitors, dwell time and where domestic visitors travel from. Destination teams, councils, landlords and operators use it to measure seasons and events.
Tourism data on the Huq platform
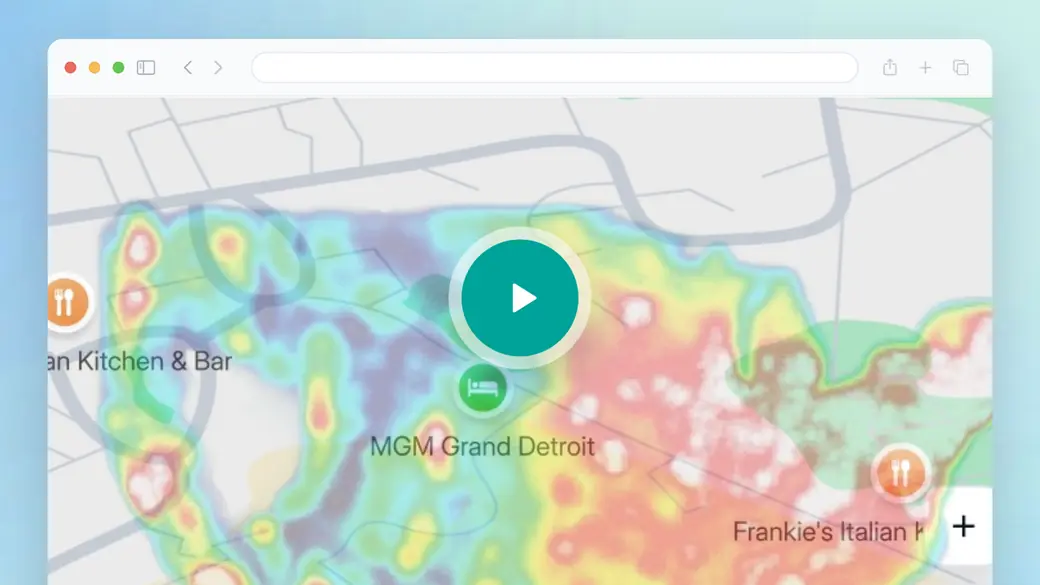
The overview is a general introduction to Huq, not a tourism case study. Think about the areas you'd draw as you watch: a waterfront, a ski town, a wine region's main street, a CBD precinct. For each one, look for international visitation and residents vs visitors. Those two measures show how a season or event changes who turns up.
- International visitation for any area you draw
- Residents vs visitors and dwell time
- Week-by-week footfall through seasons and events
Trusted by 300+ organisations · Data across 35 markets






What is tourism data?
In Australia and New Zealand, most tourism data comes from national surveys and official statistics: visitor numbers, nights, trip purpose and expenditure, reported at state, regional or national level and usually with a lag.
Huq adds place-level evidence. Instead of a regional estimate, you see a specific precinct, attraction or main street: weekly footfall, the share of international visitors, residents vs visitors, dwell time, dayparts and the postcodes domestic visitors travel from. It doesn't replace official statistics on nights or trip purpose.
That helps destination teams show what an event did for a town, helps local councils check whether a precinct programme is working against similar towns, helps landlords in tourist precincts plan for seasonal swings, and lets operators compare their location with others nearby. Accuracy is published by country: a 19.5% MAPE across published markets, against a 30% healthy threshold.
What's in your tourism data from Huq
01
International visitation
The share of visitors from overseas at a location, to track how inbound tourism changes over time.
02
Residents vs visitors
How much footfall comes from locals and how much from people travelling in.
03
Dwell and dayparts
How long visitors stay and when they arrive, by time of day and weekday versus weekend.
04
Domestic origin
The postcodes domestic visitors travel from, so marketing targets places that already send visitors.
What tourism data from Huq shows
Three views destination and place teams in Australia and New Zealand use to measure visitors.
01
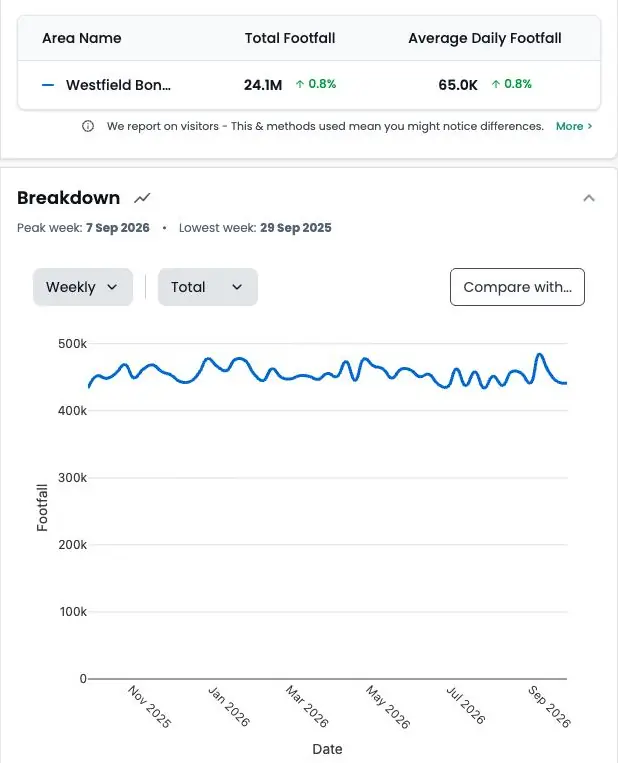
Seasonal footfall
Track weekly footfall across peak and shoulder seasons and compare years, so you can see whether a destination is growing or just shifting.
02
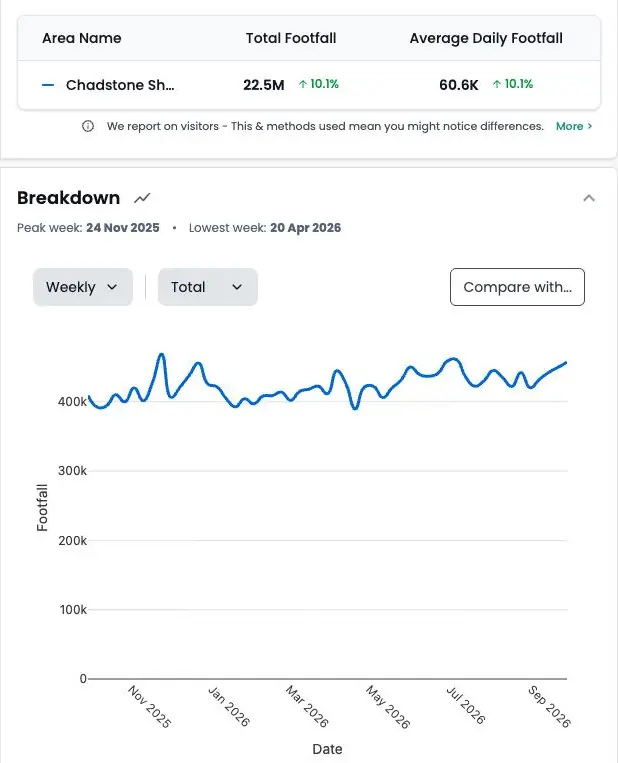
Event impact
Compare footfall, international visitation and dwell during an event with the weeks around it to show its effect on a town or precinct.
03
Where visitors come from
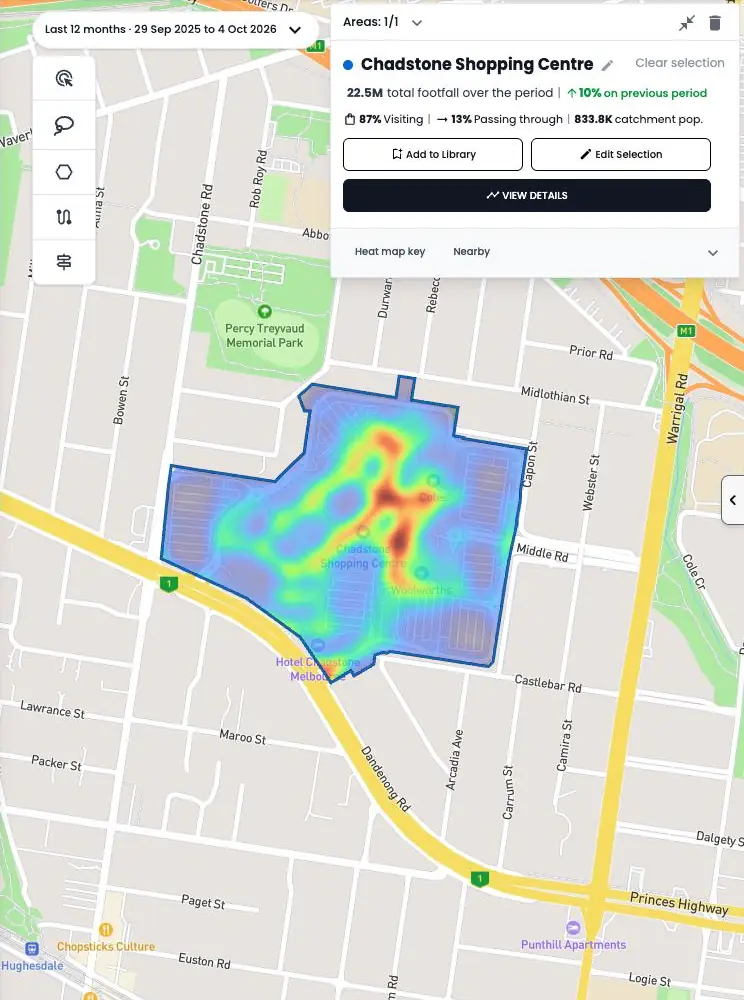
Map domestic visitors by postcode and split residents from visitors, to focus marketing and plan facilities.
Tourism data for any destination in ANZ
How it works
Step 1
Tell us your locations
Add up to five addresses in the form. Your own stores, candidate sites or competitors.
Step 2
We run the analysis
Our team maps each location from observed visitor data.
Step 3
We walk you through it
A short call to take you through what the data shows and what it means for you.
Why destination teams use Huq
Who it's for
01
02
03
About Huq
Huq is a location intelligence company. We turn anonymised mobile location data into footfall, catchment and visitor insight for any place, so retailers, property owners and local authorities can make decisions on evidence.
See how your locations really perform
Up to 5 locations. No cost, no commitment.