
ANZ foot traffic data
·
Foot traffic data for Australia and New Zealand
Weekly foot traffic for any address in Australia and New Zealand: shopping centres, CBD and strip retail. Exports and data feeds.
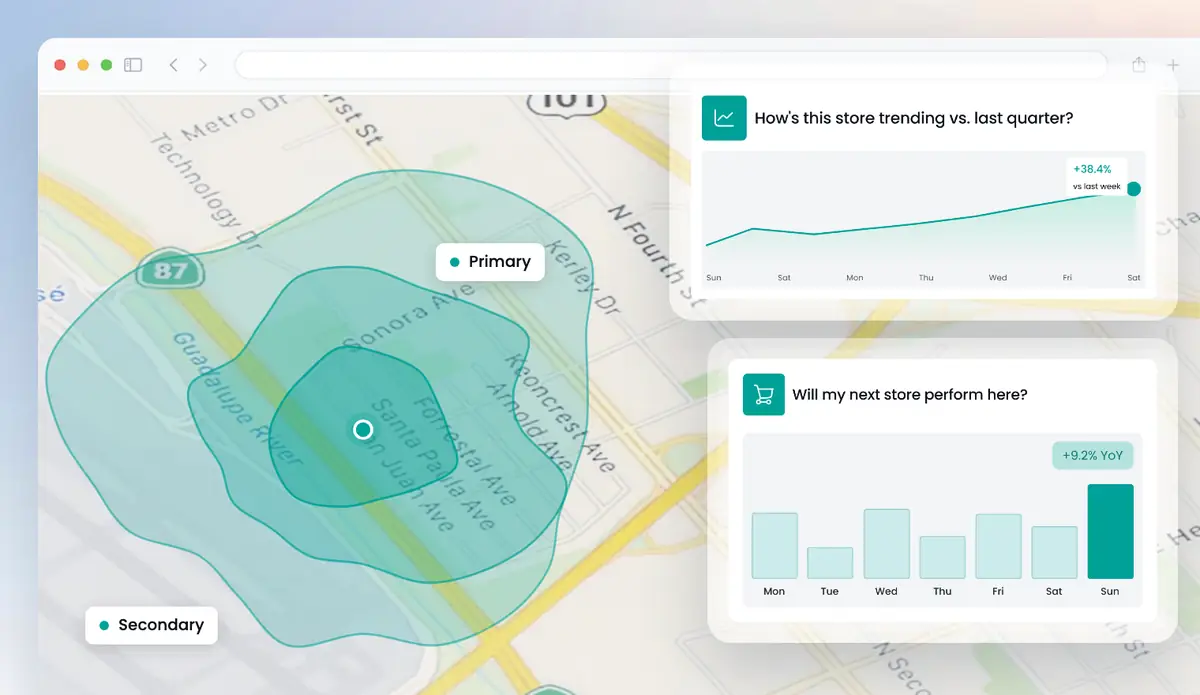
Get a free analysis of your locations
Up to 5 locations. No cost, no commitment.
Huq provides foot traffic data for any address in Australia and New Zealand, refreshed weekly. It covers shopping centres, CBD streets, strip retail and standalone stores, including competitors. You get visits by week, month and year, average daily foot traffic, visiting vs passing traffic, dwell time and visit frequency. Analysts download CSV or Excel files, and data teams take Parquet and CSV feeds into Amazon S3 or Google Cloud Storage.
How foot traffic data is laid out in Huq
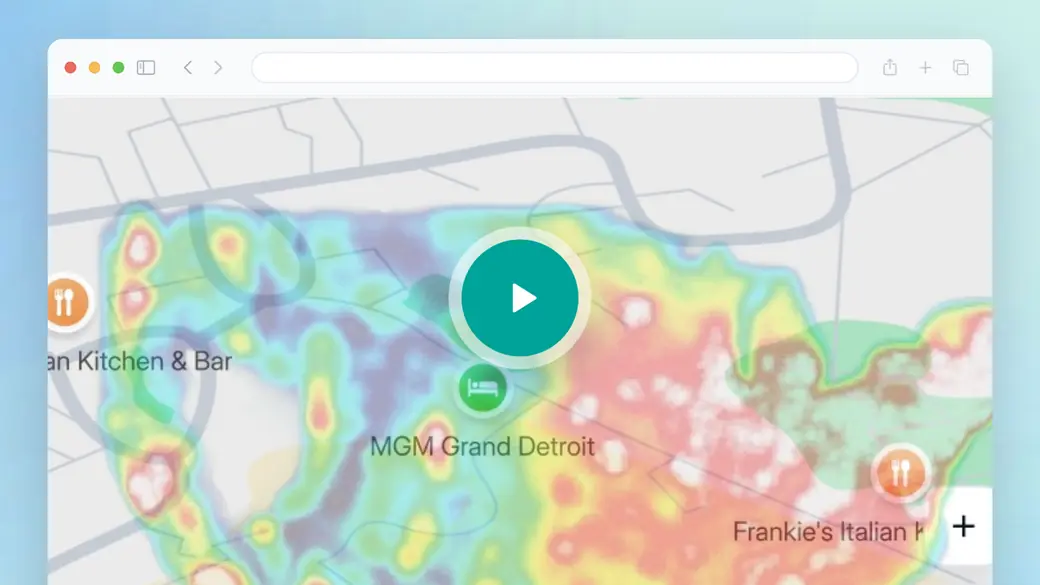
The overview walks through the whole platform. If you're buying data, focus on the Explore map, where you set the area for each site: a shopping centre, a CBD block or a strip you draw. Then look at the export options. The areas you save decide what lands in your CSV or Excel files, or in a weekly feed.
- Pick a shopping centre, a CBD block or any area you draw.
- See weekly foot traffic, visiting vs passing traffic and dwell time.
- Export per area or combined, or set up a data feed.
Trusted by 300+ organisations · Data across 35 markets






What is foot traffic data?
Foot traffic data, also called footfall, measures how many people visit or pass a place over time. In Australia and New Zealand it has mostly come from door counters in stores and shopping centres, and from pedestrian sensors that some councils run in their CBDs and publish as open data.
Those sources are accurate for the spot they watch. They can't tell you how a competitor's store, a centre in another state or a vacant tenancy is trading. Huq needs no hardware and covers any address, so all sites are measured on one basis.
Buyers are usually analysts, data teams and property researchers who want weekly numbers in their own models. Local councils also use it to check whether CBD and precinct programmes are working, against similar places. Huq publishes accuracy country by country against landlord-reported footfall. Across published markets the MAPE is 19.5%, under a 30% healthy threshold.
What's in your foot traffic data
01
Weekly, monthly and yearly visits
Totals, average daily foot traffic, trends and period-on-period change for every area.
02
Visiting vs passing traffic
Separate people who come into a location from those who only walk past.
03
Dwell, frequency and dayparts
How long people stay, how often they return and which hours are busiest.
04
Exports and data feeds
CSV or Excel exports, or Parquet and CSV files into Amazon S3 or Google Cloud Storage.
What foot traffic data shows
Three views data teams check before loading numbers into their own tools.
01
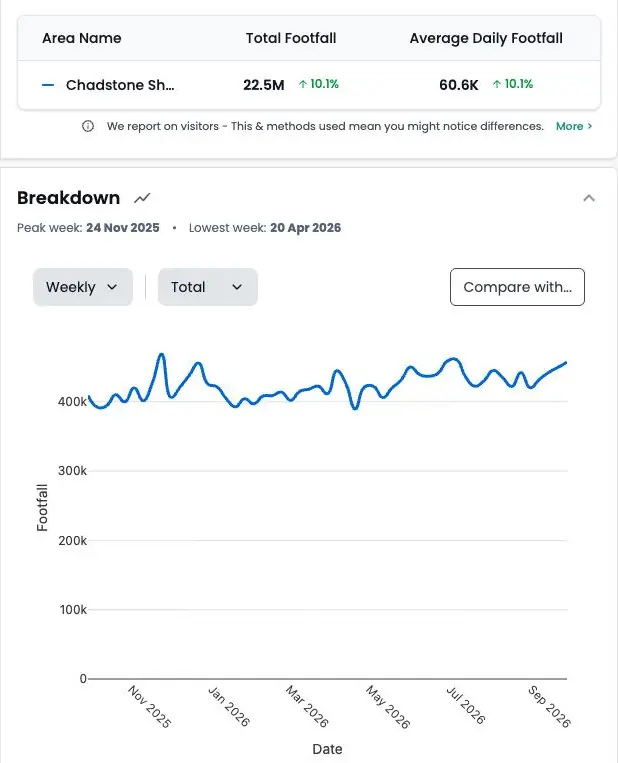
Weekly series for any area
Draw around a store, a strip or a whole shopping centre and see weekly visits with year-on-year change.
02
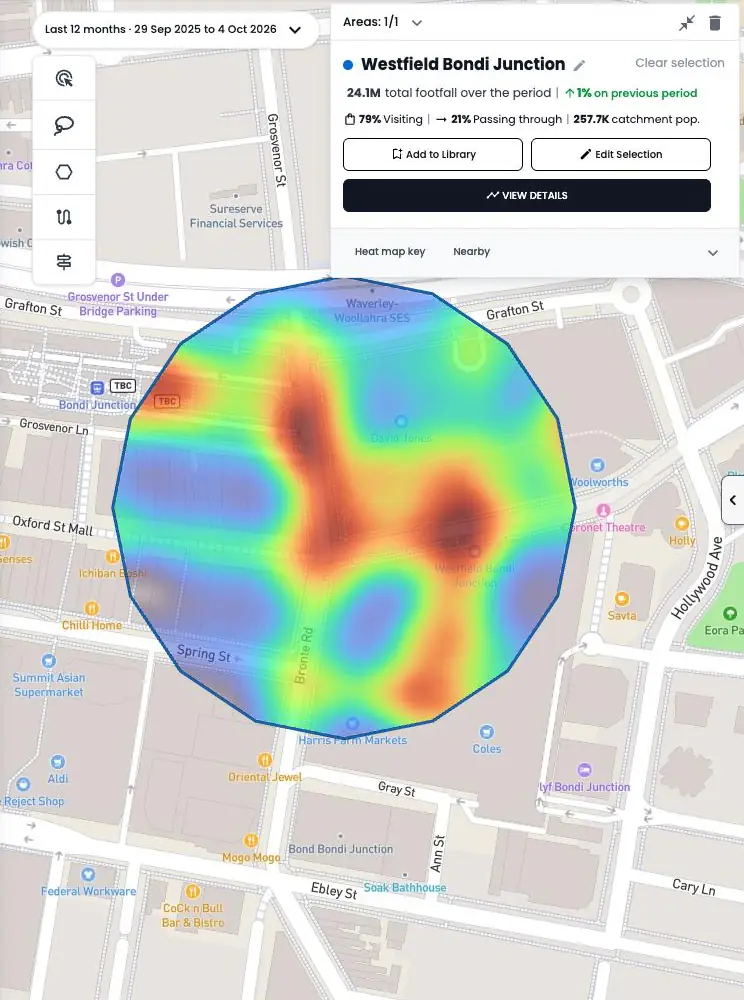
Visiting vs passing heat map
See where people stop and where they only pass through, across a CBD or a centre.
03
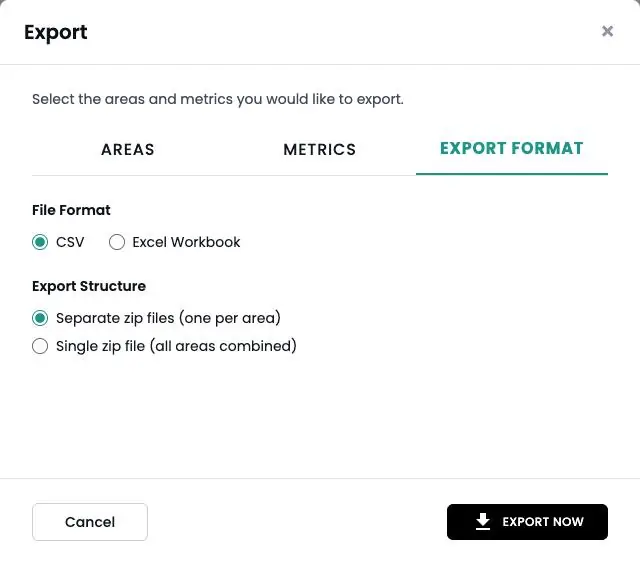
Exports and feed delivery
Pick areas and metrics, then download files or receive Parquet or CSV in your cloud bucket each week.
Foot traffic data coverage across Australia and New Zealand
How it works
Step 1
Tell us your locations
Add up to five addresses in the form. Your own stores, candidate sites or competitors.
Step 2
We run the analysis
Our team maps each location from observed visitor data.
Step 3
We walk you through it
A short call to take you through what the data shows and what it means for you.
Why data teams buy foot traffic data from Huq
Who it's for
01
02
03
About Huq
Huq is a location intelligence company. We turn anonymised mobile location data into footfall, catchment and visitor insight for any place, so retailers, property owners and local authorities can make decisions on evidence.
See how your locations really perform
Up to 5 locations. No cost, no commitment.