
Observed visitor behaviour for geodemographic work
·
Geodemographic segmentation, checked against real visits
Segments describe who lives in an area. Huq shows who actually visits a place in Australia and New Zealand, and how they behave when they get there.
Get a free analysis of your locations
Up to 5 locations. No cost, no commitment.
Geodemographic segmentation groups neighbourhoods by who lives there. Huq doesn't sell a segmentation; it shows what people actually do. For any shopping centre, CBD precinct or strip in Australia and New Zealand, see where visitors come from by postcode, the split between residents and visitors, how often they return and how long they stay. Use it to test whether the segments you target are the people who turn up.
Geodemographic segmentation meets observed visits
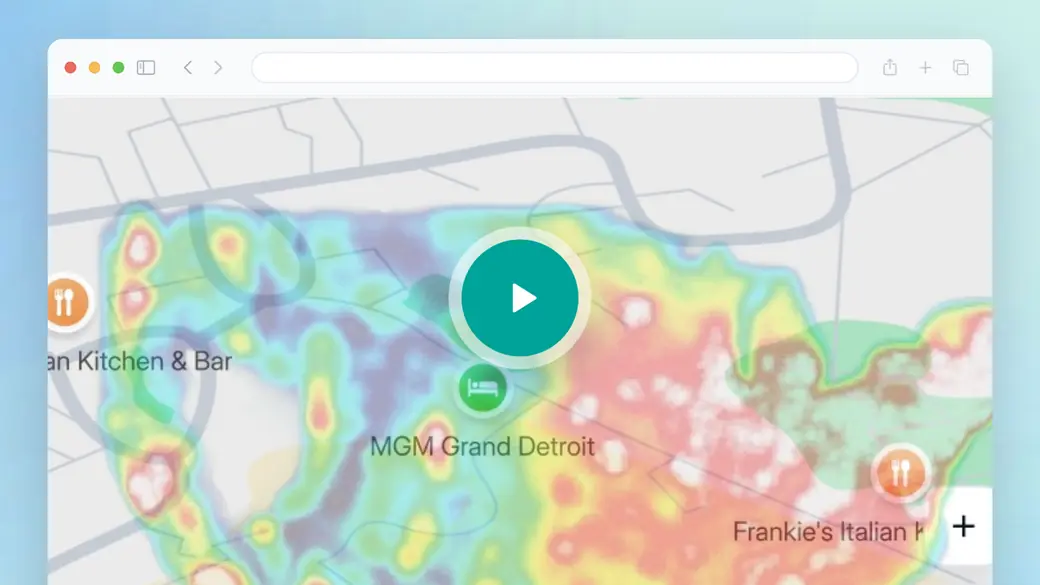
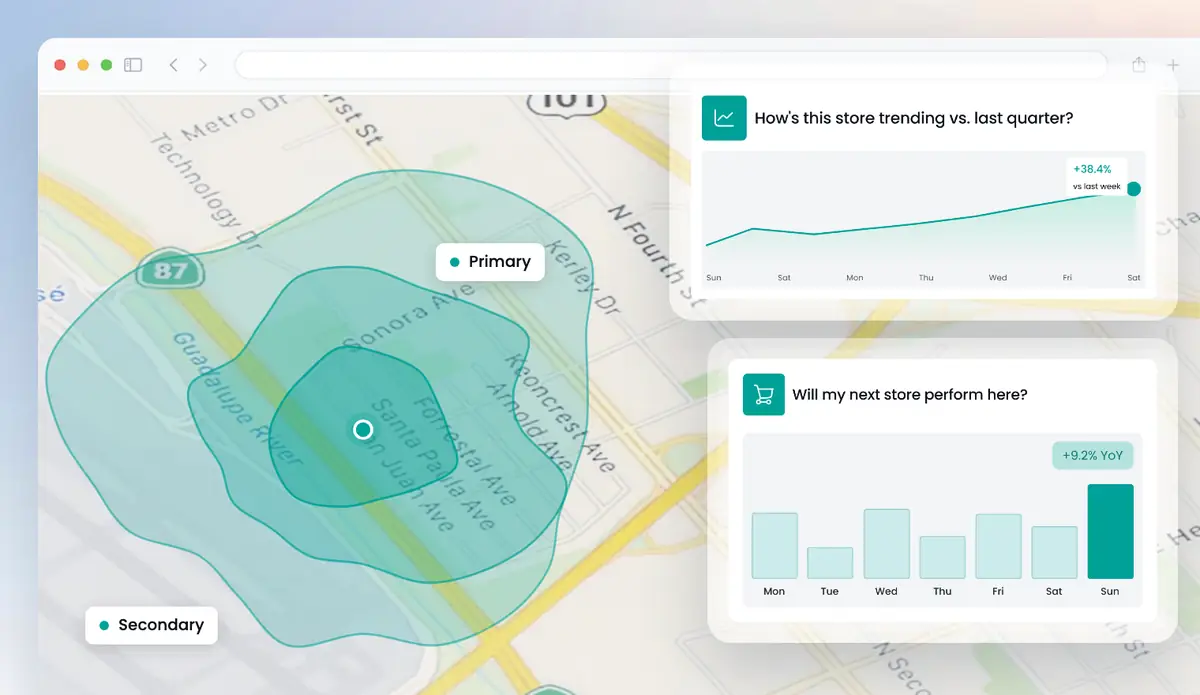
The overview doesn't cover segmentation; it shows how Huq works in general. The part to watch is catchment. Draw any area and Huq maps where its visitors come from by postcode. Those postcodes are the join between Huq and the segment codes you already use, so you can see which segments actually travel to a centre or strip.
- Catchment by postcode for any ANZ location
- Residents vs visitors for each place
- Visit frequency and dwell time by location
Trusted by 300+ organisations · Data across 35 markets






What is geodemographic segmentation?
Geodemographic segmentation classifies small areas into types based on census and other data, on the idea that people who live near each other tend to share traits. In Australia and New Zealand, marketers and planners use these classifications for targeting, site screening and media planning.
Huq doesn't sell a segmentation or a census-based classification. Huq measures observed behaviour at places: which postcodes send visitors to a site, how many are residents vs visitors, how often they come back and how long they stay. Demographics and profiling are available in selected markets; this page doesn't offer them for Australia or New Zealand.
Used together, the two answer different questions. Segmentation tells you who lives in a catchment; Huq's data tells you which parts of it actually show up, and how often. Huq's published accuracy: a 19.5% MAPE across published markets, against a 30% healthy threshold.
What's in your visit-based catchment view
01
Postcode catchment
Where a location's visitors live, mapped by postcode, ready to join to your segment codes.
02
Residents vs visitors
How much of a place's footfall is local and how much travels in, especially useful for CBD and tourist areas.
03
Frequency and dwell
How often visitors return and how long they stay, so you can weight segments by real engagement.
04
Travel-time areas
Drive-time and travel-time catchments in km, to compare a modelled trade area with observed visits.
What Huq adds to geodemographic segmentation
Three views that sit alongside a geodemographic classification in Australia and New Zealand.
01
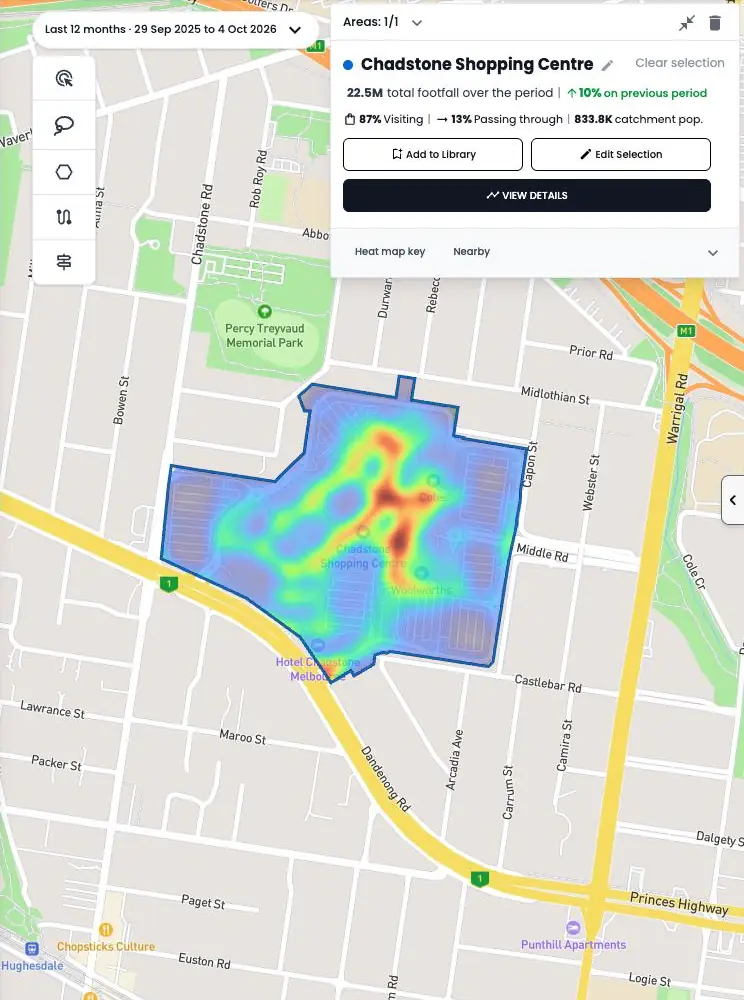
Catchment by postcode
Map the postcodes that send visitors to a centre or strip, then compare them with the segments in your classification.
02
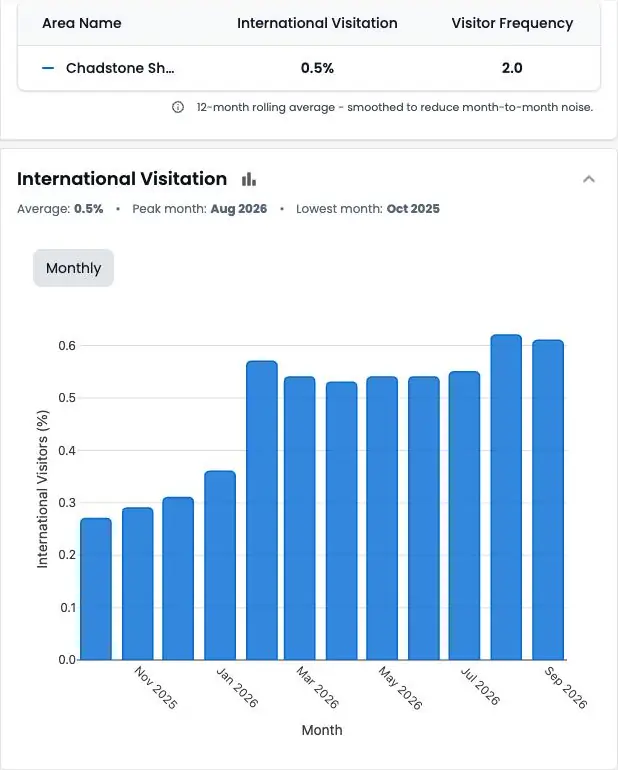
Local vs travelling visitors
See the share of residents and visitors for each location, which a segment map based on home address can't show.
03
Behaviour by site
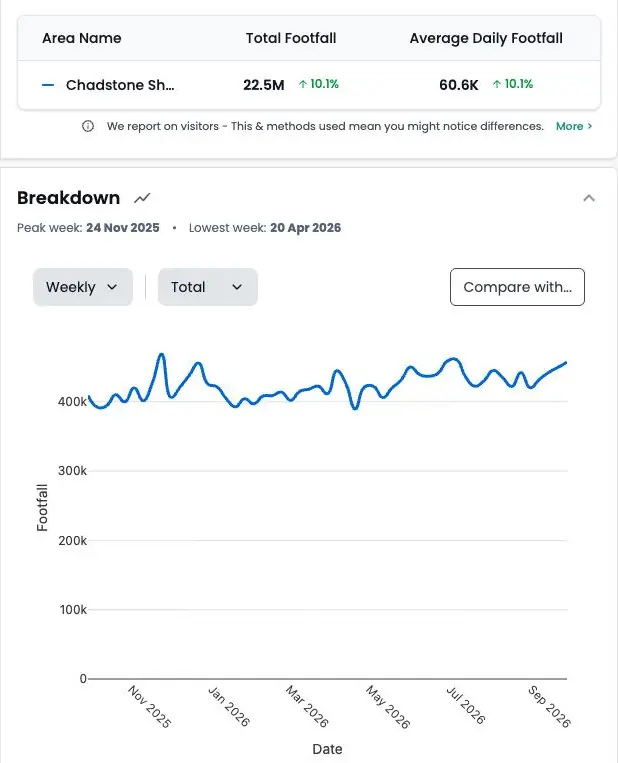
Compare visit frequency, dwell time and dayparts across your sites to see where target customers engage most.
Visit data for any place in Australia and New Zealand
How it works
Step 1
Tell us your locations
Add up to five addresses in the form. Your own stores, candidate sites or competitors.
Step 2
We run the analysis
Our team maps each location from observed visitor data.
Step 3
We walk you through it
A short call to take you through what the data shows and what it means for you.
Why teams pair Huq with geodemographic segmentation
Who it's for
01
02
03
About Huq
Huq is a location intelligence company. We turn anonymised mobile location data into footfall, catchment and visitor insight for any place, so retailers, property owners and local authorities can make decisions on evidence.
See how your locations really perform
Up to 5 locations. No cost, no commitment.