
Leasing evidence from visit data
·
Retail leasing data on footfall, catchment and tenant mix
Lease comps tell you what space let for. Huq gives ANZ landlords and agents the visit evidence behind a leasing pitch: footfall, catchment, tenant overlap.
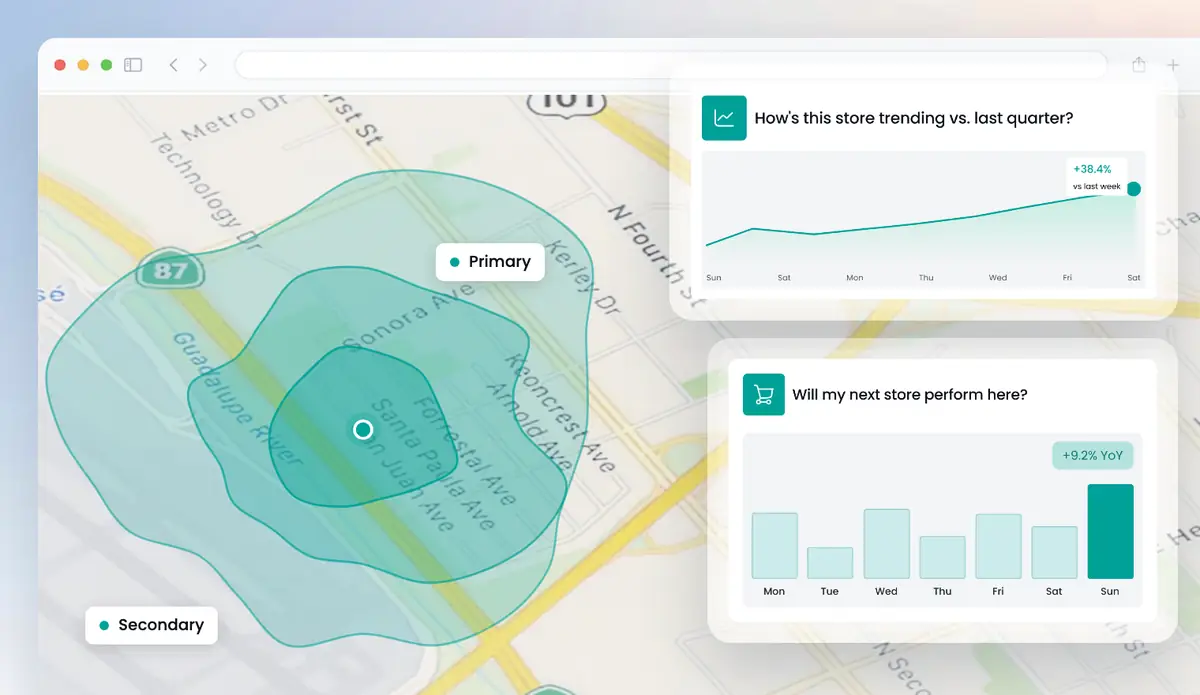
Get a free analysis of your locations
Up to 5 locations. No cost, no commitment.
Retail leasing data usually means rents and lease comps. Huq doesn't hold those; it adds the visit evidence that helps close a deal. For any shopping centre, unit or strip in Australia and New Zealand, see weekly footfall, where shoppers come from, how long they stay and which tenants share them. Landlords, leasing agents and asset managers use it to pitch vacancies, plan tenant mix and back renewals.
Retail leasing data for ANZ centres and strips
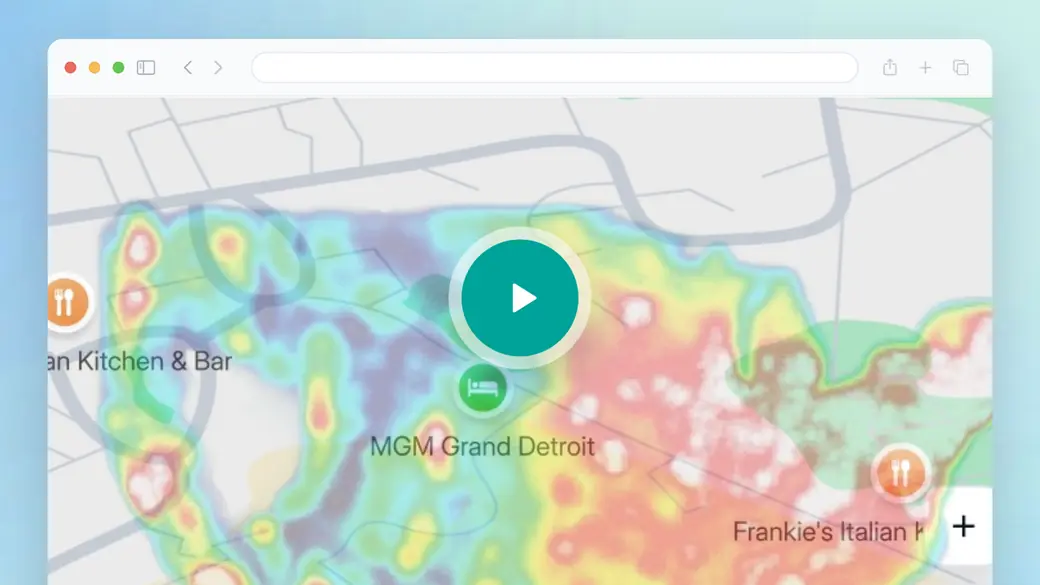
The overview walks through the platform in general, not a leasing pitch. As you watch, picture a vacant unit. You'd draw the centre or strip, read its footfall and visiting vs passing traffic, then open catchment and cross-visitation. That gives a prospective tenant two answers: who already comes past, and where else they shop.
- Footfall and visiting vs passing traffic for a unit or centre
- Catchment by postcode and travel time
- Tenant cross-visitation to plan the mix
Trusted by 300+ organisations · Data across 35 markets






What is retail leasing data?
In Australia and New Zealand, retail leasing data usually means lease transactions and comparables: face and effective rents, incentives, outgoings, lease terms and vacancy rates. Agencies, valuers and property databases collect it so both sides can price a deal.
Huq doesn't hold rents, incentives or lease terms. It supplies the other half of a leasing case: how a shopping centre or strip is actually used. That means weekly footfall, visiting vs passing traffic, catchment by postcode, dwell time and which tenants share customers.
Leasing teams use it to show a retailer the trade a location already has, to decide which category fills a gap in the mix, and to track how a new tenant changes traffic once it opens. Huq reports its accuracy by country, with a 19.5% MAPE across published markets, against a 30% healthy threshold.
What's in your retail leasing data from Huq
01
Centre and unit footfall
Weekly footfall, average daily footfall and trends for a whole centre, one part of a centre or a strip.
02
Visiting vs passing traffic
How many people stop at a location against how many pass by, to show a frontage's real exposure.
03
Catchment for the pitch
Where shoppers live by postcode and travel time, matched to the customer a retailer wants to reach.
04
Tenant mix evidence
Cross-visitation between up to 10 location pairs, showing which tenants share shoppers and where gaps sit.
What retail leasing data from Huq shows
Three views ANZ leasing teams use when they pitch space and plan the mix.
01
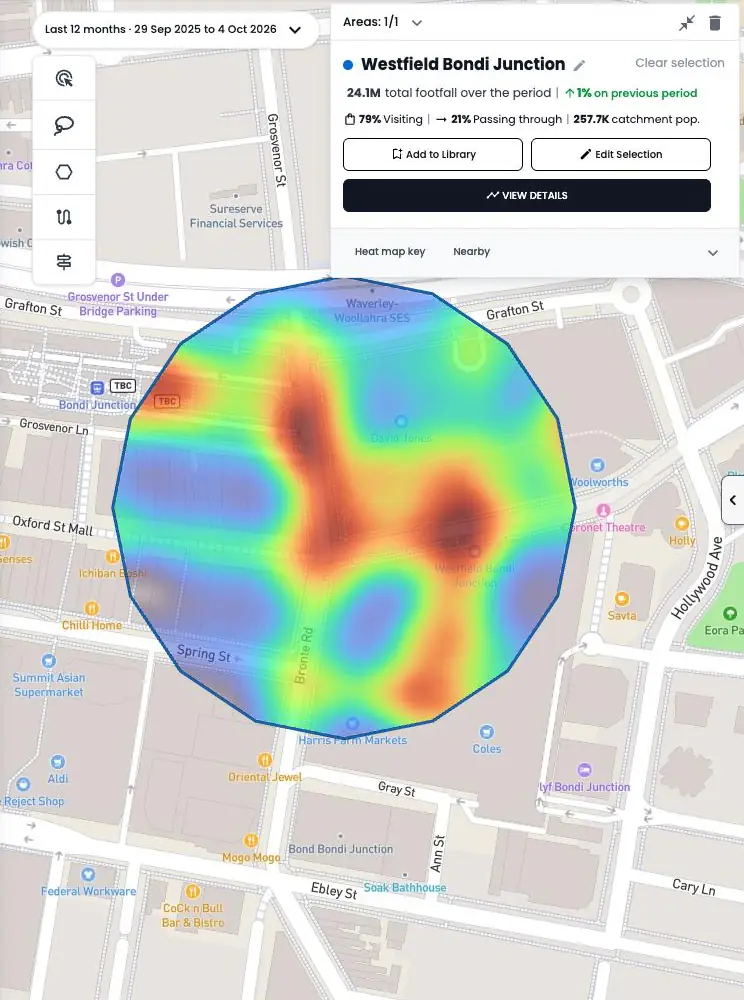
Vacancy pitch
Show a prospective tenant the footfall, dwell and catchment around a vacant unit, compared with nearby centres and regional benchmarks.
02
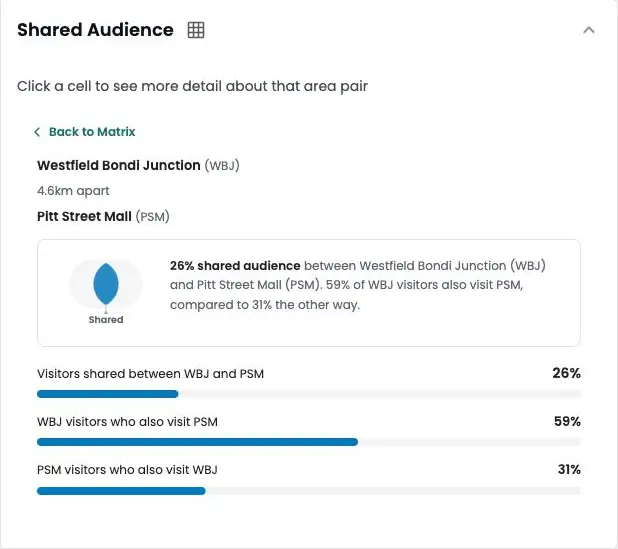
Tenant overlap
See which tenants and nearby brands share shoppers, to choose categories that add trips rather than split them.
03
Before and after a letting
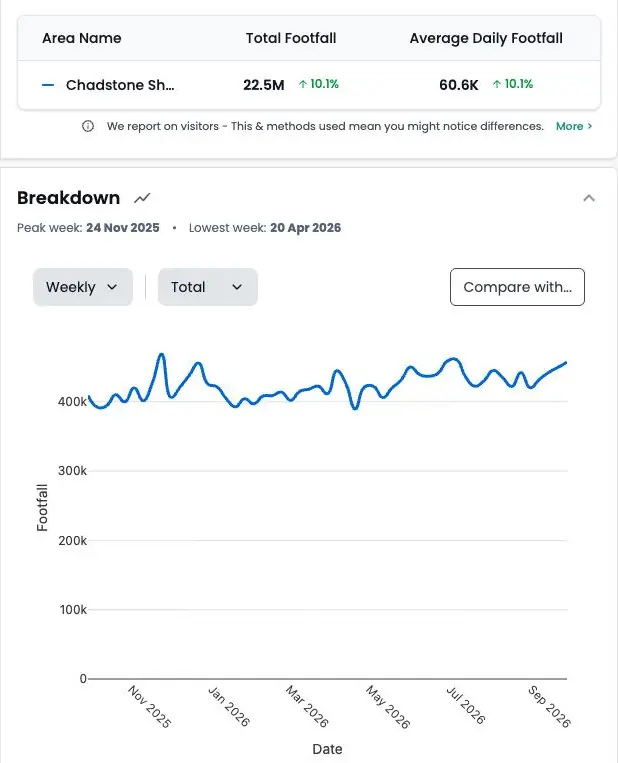
Track weekly footfall after a new tenant opens to show its effect on the centre, useful at renewal and in investor reporting.
Retail leasing data across Australia and New Zealand
How it works
Step 1
Tell us your locations
Add up to five addresses in the form. Your own stores, candidate sites or competitors.
Step 2
We run the analysis
Our team maps each location from observed visitor data.
Step 3
We walk you through it
A short call to take you through what the data shows and what it means for you.
Why leasing teams in ANZ use Huq
Who it's for
01
02
03
About Huq
Huq is a location intelligence company. We turn anonymised mobile location data into footfall, catchment and visitor insight for any place, so retailers, property owners and local authorities can make decisions on evidence.
See how your locations really perform
Up to 5 locations. No cost, no commitment.