
Commercial property performance data
·
Commercial property data on how ANZ retail assets perform
Listings and comps tell you what a property costs. Huq shows how retail property in Australia and New Zealand is actually visited, week by week.
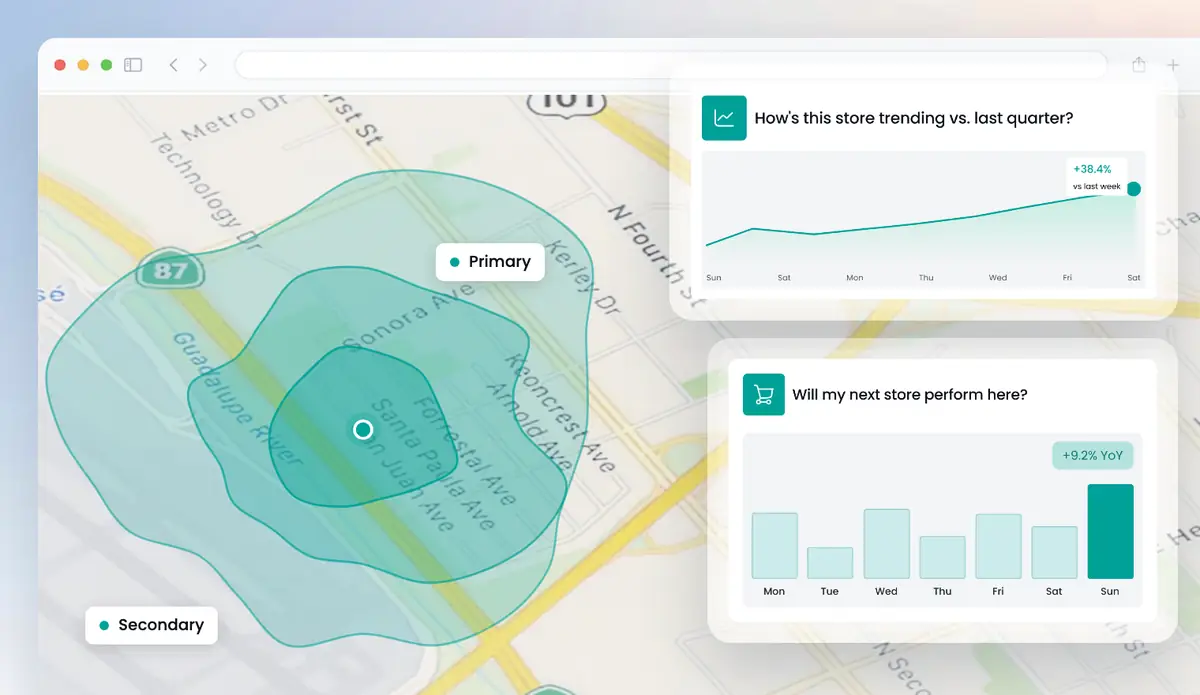
Get a free analysis of your locations
Up to 5 locations. No cost, no commitment.
Huq's commercial property data covers what listings and sales comps leave out. It holds no rents, titles or sales history; it shows how retail property is actually used. For any shopping centre, CBD block or strip retail address in Australia and New Zealand, see footfall, catchment, dwell time and which tenants share customers. Landlords, asset managers, agents and investors use it to back valuations, leasing pitches and acquisitions.
See commercial property data for any ANZ retail asset
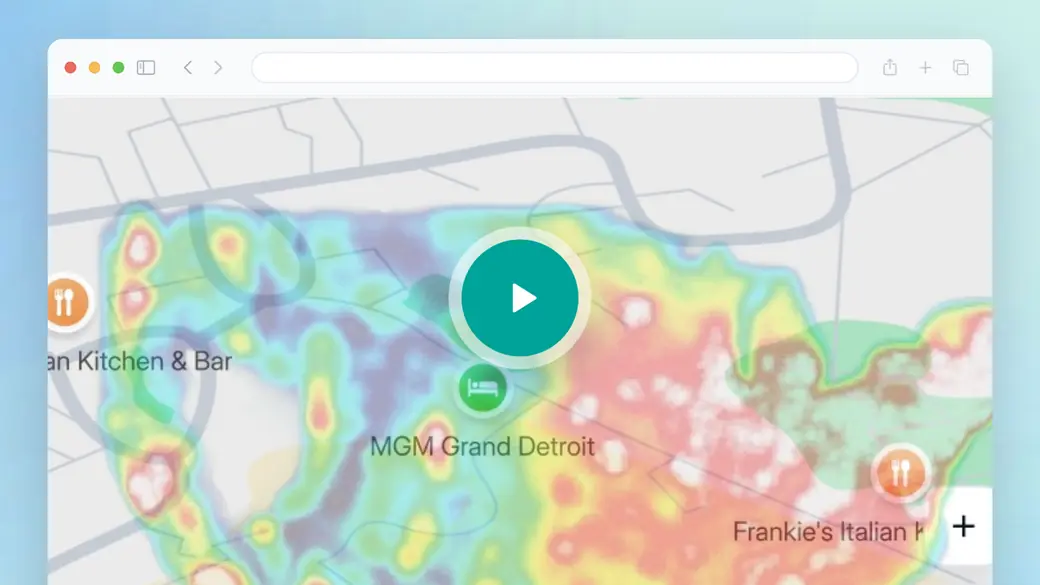
Huq's platform overview isn't a valuation demo, so watch for the building blocks an asset team would use. The Explore map lets you draw around a centre or strip. Weekly footfall, postcode catchment and dwell time then sit side by side. Picture the same steps for an asset you own, one you're bidding on, or the competing centre down the road.
- Draw any centre, precinct or strip and get weekly footfall
- Catchment by postcode and travel time for the asset
- Dwell time and cross-visitation between tenants
Trusted by 300+ organisations · Data across 35 markets






What is commercial property data?
In Australia and New Zealand, commercial property data usually means sales and leasing records, ownership, valuations and listings: the information held in property databases and agency research. It tells you what a building is, who owns it and what it sold or leased for.
Huq isn't that kind of database. It doesn't hold titles, rents or sales comps. Huq is the performance layer for retail property: how often a centre, CBD block or strip is visited, where its visitors come from, how long they stay and which other places they also visit.
Put the two together and a valuation or leasing case rests on more than price history. An asset manager can show a centre's footfall rising against its region; an investor can test whether a strip's catchment supports the deal. Huq publishes a 19.5% MAPE across published markets, against a 30% healthy threshold.
What's in your commercial property data from Huq
01
Weekly asset footfall
Totals, average daily footfall and period-on-period change for any centre, CBD building or strip retail address.
02
Catchment by postcode
Where an asset's visitors live, plus drive-time and travel-time areas, to test the trade area behind a valuation.
03
Dwell time and frequency
How long people stay and how often they return, compared across centres or against your own portfolio.
04
Tenant cross-visitation
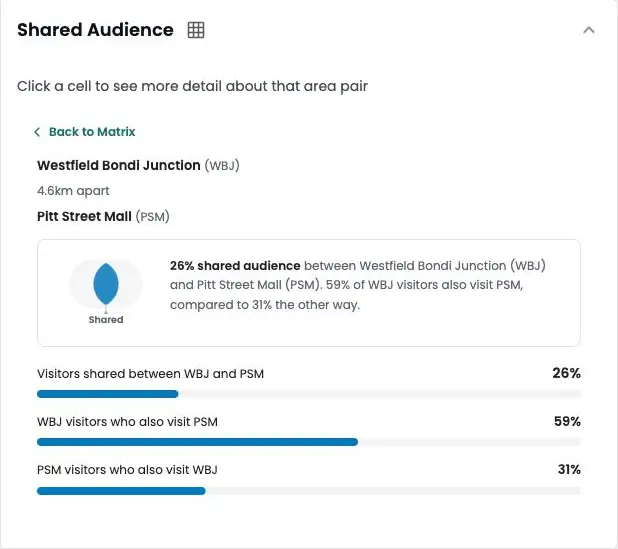
Shared audience between up to 10 location pairs, showing which tenants and nearby centres draw the same customers.
What commercial property data from Huq shows
Three views asset teams use most when they assess retail property in Australia and New Zealand.
01
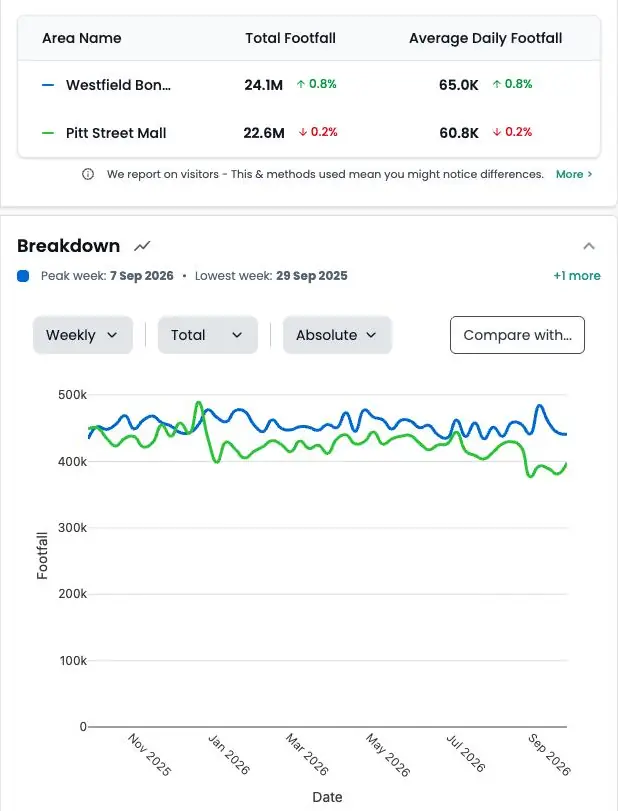
Centre footfall against the region
Track an asset's weekly footfall and compare it with nearby centres and regional benchmarks, so you can tell whether performance comes from the asset or the market.
02
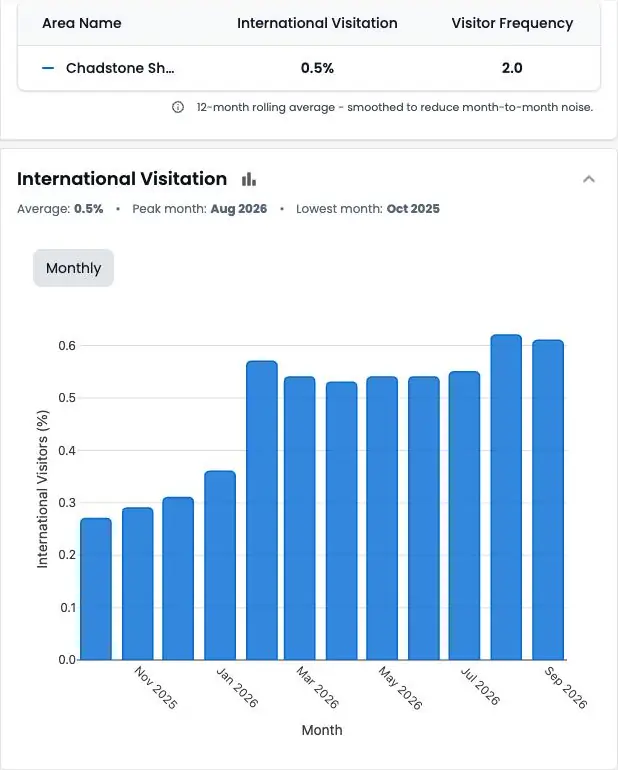
Catchment, residents and visitors
Map where visitors come from by postcode and split residents from visitors, useful for CBD assets and tourist precincts alike.
03
Tenant overlap and dwell
See which tenants share customers and how long they stay, to support remixing, anchor decisions and leasing conversations.
Commercial property data across Australia and New Zealand
How it works
Step 1
Tell us your locations
Add up to five addresses in the form. Your own stores, candidate sites or competitors.
Step 2
We run the analysis
Our team maps each location from observed visitor data.
Step 3
We walk you through it
A short call to take you through what the data shows and what it means for you.
Why property teams use Huq for commercial real estate data
Who it's for
01
02
03
About Huq
Huq is a location intelligence company. We turn anonymised mobile location data into footfall, catchment and visitor insight for any place, so retailers, property owners and local authorities can make decisions on evidence.
See how your locations really perform
Up to 5 locations. No cost, no commitment.