
Catchment analysis
·
Catchment analysis for Australian and NZ retail sites
Measure where shoppers come from by postcode, set travel-time bands in km or minutes, and compare shopping centre, CBD and strip retail catchments.
Get a free analysis of your locations
Up to 5 locations. No cost, no commitment.
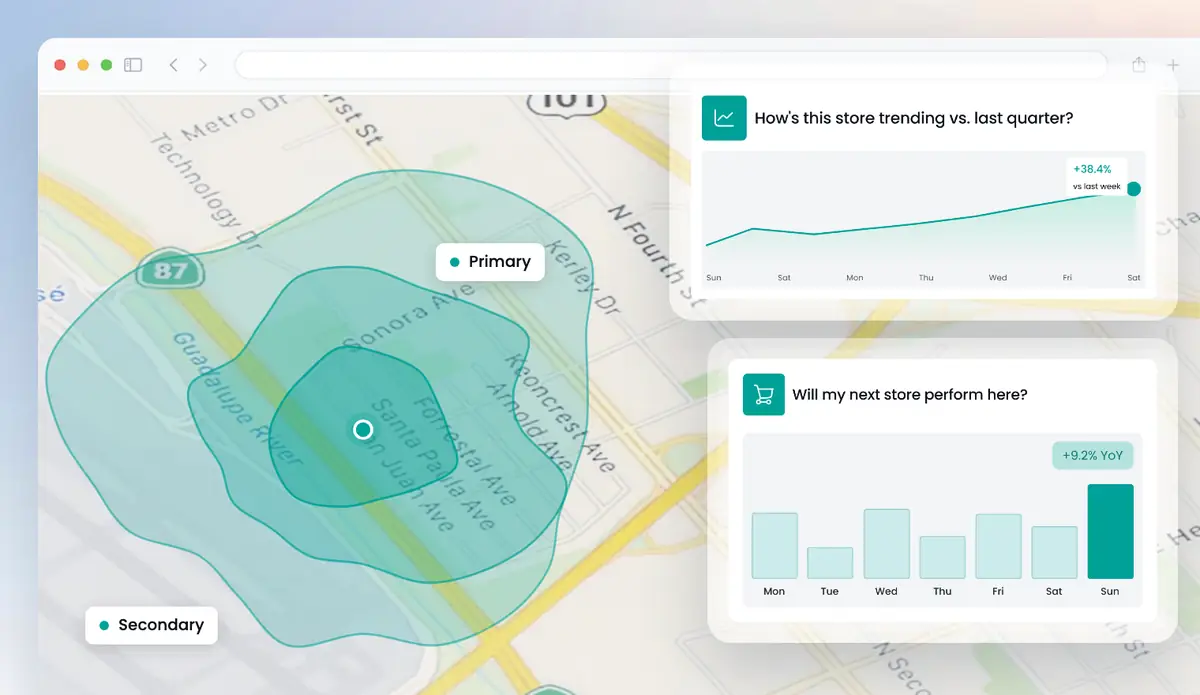
Huq's catchment analysis shows which postcodes send shoppers to any store or site in Australia or New Zealand. Put a shopping centre tenancy, a CBD store and a strip retail site side by side, set drive-time and travel-time bands, and separate residents from visitors. It works on competitors' stores and vacant tenancies too. Huq reports a 19.5% MAPE across published markets, against a 30% healthy threshold.
Building a catchment analysis in Huq
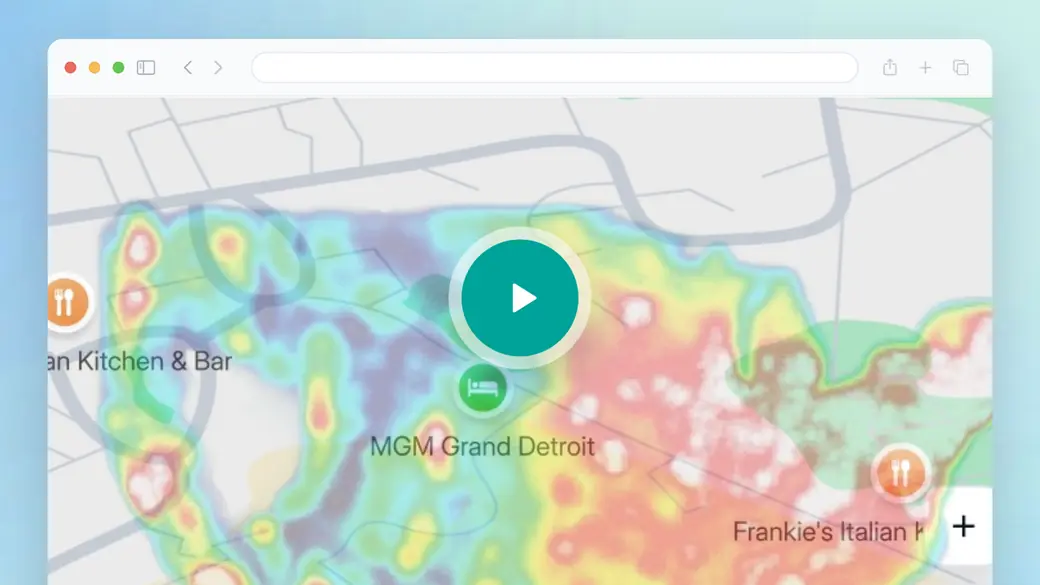
The overview covers the whole Huq platform, not a catchment walkthrough. Watch the Explore map section: the catchment, travel-time and postcode layers listed there are what you would use to build a catchment around a regional centre or a CBD store. Note too how several locations can sit in one Project. That is how you would keep sites hundreds of km apart on the same weekly view.
- Turning on the postcode and catchment layers around a site
- Adding travel-time bands for metro and regional locations
- Grouping sites in a Project to compare them over time
Trusted by 300+ organisations · Data across 35 markets






What is catchment analysis in retail?
Catchment analysis defines the area a store or shopping centre draws its customers from. In Australia and New Zealand the term covers both a retailer checking a single site and a centre owner describing its main and secondary trade areas to prospective tenants.
Distances make it harder than it looks. A regional centre can pull shoppers from towns well beyond any sensible radius, while a CBD store draws office workers and tourists who live nowhere near it. A drive-time polygon treats all of them the same way. Huq starts from visits instead, so you see the postcodes that really send people, and how many visitors are residents versus people from further afield.
Retailers use the result to size new sites and check overlap between their own stores. Leasing teams use it to back tenancy conversations with evidence. In the UK, JD Sports got 25% more precise catchment analysis and 18% lower new-store location risk with Huq.
What's in your catchment analysis
01
Visitor postcodes
See which postcodes send the most foot traffic to a store, a competitor or a vacant tenancy.
02
Travel-time bands in km
Draw drive-time and travel-time bands and compare them with where visitors really come from.
03
Residents and visitors
Separate locals from visitors, which matters for CBD, coastal and tourist-heavy locations.
04
Overlap between stores
Cross-visitation between up to 10 location pairs shows how many visitors two of your stores share.
What a catchment analysis shows
Three views do most of the work when you build a catchment in Huq.

01
Visitor origins by postcode
Switch on the catchment layer on the Explore map to see which postcodes send visitors to the site, from nearby suburbs to regional towns.
02
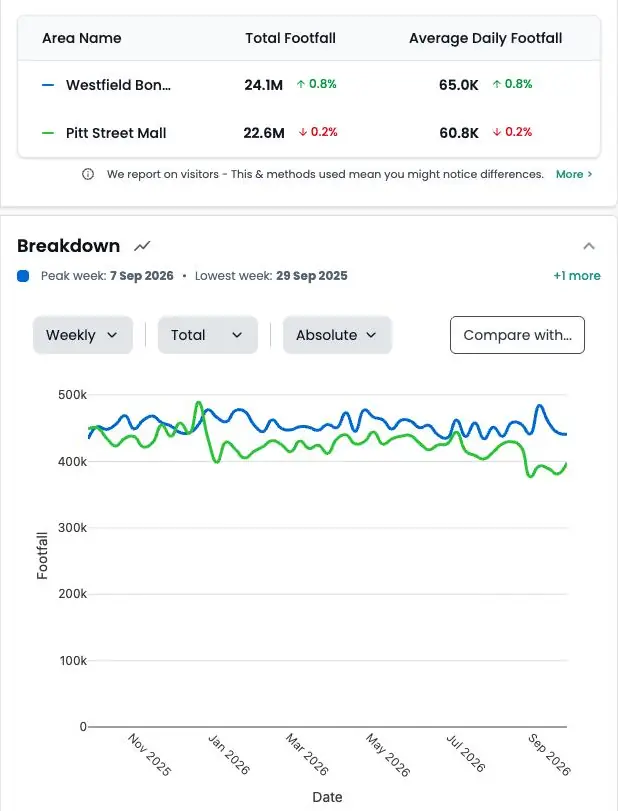
Catchment versus travel time
Overlay travel-time bands to see how much of the measured catchment falls inside them and how far the long tail reaches.
03
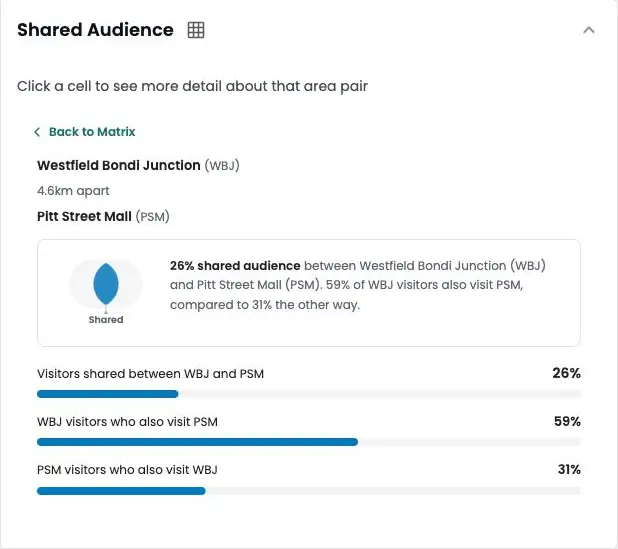
Shared catchment between sites
Cross-visitation shows how many visitors two locations have in common, a quick check before you add a store near an existing one.
Catchment analysis across Australia and New Zealand
How it works
Step 1
Tell us your locations
Add up to five addresses in the form. Your own stores, candidate sites or competitors.
Step 2
We run the analysis
Our team maps each location from observed visitor data.
Step 3
We walk you through it
A short call to take you through what the data shows and what it means for you.
Why ANZ retailers use Huq for catchment analysis
Who it's for
01
02
03
About Huq
Huq is a location intelligence company. We turn anonymised mobile location data into footfall, catchment and visitor insight for any place, so retailers, property owners and local authorities can make decisions on evidence.
See how your locations really perform
Up to 5 locations. No cost, no commitment.