
Location data
·
Location data for Australian and New Zealand places
Weekly foot traffic, catchment and place data for shopping centres, CBD and strip retail. Use the platform or take Parquet and CSV feeds.
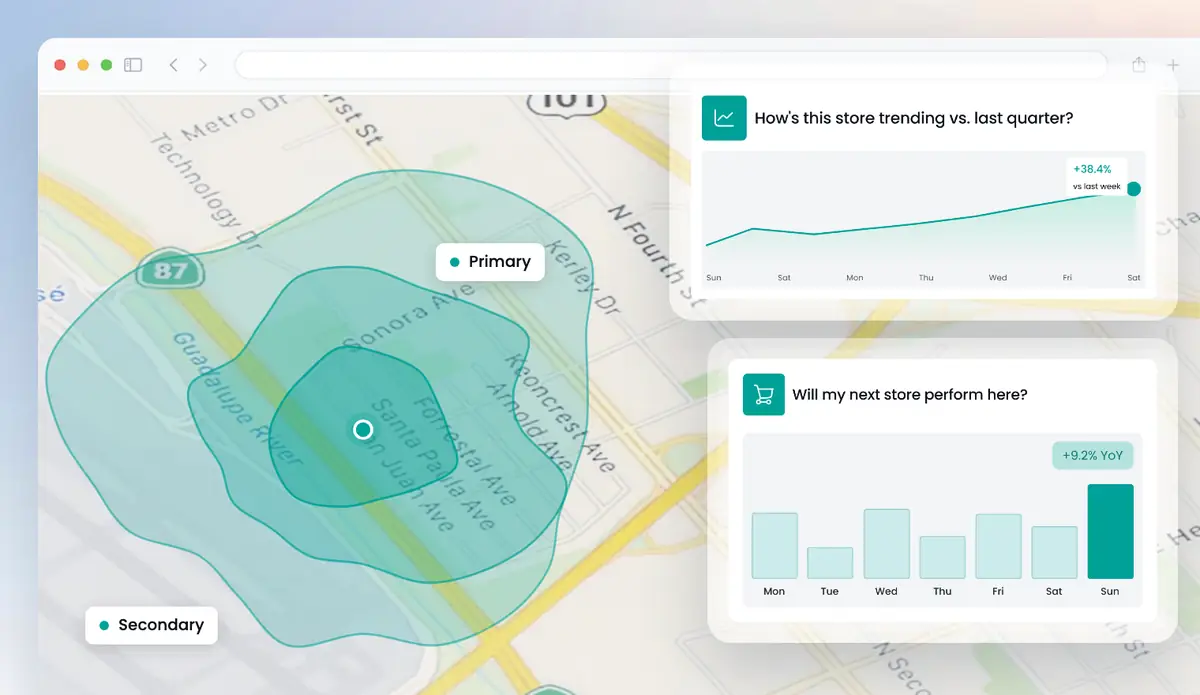
Get a free analysis of your locations
Up to 5 locations. No cost, no commitment.
Huq's location data shows how people use any place in Australia and New Zealand, from a CBD tenancy to a regional shopping centre or a strip of shops. You get foot traffic by week, month and year, residents and visitors, catchment by postcode, dwell time and visit frequency. Data teams take Parquet or CSV feeds into Amazon S3 or Google Cloud Storage. Commercial teams use the map and exports. Everything refreshes weekly.
See how Huq delivers location data
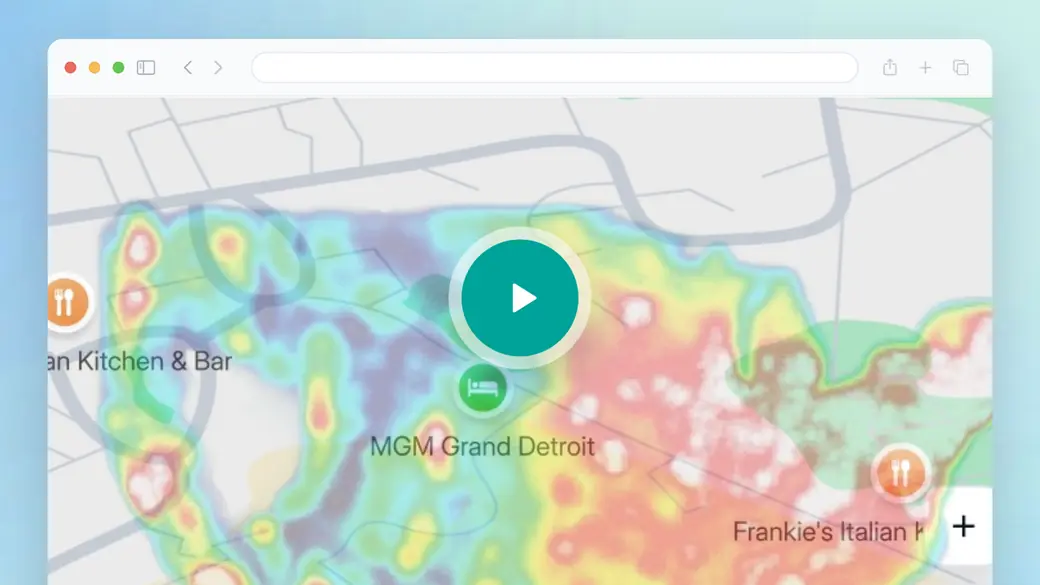
Look at how a site is picked on the Explore map, then which foot traffic, catchment and visitor measures appear for it. Now picture the same fields for your whole ANZ site list, arriving in your cloud bucket every week. The platform is for checking a site; the feed is for scaling to many.
- Picking a site or drawing an area on the Explore map.
- Foot traffic trends, residents and visitors, and catchment for that place.
- Exports that match the fields in the weekly data feed.
Trusted by 300+ organisations · Data across 35 markets






What is location data, and who buys it in ANZ?
Location data is information about where people go and how they use places. Most explainers stop at maps and coordinates. For a business, the useful part is the measure: how much foot traffic a site gets, when, and from which postcodes.
In Australia and New Zealand, buyers include retail chains planning stores across large distances, shopping centre owners and managers reporting to investors, councils looking after CBDs and strip retail, and funds checking assets. Many already hold census and property data. Location data from Huq adds what those sources cannot: how places actually perform week by week.
Huq publishes its accuracy as MAPE against landlord-reported footfall. Across published markets the median is 19.5%, against a 30% healthy threshold. Sample sizes are in Huq's downloadable validation report.
What's in your ANZ location data
01
Foot traffic over time
Weekly, monthly and yearly totals, average daily footfall, trends and visiting versus passing traffic.
02
Residents, visitors and catchment
Local residents versus people travelling in, with catchment by postcode and drive-time areas.
03
Places and centre types
Points of interest, brand locations, industries, and shopping centre and retail centre types.
04
Weekly data feeds
Parquet and CSV files into Amazon S3 or Google Cloud Storage, plus CSV or Excel exports.
What ANZ location data shows
Three views your team will use most.
01
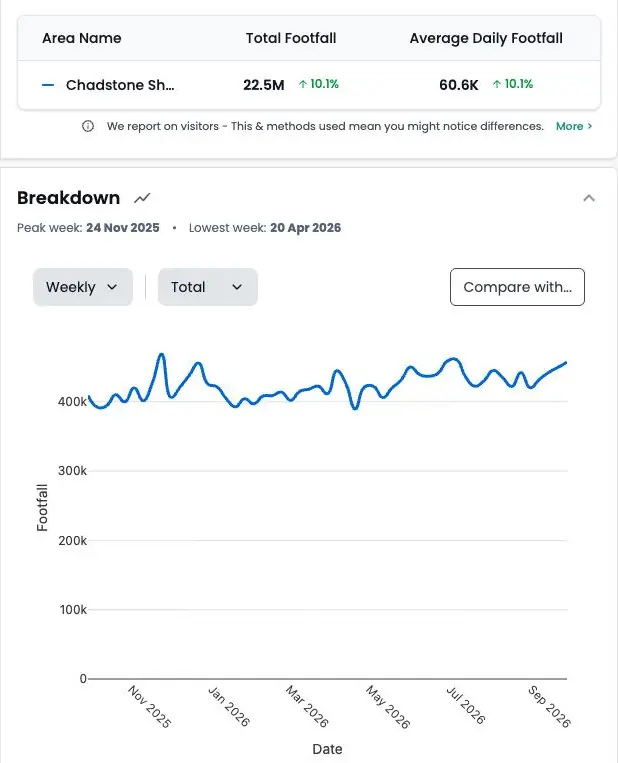
Foot traffic for a centre
Weekly foot traffic for a shopping centre or CBD block, with trend and period-on-period change.
02
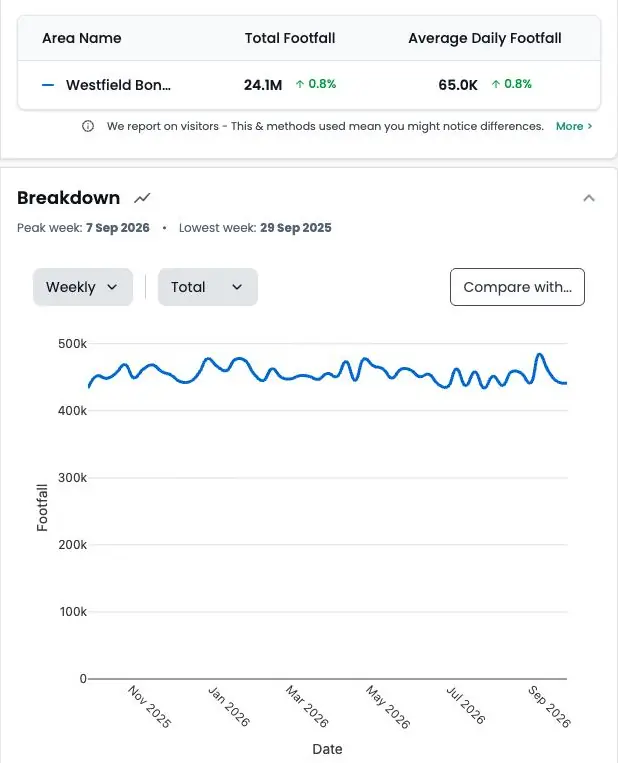
Catchment by postcode
Where visitors come from, by postcode and drive time in km. Useful where catchments stretch further than in denser markets.
03
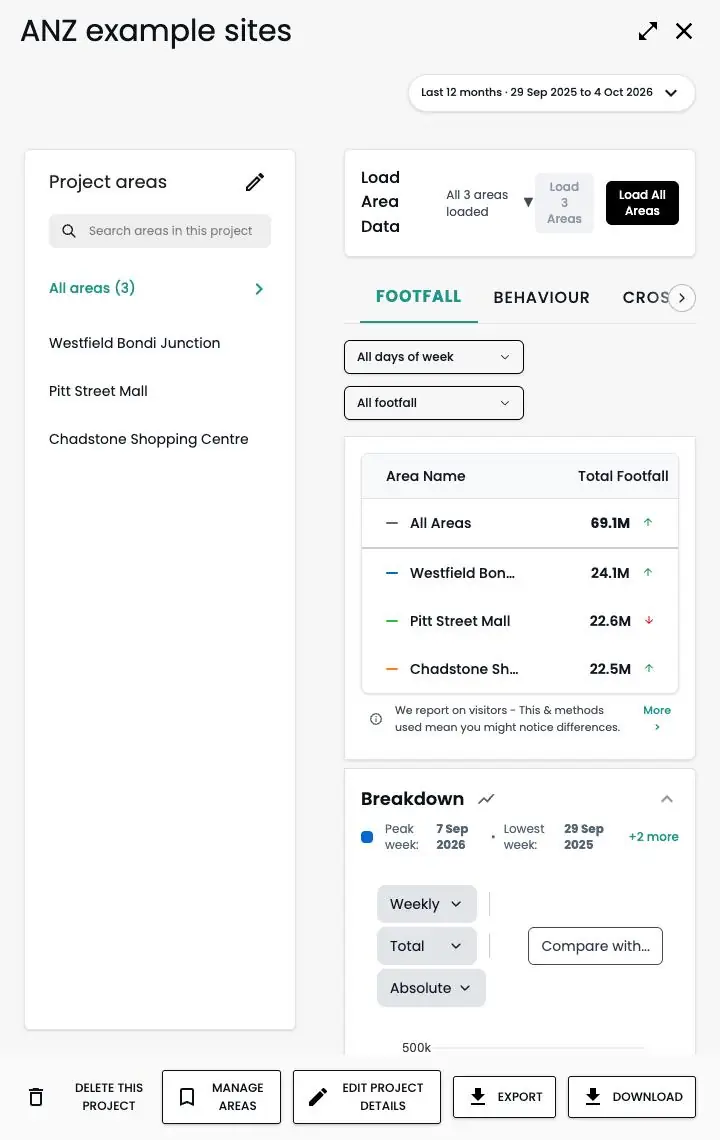
Your network in Projects
Track every site in one folder, report to stakeholders, and export the list as CSV or Excel.
Location data coverage across Australia and New Zealand
How it works
Step 1
Tell us your locations
Add up to five addresses in the form. Your own stores, candidate sites or competitors.
Step 2
We run the analysis
Our team maps each location from observed visitor data.
Step 3
We walk you through it
A short call to take you through what the data shows and what it means for you.
Why ANZ teams use Huq for location data
Who it's for
01
02
03
About Huq
Huq is a location intelligence company. We turn anonymised mobile location data into footfall, catchment and visitor insight for any place, so retailers, property owners and local authorities can make decisions on evidence.
See how your locations really perform
Up to 5 locations. No cost, no commitment.