
Location analytics software
·
Location analytics software for Australia and New Zealand
Measure and compare foot traffic, catchment and behaviour across ANZ sites. Weekly data, with exports, PDF reports and data feeds.
Get a free analysis of your locations
Up to 5 locations. No cost, no commitment.
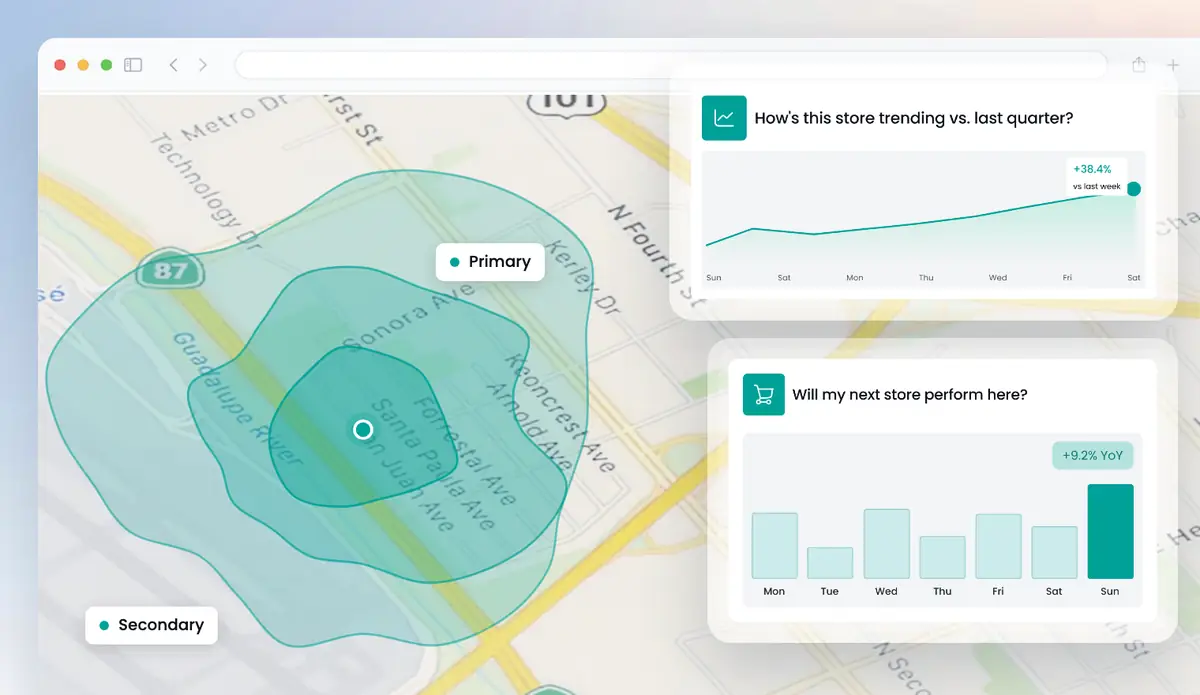
Huq is location analytics software for teams comparing stores, shopping centres and strip retail across Australia and New Zealand. Add one address or a national network. Track foot traffic trends, dwell time and dayparts, then rank sites against regional and national benchmarks. Results export to CSV or Excel, go out as monthly PDF reports, or arrive as weekly data feeds for your analysts.
Location analytics across a national network
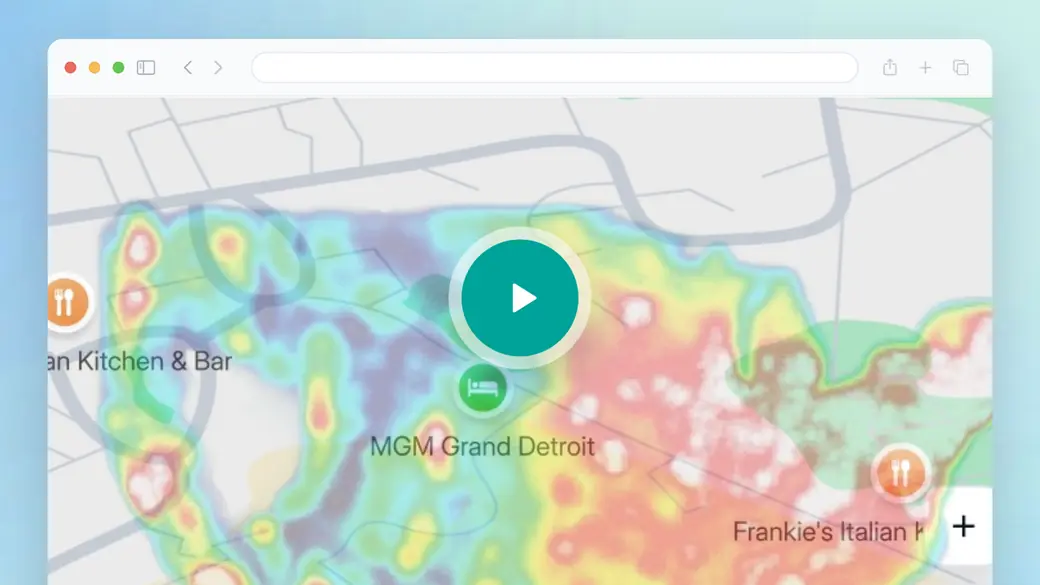
Focus on the workflow: measuring one site, comparing a portfolio and getting numbers out. ANZ store networks spread over long distances, so look at how Projects group many sites in one place and how exports feed your own models. For a national network those two steps matter more than the map.
- Weekly foot traffic per site, with period-on-period change
- Portfolio rankings and benchmarks in Projects
- CSV, Excel and PDF outputs, plus Parquet feeds to S3 or Google Cloud Storage
Trusted by 300+ organisations · Data across 35 markets






What is location analytics?
Location analytics is the analysis of data linked to physical places. It measures and compares what happens at a site over time. Location intelligence is the wider job of deciding where to open, lease or invest. Location analytics is the measuring and comparing underneath.
In ANZ the term is used for many things: Wi-Fi analytics at airports and venues, website visitor reports, and GIS tools. Huq analyses observed foot traffic and visitor behaviour at any address, with nothing installed on site. That means you can measure a competitor's store as easily as your own.
Typical ANZ uses: ranking stores across states, checking whether a shopping centre refurbishment lifted visits, comparing CBD and suburban performance, and following the effect of a new competitor on a strip. Data refreshes weekly.
What's in Huq's location analytics software
01
Foot traffic metrics
Foot traffic totals, trends and average daily footfall for any CBD, centre or strip site.
02
Benchmarks and rankings
Rank sites against each other and against regional and national benchmarks.
03
Behaviour metrics
Dwell time, visit frequency and dayparts, plus cross-visitation to see shared audiences between sites.
04
Exports and feeds
CSV or Excel per area or combined, monthly PDF reports, and weekly Parquet or CSV feeds.
What location analytics shows across ANZ
Three steps, shown for a store network across both countries.
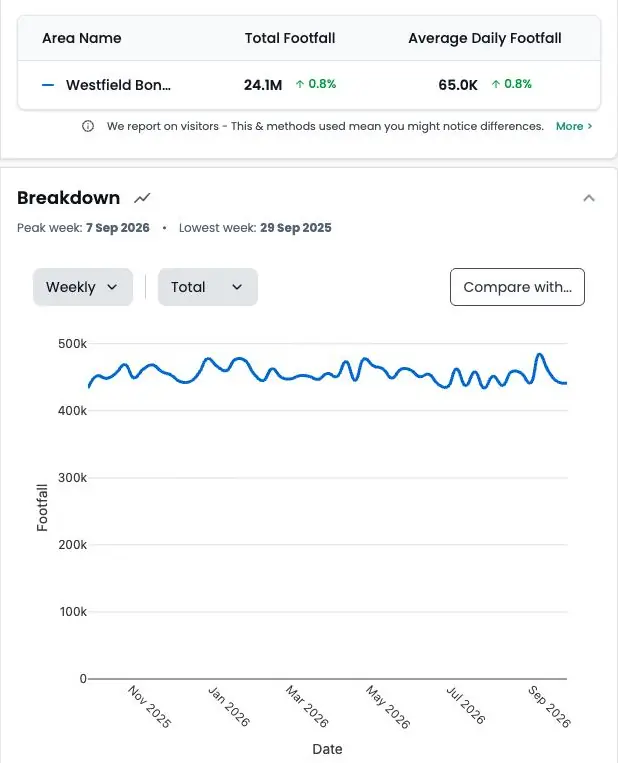
01
Measure a site
Weekly foot traffic, the trend and change on last period for one store. See whether a dip is local or seen across the region.
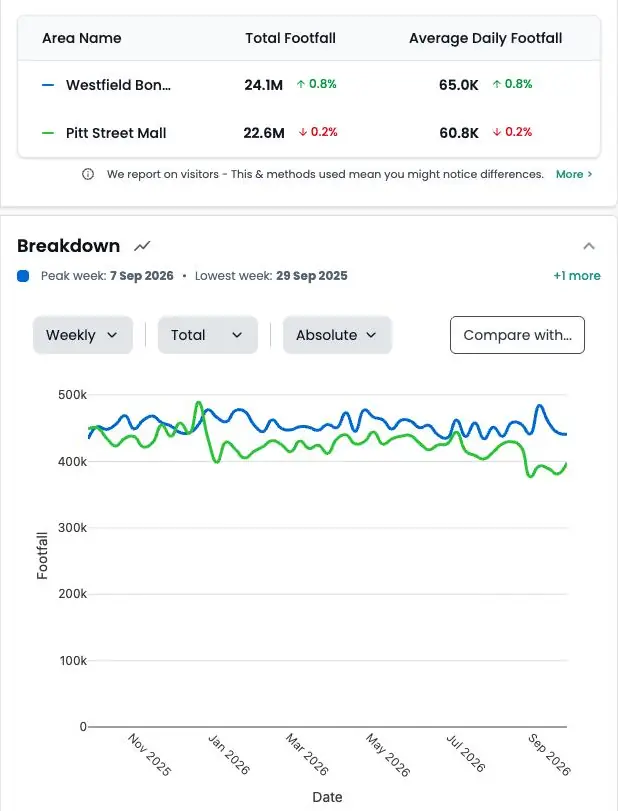
02
Rank the network
Load sites from Perth to Auckland into a Project. Rank them, track status and flag the ones falling behind their benchmark.
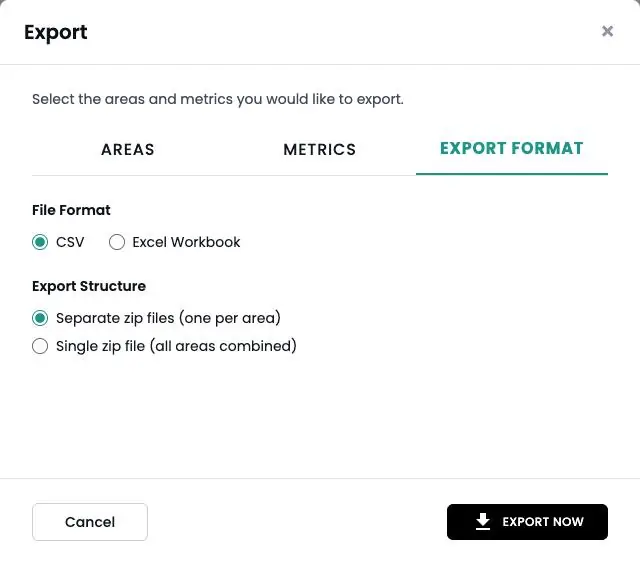
03
Get the numbers out
Export CSV or Excel, share a monthly PDF report, or load weekly Parquet files into your data warehouse.
Location analytics for any address in Australia and New Zealand
How it works
Step 1
Tell us your locations
Add up to five addresses in the form. Your own stores, candidate sites or competitors.
Step 2
We run the analysis
Our team maps each location from observed visitor data.
Step 3
We walk you through it
A short call to take you through what the data shows and what it means for you.
Why ANZ analysts use Huq for location analytics
Who it's for
01
02
03
About Huq
Huq is a location intelligence company. We turn anonymised mobile location data into footfall, catchment and visitor insight for any place, so retailers, property owners and local authorities can make decisions on evidence.
See how your locations really perform
Up to 5 locations. No cost, no commitment.