
retail site analytics
·
Retail site analytics for stores in Australia and New Zealand
Foot traffic, catchment, dwell and nearby competitors for one site at a time, in a shopping centre, CBD or strip retail location.
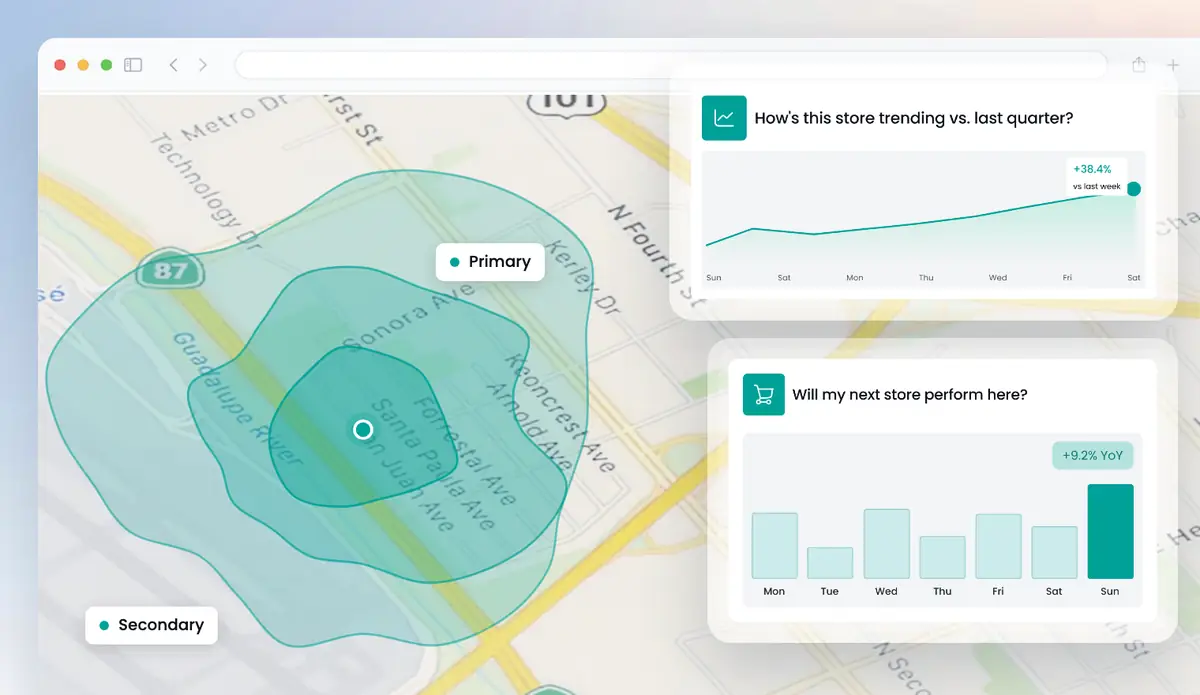
Get a free analysis of your locations
Up to 5 locations. No cost, no commitment.
Retail site analytics answers one question well: how is this particular physical site performing, and why? Huq measures foot traffic, where visitors come from, how long they stay and how the site compares with competitors nearby, for any address in Australia and New Zealand. Use it to check an open store, judge a site before you sign a lease, or explain why one location lags behind the others in your network.
Retail site analytics in the Huq platform
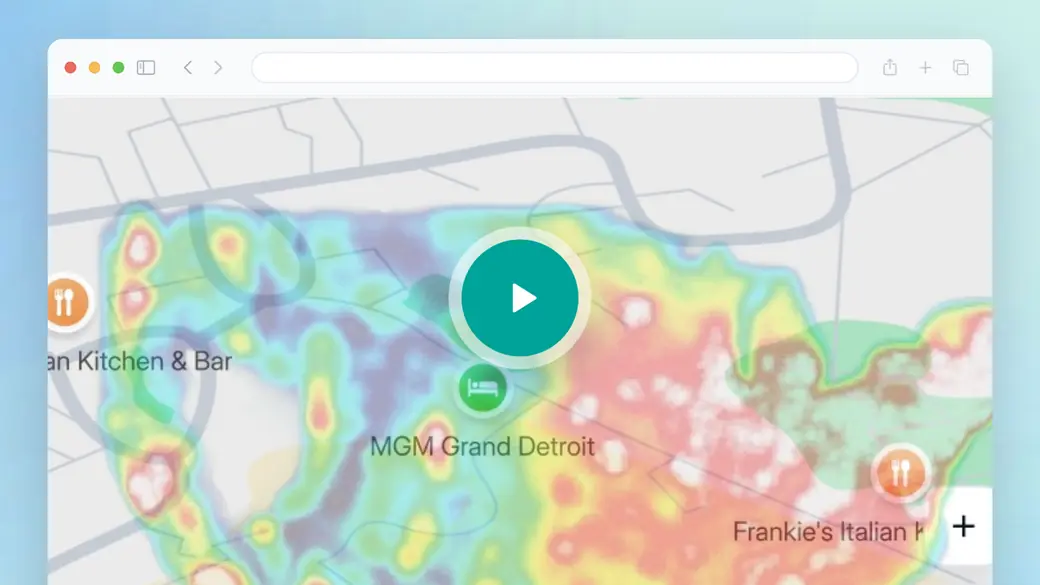
The overview tours the whole platform. For a single-site review, watch how one area is drawn on the Explore map and what a monthly location report includes: foot traffic trend, weekday pattern, dayparts, dwell and catchment, against regional and national benchmarks. That is the core of how you would assess one shopping centre unit, CBD frontage or strip site.
- Draw a site boundary or pick a shopping centre and see its foot traffic trend.
- Add travel-time and catchment layers to see how far visitors travel, in km.
- Compare the site with nearby competitors and the wider centre.
Trusted by 300+ organisations · Data across 35 markets






What is retail site analytics?
Retail site analytics is the close study of one retail location: how many people visit, when they come, how long they stay, which postcodes they come from, and how the site compares with its surroundings. It differs from portfolio analytics, which ranks many stores at once.
In Australia and New Zealand it often comes up at lease time. Retailers want to know whether a shopping centre unit, a CBD frontage or a strip retail site is worth the rent, and whether an underperforming store has a location problem or a store problem. Landlords use the same measures when they pitch a site.
Huq measures any address in both countries without counters or cameras, including sites you haven't opened yet. Data refreshes weekly, and Huq reports a 19.5% MAPE across published markets, against a 30% healthy threshold.
What's in your retail site analytics
01
Site foot traffic trend
Weekly, monthly and yearly visits with period-on-period change, and visiting vs passing traffic at the site.
02
Catchment and travel time
Which postcodes visitors come from, and drive-time or travel-time areas around the site in km.
03
Dwell and dayparts
How long people stay and which hours and weekdays are busiest, to match staffing and opening hours.
04
Local competitor comparison
The same measures for competitors and the centre around your site, so you can judge its share.
What retail site analytics shows
Three views from a single-site review.
01
The site's own trend
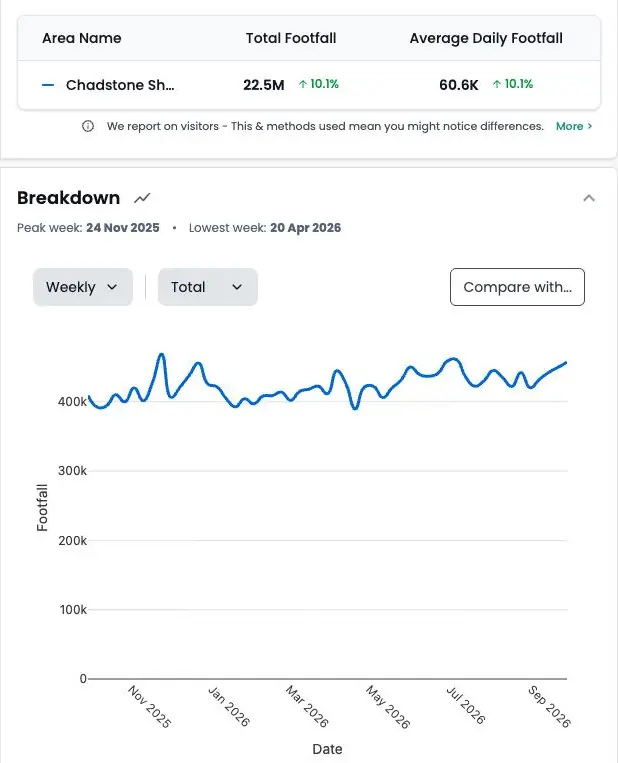
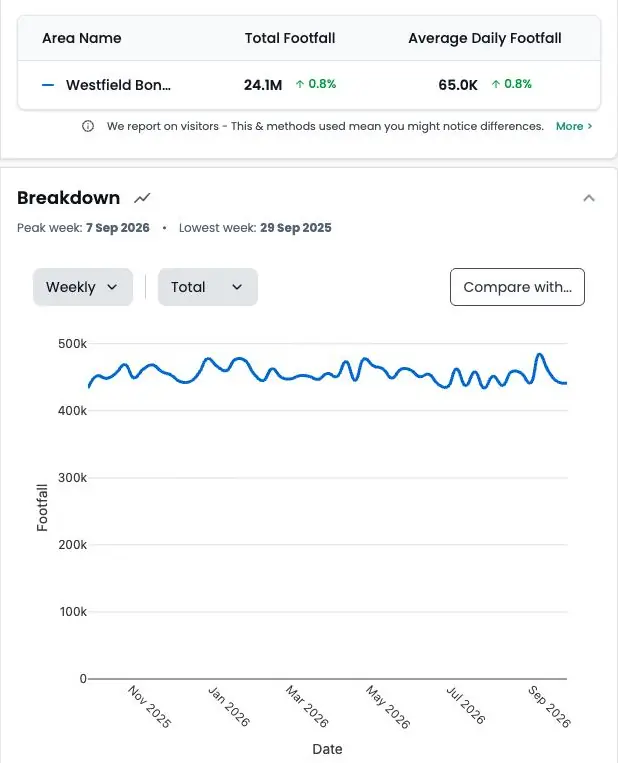
Foot traffic by week, month and year, with average daily foot traffic and change against last year.
02
Where visitors travel from
A postcode catchment and travel-time map showing how far the site reaches, and where it doesn't.
03
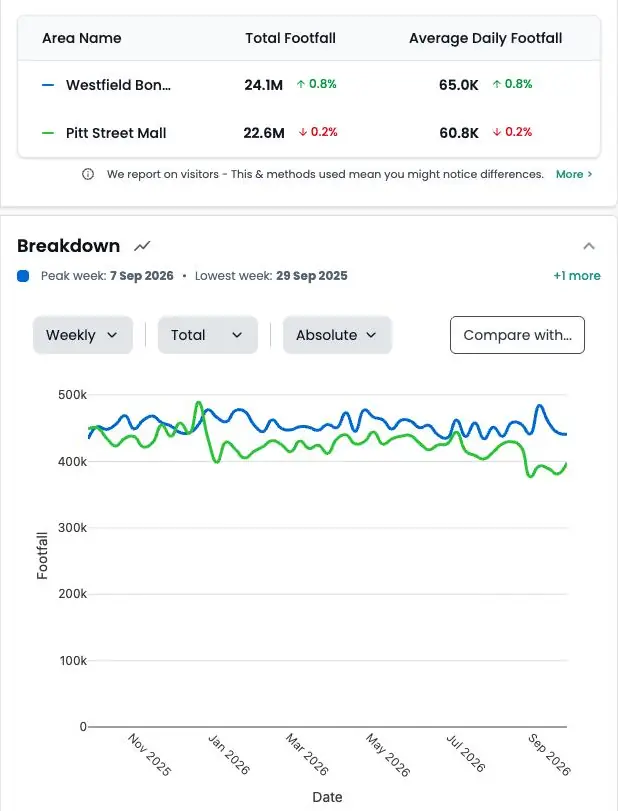
Against the neighbours
Your site beside nearby competitors and its shopping centre or strip, on the same measures.
Retail site analytics for any address in Australia and New Zealand
How it works
Step 1
Tell us your locations
Add up to five addresses in the form. Your own stores, candidate sites or competitors.
Step 2
We run the analysis
Our team maps each location from observed visitor data.
Step 3
We walk you through it
A short call to take you through what the data shows and what it means for you.
Why retailers in ANZ use Huq for retail site analytics
Who it's for
01
02
03
About Huq
Huq is a location intelligence company. We turn anonymised mobile location data into footfall, catchment and visitor insight for any place, so retailers, property owners and local authorities can make decisions on evidence.
See how your locations really perform
Up to 5 locations. No cost, no commitment.