
ANZ footfall analytics
·
Footfall analytics for Australian and NZ retail locations
Benchmarks, competitor comparison and monthly reports for shopping centres, CBD and strip retail across Australia and New Zealand.
Get a free analysis of your locations
Up to 5 locations. No cost, no commitment.
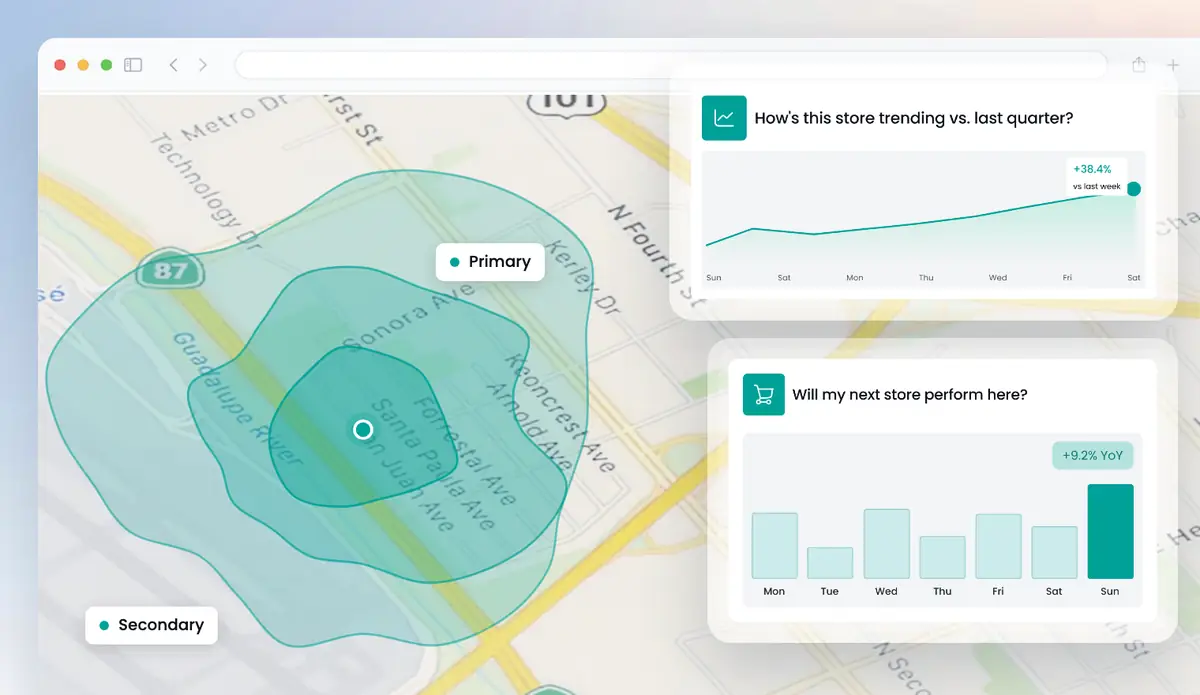
Huq's footfall analytics shows how any shopping centre, CBD store or strip retail site in Australia and New Zealand is performing, and why. Compare a location with nearby competitors and with regional and national trends. See peak hours, dwell time and how often people return. Monthly PDF reports turn it into something you can hand to a leasing team or an investment committee. No counters are needed.
Footfall analytics in Huq: what to look for
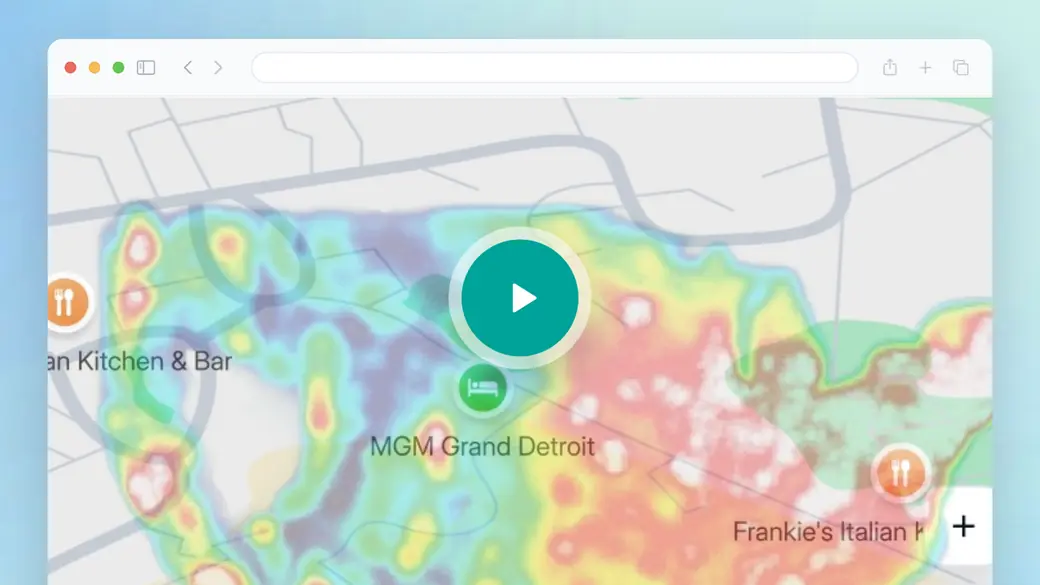
The overview is a general tour. For footfall analysis across Australia and New Zealand, focus on Projects: that's where centres and stores in different states, or both countries, would sit in one view. Then think about the monthly PDF location report, the format a leasing team or investment committee would actually read.
- Weekly trends with benchmarks and period-on-period change.
- Dayparts, weekday patterns and dwell time per site.
- Projects for monitoring a whole portfolio and reporting on it.
Trusted by 300+ organisations · Data across 35 markets






What is footfall analytics?
Footfall analytics, often called foot traffic analytics in Australia, explains what's behind visitor numbers. For a landlord the question is usually whether a centre is losing share to a rival centre or to strip retail nearby. For a retailer it's whether one store is weak or the whole precinct is quieter. For a local council, it's whether a CBD or precinct programme lifted foot traffic and dwell more than in similar places.
Shopping centre landlords and large retailers in Australia and New Zealand often run counters at their own entrances. That covers their own doors well, but nothing beyond them. Huq covers any address, so the same analysis extends to rival centres, other states and tenancies you're considering.
Huq publishes accuracy country by country. Across published markets the MAPE is 19.5% against landlord-reported footfall, under a 30% healthy threshold. Huq manually validates more than 1,000 locations in each of its 35 markets twice a year.
What's in your footfall analysis
01
Benchmarks that give context
Each site's trend against regional and national footfall, so you know if the site or the market moved.
02
Competitor and centre comparison
Your store or centre next to rivals nearby, measured the same way.
03
Dayparts, dwell and frequency
Busiest hours, time spent on site and how often visitors come back.
04
Monthly PDF location reports
KPIs, benchmarks, weekday patterns, density map, catchment, dayparts and dwell in one shareable file.
What footfall analytics shows
Three views teams use to explain performance to managers, tenants and investors.
01
Site vs benchmark
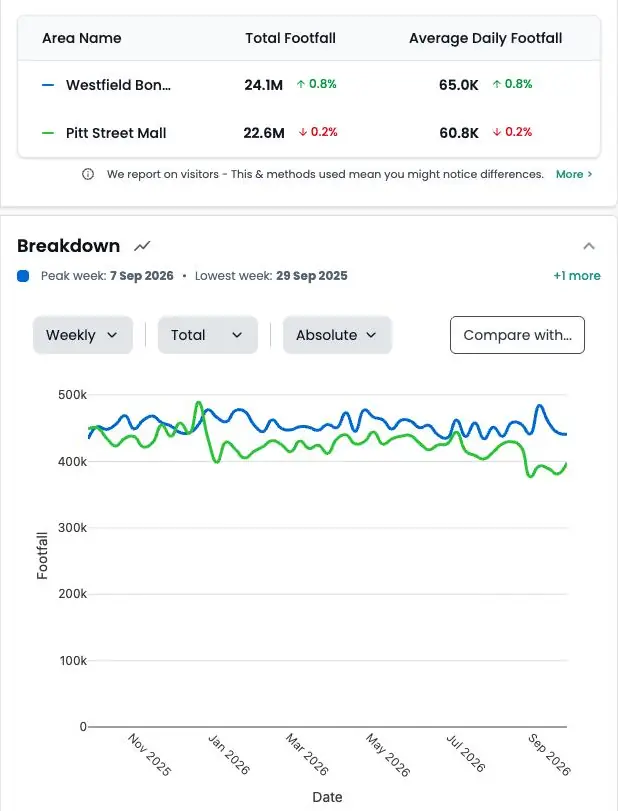
A location's weekly footfall against regional and national trends, with period-on-period change marked.

02
Trading hours check
See the busiest hours and weekdays, and compare them with trading hours, rosters and promotions.
03
Portfolio in Projects
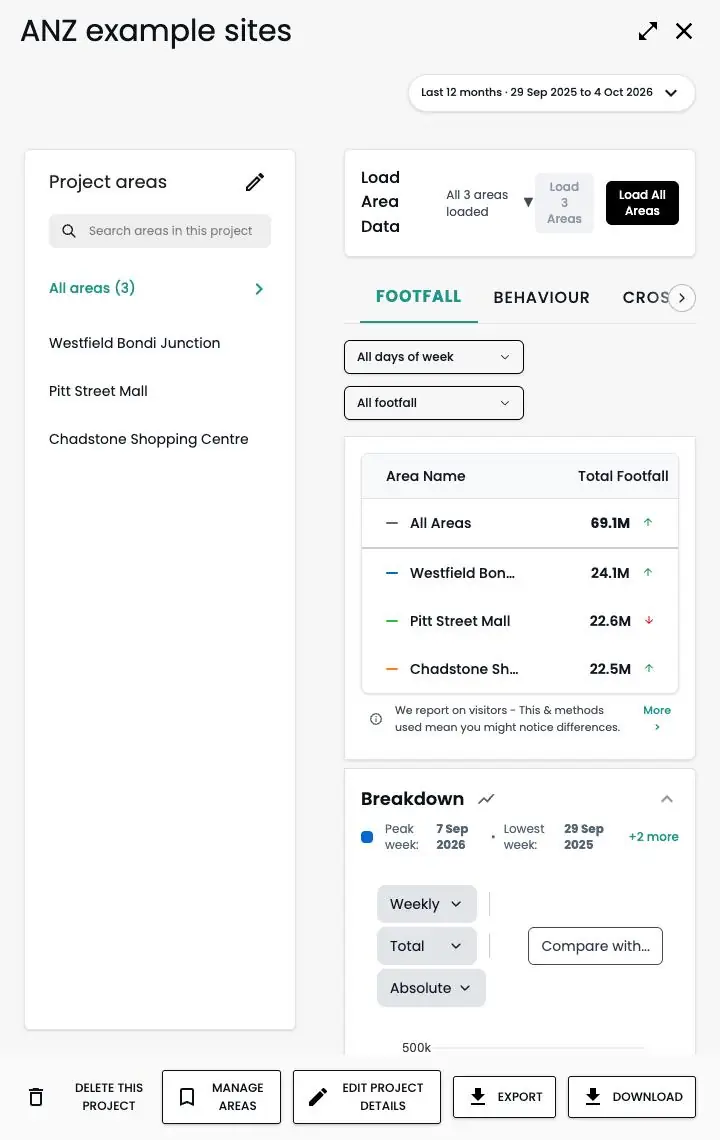
Group stores or centres across both countries, track each one's status and share one consistent report.
Footfall analytics across Australia and New Zealand
How it works
Step 1
Tell us your locations
Add up to five addresses in the form. Your own stores, candidate sites or competitors.
Step 2
We run the analysis
Our team maps each location from observed visitor data.
Step 3
We walk you through it
A short call to take you through what the data shows and what it means for you.
Why ANZ teams use Huq for footfall analytics
Who it's for
01
02
03
About Huq
Huq is a location intelligence company. We turn anonymised mobile location data into footfall, catchment and visitor insight for any place, so retailers, property owners and local authorities can make decisions on evidence.
See how your locations really perform
Up to 5 locations. No cost, no commitment.